![]()
![]()
![]()
L. Lintu
L. Lintu is Industry Planning Officer, Pulp and Paper Branch. Forest Industries Division. FAO. Rome.
Increases in literacy, GNP and population in developing countries will result in continued growth in paper and paperboard consumption, at a faster rate than in developed countries. The production picture is more complex. Production is expected to increase In developing countries, but whether it will rise enough to meet expected demand depends on a variety of unpredictable factors.
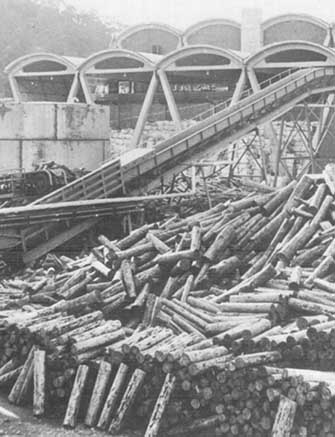
PULPING WOOD IN MEXICO: development will bring new markets
· An analysis of the potential for paper and paperboard in the developing countries has to consider those countries' potential both to consume and to produce paper and paperboard. Developing countries can be grouped together in many ways, but this analysis will concentrate on income levels and geographic regions. It mainly concerns developing countries with market economies; those with centrally planned economies, of which China is the largest in terms of paper and paperboard consumption, will be mentioned when relevant. While this article will deal with the developing countries on an aggregate level only, it is fully appreciated that there are very significant differences between individual countries.
In 1980 the total world consumption of paper and paperboard amounted to some 174 million tonnes. Developing countries, here including both centrally planned and market economies, consumed only 28 million tonnes. However, consumption of paper and paperboard has increased in these countries much faster than in other areas of the world. For example, in 1970 about 11 percent of the world's total paper and paperboard was consumed in the developing countries. By 1980 their share had increased to 16 percent (Table 1). This growth has taken place in all the main paper and paperboard grades.
The rapid growth in paper and paperboard consumption has been influenced by three main factors: increase in population, increase in income and increase in literacy.
Table 1. Consumption of main grades of paper and paperboard in developing regions
|
|
1970 |
1980 |
||||||
|
Newsprint |
Printing and writing |
Other |
Total |
Newsprint |
Printing and writing |
Other |
Total |
|
|
millions de tonnes |
||||||||
|
Developing market economies |
1.8 |
2.1 |
5.6 |
9.5 |
2.7 |
4.7 |
10.8 |
18.2 |
|
Africa |
0.1 |
0.1 |
0.4 |
0.6 |
0.1 |
0.2 |
0.6 |
0.9 |
|
Latin America |
1.1 |
0.9 |
3.5 |
5.5 |
1.3 |
1.9 |
6.1 |
9.3 |
|
Near East |
0.1 |
0.3 |
0.4 |
0.8 |
0.3 |
0.4 |
0.8 |
1.5 |
|
Far East |
0.6 |
0.8 |
1.3 |
2.7 |
1.1 |
2.1 |
3.4 |
6.6 |
|
Centrally planned Asia |
0.6 |
1.2 |
2.6 |
4.4 |
1.7 |
2.6 |
5.2 |
9.5 |
|
Total developing countries |
2.4 |
3.3 |
8.2 |
13.9 |
4.4 |
7.3 |
16.0 |
27.7 |
|
World total |
21.5 |
27.1 |
78.9 |
127.5 |
26.7 |
41.9 |
105.1 |
173.7 |
|
Developing countries as percentage of world total |
11.3 |
12.0 |
10.4 |
10.9 |
16.5 |
17.5 |
15.3 |
16.0 |
Source: FAO yearbook of forest products, 1981
Table 2. Shares of population, of GNP and of paper and paperboard production and adult literacy rates in the main economic regions of the world
|
|
Population |
GNPa |
Adult literacy rates |
Paper/paperboard consumption |
||||
|
(percentage of world total) |
(percentage) |
(percentage of world total) |
||||||
|
1955 |
1980 |
1955 |
1980 |
1950 |
1979 |
1970 |
1980 |
|
|
All developing countries |
68.1 |
73.6 |
20.7 |
21.5 |
33 |
56 |
13.0 |
18.2 |
|
Low-income |
44.7 |
47.1 |
8.1 |
4.8 |
20 |
51 |
4.4 |
6.8 |
|
Middle-incomeb |
23.4 |
26.5 |
12.6 |
16.7 |
48 |
68 |
8.6 |
11.4 |
|
High-income oil exporters |
0.2 |
0.3 |
0.1 |
1.4 |
14c |
32 |
0.0 |
0.1 |
|
Industrial non-market economies |
12.4 |
10.7 |
8.6 |
12.4 |
98c |
100d |
7.4 |
7.1 |
|
Industrial market economies |
19.3 |
15.4 |
70.6 |
64.8 |
97 |
99 |
79.6 |
74.6 |
|
World |
100.0 |
100.0 |
100.0 |
100.0 |
|
|
100.0 |
100.0 |
Source: World Bank, World development report 1982.
a Evaluated at current prices and exchange rates.b Includes Greece. Israel, Portugal, Romania, South Africa and Yugoslavia which in FAO statistics are classified as developed countries.
c In 1960.
d In 1977.
According to World Bank information (Table 2), in 1980 nearly three-quarters of the total world population lived in the developing countries. Twenty-five years earlier, the population of the developing countries had been about 68 percent of the world total. A similar development can be noticed in the growth of GNP, although on a less dramatic scale. In 1955 the share of the developing countries was some 20.7 percent of the world total GNP whereas by 1980 it had increased to 21.5 percent. The principal factor influencing the consumption of cultural papers -newsprint and other printing and writing paper - in the developing world is the rapid increase in the rate of adult literacy. In 1950 approximately one-third of the adult population in the developing countries was able to read. By 1979 the literacy rate had increased to 56 percent. The development has been most dramatic in the low-income countries, where nearly half of the world's population is living today.
There is a significant imbalance between the proportion of world population living in the developing countries and both paper and paperboard consumption and GNP. In 1980 three-quarters of the world's population were able to consume less than one-fifth of the total paper and paperboard produced in the world, a situation caused, of course, by the fact that their share of total world GNP was only 21.5 percent in 1980 and also partly by the fact that only 56 percent of the adult population was literate.
Table 3. Average growth rates of population, of GNP per caput and of paper and paperboard consumption with rates of literacy in the main economic regions of the world
|
|
Population |
GNP per caput |
Literacy rates |
Paper and paperboard consumption |
|
|
(world percentage) |
(percentage) |
(world percentage) |
|||
|
1970-1980 |
1970-1980 |
1970 |
1979 |
1970-1980 |
|
|
All developing countries |
2.2 |
3.1 |
46 |
56 |
6.6 |
|
Low-income |
2.1 |
2.4 |
29 |
51 |
7.8 |
|
Middle-incomea |
2.4 |
3.1 |
64 |
68 |
6.0 |
|
High-income oil exporters |
5.1 |
1.3 |
26 |
32 |
17.1 |
|
Industrial non-market economies |
1.1 |
2.8 |
92b |
100c |
2.8 |
|
Industrial market economies |
0.8 |
2.4 |
98 |
99 |
2.5 |
|
Total |
1.9 |
1.9 |
- |
- |
3.2 |
Source: World Bank, World development report 1982, FAO yearbook of forest products, 1981.
a. Includes Greece, Israel, Portugal, Romania, South Africa and Yugoslavia.
b. In 1960.
c. In 1977.
Table 4. Projected growth in populating and GNP per caput in the developing countries.
|
|
Population |
GNP per caput, 1980-19900 |
|
|
1980-2000 |
Low |
High |
|
|
(world percentage) |
|||
|
All developing countries |
... |
2.2a |
3.3a |
|
Low-income |
1.8 |
0.7 |
1.8 |
|
Middle-income |
2.3 |
2.1 |
3.4 |
|
High-income oil exporters |
2.6 |
2.9 |
4.0 |
Source: World Bank, World development report 1982
a. Exclude China.
Consumption of paper and paperboard is, however, growing faster in developing than in industrialized countries. The average annual growth in paper and paperboard consumption from 1970 to 1980 was about 6.6 percent in the developing countries while in the industrialized countries the increase remained at about 2.5 percent per year (Table 3).
In quantitative terms, the increases still remain small in most of the individual countries. In all developing countries, the increase in total consumption of paper and paperboard between 1970 and 1980 amounted to some 14 million tonnes, which is less than one-third of the increase of over 46 million tonnes in the world as a whole. The projected growth rates for population and GNP appear to indicate that the relatively fast growth in paper and paperboard consumption in the developing countries will continue (Table 4).
Developments foreseen in the literacy rate also indicate increased needs for paper. The World Bank has stated that "if progress continues at recent rates, a literacy rate of 78 percent in the low-income countries of today can be expected by year 2000". This is a significant rise over the present 56 percent.
FAO's Industry Working Party has estimated that paper and paperboard consumption in the developing countries with market economies will be about 22.4 million tonnes in 1985 and 29.5 million tonnes in 1990. It should be pointed out, however, that the projections made are trend estimates and therefore indicate not exact volume for any specific year but only an order of magnitude.
Also, in the longer term, there is every likelihood that the consumption of paper and paperboard will continue to increase in developing countries faster than in industrialized countries, not only because of the expected continuation in growth in population and income but also because of the overall low level of per caput consumption, which is still far from saturation point.
Table 5. Production of main grades of paper and paperboard in developing countries (in millions of tonnes)
|
|
1970 |
1980 |
||||||
|
Newsprint |
Printing and writing |
Other |
Total |
Newsprint |
Printing and writing |
Other |
Total |
|
|
Developing market economies |
0.5 |
1.3 |
3.9 |
5.7 |
1.0 |
3.8 |
8.0 |
12.8 |
|
Africa |
- |
- |
0.1 |
0.2 |
- |
0.1 |
0.2 |
0.3 |
|
Latin America |
0.3 |
0.6 |
2.9 |
3.8 |
0.5 |
1.7 |
5.1 |
7.3 |
|
Near East |
- |
0.1 |
0.2 |
0.3 |
0.1 |
0.2 |
0.3 |
0.6 |
|
Far East |
0.2 |
0.6 |
0.7 |
1.3 |
0.4 |
1.8 |
2.4 |
4.6 |
|
Centrally planned Asia |
0.6 |
1.2 |
2.6 |
4.3 |
1.5 |
2.7 |
4.8 |
9.0 |
|
Total developing countries |
1.1 |
2.5 |
6.5 |
10.0 |
2.5 |
6.5 |
12.8 |
21.8 |
|
World total |
21.6 |
27.3 |
79.3 |
128.1 |
26.5 |
42.5 |
106.2 |
175.1 |
|
Developing countries as percentage of world total |
5.0 |
9.2 |
8.1 |
7.8 |
9.4 |
15.2 |
12.1 |
12.4 |
Source: FAO yearbook of forest products, 1981.
Table 6: Estimated self-sufficiency rates by main grades of paper and paperboard in developing regions
|
|
1970 |
1980 |
||||||
|
Newsprint |
Printing and writing |
Other |
Total |
Newsprint |
Printing and writing |
Other |
Total |
|
|
(Percentage) |
||||||||
|
Developing market economies |
27.3 |
64.5 |
69.3 |
60.2 |
36.5 |
81.2 |
74.0 |
70.3 |
|
Africa |
19.6 |
31.5 |
31.3 |
30.2 |
18.6 |
44.6 |
38.9 |
37.7 |
|
Latin America |
22.5 |
67.1 |
80.9 |
67.9 |
37.5 |
89.2 |
84.0 |
78.8 |
|
Near East |
12.8 |
34.8 |
51.1 |
41.4 |
32.2 |
42.9 |
37.5 |
38.1 |
|
Far East |
33.1 |
77.1 |
55.0 |
56.1 |
38.4 |
85.7 |
71.1 |
70.3 |
|
Centrally planned Asia |
95.7 |
100.8 |
98.6 |
98.8 |
89.7 |
100.7 |
92.5 |
94.3 |
|
Total developing countries |
44.1 |
77.4 |
78.5 |
72.3 |
56.7 |
88.2 |
80.0 |
78.5 |
Source: Based on information in Tables 1 and 5.
In 1980, the developing countries, comprising both centrally planned and market economies, produced nearly 22 million tonnes of paper and paperboard (Table 5). This is only about 12 percent of the world's total production, even lower than their share of world consumption, which implies that the developing countries as a group are net importers of paper and paperboard. However, paper and paperboard production has increased faster in the developing countries than in other areas of the world, as indicated by the shares of world totals shown in Table 5. This development can be noted in the case of all main grades.
The recent growth in production has been somewhat faster than that in consumption. This has resulted in an increase in developing countries' ability to meet internal demand for paper and paperboard. As shown in Table 6, the developing countries in 1970 were able to satisfy about 72 percent of their paper and paperboard consumption requirements from their own production. In 1980 the self-sufficiency rate was already 78.5 percent. The developing countries in centrally planned Asia are nearly self-sufficient in newsprint and other paper and paperboard; in printing and writing-paper supply they have been able to meet demand fully. With both newsprint and other paper and paperboard, however, they have been compelled to rely more and more on imports, as there has been some reduction in self-sufficiency between 1970 and 1980.
In the developing countries with market economies, there has been a significant increase in self-sufficiency in all grades, although most of the newsprint still has to be imported. Africa and the Near East are still heavily dependent on imports, while the Far East and, especially, Latin America have already reached relatively high rates of self-sufficiency in printing- and writing-paper and other paper and paperboard.
Within the "other paper and paperboard" category, there are two grades - kraft liner and sack kraft - in which the developing countries have a very low rate of self-sufficiency. These grades, together with newsprint, are typical bulk grades which have to be produced in efficient, relatively large-scale integrated units in order to be competitive. Furthermore, they are based on long-fibre raw materials which in many of the developing countries cannot be found in natural forests. A dependency on the import of these three bulk grades will therefore continue to lower the self-sufficiency rate of the developing countries.
Recent estimates of future growth indicate that paper and paperboard capacity in the developing countries will continue to grow faster than the world average. In the developing market economies, the average annual growth between 1980 and 1986 is estimated to be nearly 5 percent per year, which is somewhat less than the increase in consumption projected by the Industry Working Party. In comparison, the growth in world capacity is foreseen to remain around 2-3 percent a year. Table 7 shows the capacities by main grades in the developing regions for the years 1980 and 1986.
Table 7. Capacity of main grades of paper and paperboard in developing regions (in million of tonnes)
|
|
1980 |
1986 (projection) |
||||||
|
Newsprint |
Printing and writing |
Other |
Total |
Newsprint |
Printing and writing |
Other |
Total |
|
|
Developing market economies |
1.5 |
4.0 |
10.9 |
16.4 |
2.5 |
5.3 |
13.9 |
21.7 |
|
Africaa |
- |
0.2 |
0.5 |
0.7 |
0.1 |
0.4 |
0.8 |
1.2 |
|
Latin America |
0.7 |
1.9 |
6.7 |
9.3 |
1.2 |
2.6 |
8.5 |
12.3 |
|
Asiab |
0.8 |
1.9 |
3.7 |
6.4 |
1.1 |
2.4 |
4.6 |
8.2 |
|
Centrally planned Asia |
1.0 |
2.5 |
5.7 |
9.2 |
1.1 |
2.8 |
6.3 |
10.3 |
|
Total developing countries |
2.5 |
6.5 |
16.6 |
25.6 |
3.6 |
8.1 |
20.3 |
32.0 |
|
Developing countries as percentage of world total |
8.7 |
13.8 |
13.6 |
13.0 |
10.2 |
14.2 |
15.1 |
14.1 |
Source: FAO pulp and paper capacity surveys.
a. Africa, south of Sahara and North Africa.
b. Far East and Near East.
Table 8. Consumption, production and net imports of paper and paperboards in developing market economies (in million of tonnes)
|
|
Actual 1980 |
Projected average for 1985-1990 period |
||||
|
Consumption |
Production |
Net imports |
Consumption |
Production |
Net imports |
|
|
Developing market economies |
18.2 |
12.8 |
5.4 |
25.0 |
17.5 |
7.5 |
|
Africaa |
1.2 |
0.5 |
0.7 |
2.3 |
1.0 |
1.3 |
|
Latin America |
9.2 |
7.3 |
1.9 |
13.1 |
9.9 |
3.2 |
|
Asiab |
7.6 |
4.8 |
2.8 |
9.6 |
6.6 |
3.0 |
a. South Africa and Sahara
b. Far east and Near East
Comparison of the estimated paper and paperboard capacity with actual production in the developing market economies in 1980 reveals a capacity utilization rate of some 78 percent. Several factors, mostly related to infrastructure, explain this relatively low rate, and no drastic changes can be expected here in the short term. Naturally, over a longer period of time, when the efforts to remove infrastructural obstacles start to bring results, the capacity utilization rate can be expected to increase. In the following summary of the quantitative outlook for paper and paperboard consumption and production during the period 19851990, the capacity utilization has been assumed to reach some 80 percent.
Table 8 summarizes projected consumption, production and net import requirements as an average for the 1985-1990 period. The self-sufficiency rate of the developing market economies is foreseen to remain unchanged at some 70 percent because of a slight improvement in capacity utilization to compensate for the difference in growth rates of projected consumption and capacity. It can be seen that toward the end of the 1985-1990 period, the import needs in the developing market economies may have reached some 7.5 million tonnes, or about 2 million tonnes more than in 1980.
Whether this increase will actually take place depends, to a significant extent, on the potential of the developing countries to pay for the paper and paperboard imported. Several factors are reducing the ability of many of the developing countries to increase imports, chiefly the rapid rise in levels of foreign debt, debt service and the oil bill. A number of developing countries have been placed in a liquidity squeeze. According to the World Bank, the ratio of debt service to exports of the oil-importing developing countries rose from 9 percent in 1972 to 15 percent in 1979 and accelerated to 19 percent by 1981. When the oil bill is added on top of debt servicing, not much is left of the export income in many developing countries to pay for imports of other products, including food.
In the developing countries there is a demand for cheap grades of paper and paperboard, especially for wrapping and packaging purposes. Unless these are made locally from waste paper, they are not available, simply because they are no longer produced in the developed countries. More importantly, because of the low value of these products, they cannot carry the additional cost of long-distance transport.
There has been a persistent trend toward a decrease in the importance of paper pulp in paper production in the developing countries, in spite of the relatively rapid increase in paper production. This indicates a trend toward an increasing use of waste paper as a fibre furnish component in paper-making. How long this trend will continue will depend on the development of requirements for paper and paperboard quality.
Another factor affecting the structure of production is the size of mills that the industry in the developing countries will be able to establish. Large, export-oriented pulp and paper projects are risky, especially if there is no domestic market to absorb a major share of production. Market size is a limitation in most developing countries. Lack of know-how and expertise also increases the risks involved in large-scale projects. For operating small and medium-size paper mills, however, many of the developing countries already possess adequate knowledge and skills, which is proved by the number of mills of this type at present operating with success in these countries.
However, in the longer term, the developing countries as a group have the potential to increase the scale of production and improve the quality of paper and paperboard by using their wood resources that are available in abundance. The developing countries contain extensive areas of tropical forest. According to a study by FAO and UNEP, the area of natural wood vegetation in 76 countries of the world extends over 2969 million hectares. Of chief importance are the closed broad-leaved forests which constitute 39 percent of the area under natural wood vegetation 654 million hectares in tropical Africa, 214 million hectares in tropical America and 292 million hectares in tropical Asia.
The countries of tropical Asia, for example, which possess one-quarter of the closed broad-leaved forests, already play a vital role in sustaining the forest-based industries of the world. About one-half of the productive closed broad-leaved forests of this region are, however, still considered to be "virgin". The extent of these undisturbed productive forests gives a rough indication of the future log-production possibilities in these countries. But before developing countries can begin to base their paper and paperboard production on new or available forest resources, their domestic markets should increase to a level that will sustain production units of adequate economic size.
In many of the developing countries, policies are indeed already geared toward increasing self-sufficiency in the supply of paper and paperboard. An increasing proportion of new paper and paperboard capacity has temporarily been established on the basis of raw materials other than wood-pulp. However, with the increase in both quality requirements and the size of domestic markets, new mills based on wood rather than non-wood raw material will have to be established. Like all new ventures, new paper and paperboard industries in developing countries are sensitive in the beginning to various risks. Uncontrolled pricing of imported paper and paperboard in particular can cause serious damage to a local industry, especially during recession periods, when the industry in the developed countries makes efforts to maintain its capacity utilization at as high a level as possible and occasionally makes deliveries of certain quantities at unusually low prices.
The fast growth in consumption of paper and paperboard in the developing countries provides a firm basis for them to increase domestic supply. It should be noted, however, that such increases will occur from a very small base. Many countries will continue to have domestic markets too small to justify any local production, most specifically of the three bulk grades - newsprint, kraft liner and sack kraft. Abundant raw material resources, especially in the tropical forests, while at present contributing only marginally to paper production, form another important factor for increasing domestic paper supply, especially in the longer term. Other factors contributing to the ability of developing countries to maintain and increase domestic supply of paper and paperboard are the knowledge and skills being developed in the already-existing industry and, in a few countries, a relatively advanced system of machinery and equipment manufacture.
![]()
![]()
![]()