Jean-Marc DESLOUS-PAOLI
On the contrary to the (U. S. where they represent but 4.6% of the total marine production (CHEW and DONALDSON, 1985) (Table 1), mollusc, principally bivalves, can no longer be considered as a marginal production. In France, 100 000 ton of oysters, 98% of which is represented by Crassostrea gigas (HERAL et al., 1985a) and 85 000 ton of mussels (Mytilus edulis, Mytilus edulis galloprovincialis) (DARDIGNAC), 1985) are produced yearly. Elsewhere, new rearings are being developed, such as pectinidae and Ruditapes philippinarum, on the Atlantic and Mediterranean coasts.
The species presently cultured, some of which depending only on natural collections (Crassostrea gigas, Mytilus edulis, Mytilus galloprovincialis while others depend on hatchery production, either partially Crassostrea gigas in the U. S., Pecton maximus, Ostrea edulis, or totally (Ruditapes philippinarum, Crassostrea virginica, Argopecten irradians (Table 1 – 2)
In addition, the development in laboratories of mollusc strains with higher growth potential, or showing more resistance to disease, will be derived exclusively from hatchery productions.
Furthermore, the decrease in growth performance and in quality of Crass sostrea gigas cultured in the big french shellfish ponds(HERAL et al., 1985b) and the successive mortalities through epizooties which struck Crassostrea angulata and Ostrea edulis, requires a better comprehension of the relation existing between the rearing environments and the molluscs cultured there or those which live naturally in competition. Due to the fact that these organisms are sedentary, the comprehension of those relations require the knowledge of not only the seasonal and daily variations of the quality and quantity of the food available and which is brought by the currents, but also the knowledge of the nutriment requirements linked with the physiological evaluation of the individuals.
Thus the studies carried out on food, whether those pertaining to larvae produced in hatcheries, or living in natural environments, or hatchery adult broad-stock or those cultured in natural environments, become necessary so as to guarantee larval and adult productions of quality and at lower prices and so as to implement the rational management of the molluscs stocks exploited.
From the general equation by WINBERG (1956) which has been reexamined and modified by different authors (RICKER, 1968; CRISP, 1971; GRODZINSKI et at., 1975; LUCAS, 1982; HOLMES and Mc INTYRE, 1984) the transfers can be synthetized by the following equation (Fig. 1).
C = R + F + U + P
where C : Consumption (filtration or captured)
R = Re + Rs + Ra : respiration
Re : overheating
Rs : standard metabolism
Ra : activity
F = F' + F" : biodeposits
F' : Pseudofaeces
F'' : faeces
U = Ua + Uc : excretion
Ua : non assimilated
Uc : products from catabolism
P = Pg + Pr + Ps + Pe:production
Pg : growth
Pr : reproduction
Ps : secretions(mucus, she (1, byssus)
Pe : eliminated tissue(predation desquamation)
Larvae do not start eating until the veligerous stage has been reached (Table 3). Until the metamorphosis takes place, they ensure the capture of particles by means of the muco-ciliary mechanism of the velum (fig. 2). When the metamorphosis takes place, the velum regresses and is anatomically replaced by the labial palps which are employed to start out particles before ingestion (fig. 3). The function of the food particle retention is then ensured by the gill filaments which are developing and whose ciliary quivering ensure the intrapalleal circulation of the sea-water.
(see OWEN, 1974; PANDIAN, 1975; PURCHON, 1974; MORTON, 1983)
Three main families can be distinguished by their predator organs (OWEN, 1977). These are the prosobranchia, the septibranchia and the lamellibranchia.
The prosobranchi feed by means of their ciliary tracts which they stick out of the sediment. The labial palps permit quantitative sorting out. Ctenidia are present but their importance for the supply of food is unknown.
Septibranchia have modified Ctenidia forming muscular septa which can open and close. These animals feed on debris and big particles.
Lamellibranchi can use the food deposited on the bottom or that floating in the water depending on whether they have or have not siphons. The principal organ for filtration is the gill. Mussels have (DARDIGNAC, 1985), two gills. (figure 4). Linked to the viscerel mass by the branchial axis. each one has two rows of flat filaments. These filaments face the ventral side of the mollusc (direct or descending branches, bend round abruptly, and then turn round and up facing the dorsal side (reflexed or ascending branches. On the contrary to the oyster, the extremities of the reflexed branches are not connected to the visceral mass; also, all the filaments are similar to one another and placed in uniform rows (smooth gills). Each direct branch is linked to the corresponding reflexed branch by three very flexible bridges which are tissue expansion. Otherwise, clumps of cilia link each filament to the neighbouring one and delimit the spaces between each, these spaces are known as ostia (fig 5). The lateral sides of the filaments (fig 6). are organised with frontal, latero-frontal and literal cilia, which by their movement, create and maintain the circulation of the water in the palleal cavity. The current penetrates in between the lobes of the mantle, crosses through the gills while passing by the ostia and flows out through the exhaling siphon.
From 1851 onwards (DRAL, 1967) the gill was considered as a sieve,whose meshes where formed by the latero-frontal cilia. However, no one could figure out hoe smaller sized particles than the meshes were retained . In 1905, it was remarked that the latero-frontal cilia were covered by a layer of sticky mucus, which explained how the particles were kept back, as they stuck to the cilia. The study carried out by DRAL (1967) on the movement of the latero-frontal cilia and the retention of particles by the Mytilus edulis L shows the power of retention of mollusc depends both on the movement as well as on the Frequence of the quivering of the cilia.
When the particles are captured by the gills, they are directed towards the marginal grooves (junction of the direct and reflexed branches of the filaments) or dorsal grooves (extremities of the reflexed branches) and conveyed towards the labial. palps which direct them towards the mouth where they are ingested.
After 48 hours with D. shaped larvae, the different regions of the digestive tract differ from each other and prefigure the digestive tract of the adults (Fig. 2–3). It is at pediveliger stage that the digestive gland starts showing two lobes which are the anlages of the two caecals of the adult gland. The morphology of the digestive gland will only be complete when young adult stage is reached
The Crassostrea gigas (LESBENERAIT, 1985), at adult stage, opens its mouth between the labial palps. In its mouth follows the oesophagus, which bends slightly and leads to the stomach. The latter communities by means of canals, with the digestive gland, a pigmented khaki colour mass (Fig. 8).
The stomach is extended posteriorly by means of a cylindric caecum in an oblique position: The stylet bag in which lies the cristalline stylet, protrudes largely into stomach cavity.
Half separated from the stylet bag by two typhlosoles, major and minor, which come out of the stomach, the intestinal pipe is very slack and in a spiral shape which runs lengthwise along the stylet bag. At the posterior end of the tract, the intestinal pipe opens onto the intestine, into a corresponding groove, while the stylet bag, is prolonged a little longer to the rear and opens into the other groove of the intestine; both organs, pipe and stylet bag, are then separated in the terminal region.
From the beginning, the intestine presents a recurrent route (ascending branch) in the shape of a dorso-ventral curl around the stomach and the digestive gland, and then directs towards (descending branch) the posterior end of the animal. From the intestine then follows the rectum which runs along the dorsal external side of the adducent muscle and is finished off by the anus, which opens into the palleal cavity.
With the exception of the gastric shield, the digestive tract is lined with ciliated epithelium of numerous glandular cells, having a glycoproteinic secretion. The muscular wall is not very well developed. Thus the histological structure of the digestive tract appears very uniform, the only variations, depending on the regions, being the height of the ciliated cells and the density of the glandular cells. The gastric shield is an exception. It comprises a layer of high cells, covered with a thick, chitinous and sclerotic cuticle (ARNOLD, 1976).
The digestive gland is made up of a great number of tubules at the blind extremity, communicating with the stomach, by a series of ramified channels (Fig. 8). The glandular tubules open onto a short secondary channel which is the same for many tubules, the channel then continues on to the principal channel. The principal channelsjoin up together in channels of larger and larger diameter before entering into the stomach.
The glandular tubules contain two categories of cells: the digestive and secretory cells.
The digestive cells are more numerous. These are high cells, whose apical part shows some microvillosities (Fig. 9). The nucleus is basal, the mitochondria are quite numerous. The presence of heterophagical vacuoles at different stages of evolution, characterize these cells. In the routine metabolism, they have the functions of intracellular digestion, which are followed by the functions of extracellular digestion, by the emission of fragmentation spheres when the feeding conditions vary.
The secretory cells are characterized by a cytoplasm rich in vesicles of rough endoplasmic reticulum. The nucleus has a developed nucleolus (Fig. 10). It has an intense synthesis and proteinic secretion.
The different canals and tubules of the digestive gland are surrounded by a reserve tissue formed of cells of conjunctive nature, with lots of lipidic and glycogen granulas.
The digestive gland of Mytilus galloprovincialis larvae changes very early (LUBET, 1978). 48 hours after fecundation (larvae D), it contains the different cellular types, characterizing the adult gland: secretory and digestive cells. The process of digestion and the absorbtion starts when stage D is reached. The activity of the gland is remarked by the formation of lipid globules which are evacuated by exocytosis and can be taken back by the amoebocytes.
One fifth of the phytoplanktonic species belonging to 37 types, have been listed, to feed mollusc larvae and juveniles in hatcheries and nurseries (CHRETIENNOT-DINET et al., 1986). However, from these species, only ten of them are used regularly in aquaculture (Table 4). These algae have been selected in accordance to three criteria. They must be of adequat size, good nutritional value, and relatively easy to culture.
Size is a limiting parameter concerning the diameter of the mouth and the oesophages of larvae juveniles and adults.
The nutritional value depends on the species which are to be fed, and their development stages. Indeed, the larvae can be more or less demanding (in descending order: Crassostrea Ostrea Mytilus and Mercenaria) In addition, the requirements of the animals develop with time, and a species of poor nutritional quality for the young stages can be of better quality for the older stages. The nutritional quality also depends on the intrinsic quality of the phytoplanktonic species used. However, the biochemical composition of an algae varies, depending on the Function of the culture (LAING and MILLICAN, 1986), while NEWKIRK and KAYARAT (1985) remark that an increase in survival and growth of Ostrea edulis larvae. It has also been demonstrated that the kind of lipids in the food ration will intervene in the notion of the nutritional quality. Certain unsaturated fatty acids, in particular, those of 6 w 3 group favour the growth of oyster larvae and of juveniles. At present, the nutritive quality of an alga can not however be explained by only its biochemical composition, but all authors acknowledge the superiority of a plurialgal type food concerning the growth of larvae, and of the water supply containing natural elements (HELM et al., 1973).
The facility in the production of cultures is very important in hatcheries and nurseries of industrial type where the quantities of algae produced can reach 10,000 litres per day (example SATMAR in France).
In order to feed larvae in the same way as marine bivalve juveniles, different nutritional sources have been tested (Yeasts, minced macrophytes, vegetable and animal extract, etc…) but these have all turned out to be of little effect. On the other hand, the importance of bacteria has been remarked by MENGUS (1978) and PRIEUR (1981). Also the use of lyophilized algae and enriched microcapsules seem more promising. Nevertheless, at present, only live unicellular algae produced in culture contain all the suitable elements for the feeding requirements of bivalves at young stages in either hatcheries or nurseries.
If the presence of inorganic particles in the matter held in sespension does not supply any digestible matter, it can however contribute, either negatively or positively to the development of molluscs, depending on the concentration and type of mineral used. The addition of argillaceous suspension can be even. recommended so as to facilitate the ingestion of artificial preparations which are given in the first fattening of oysters (LANGTON and BOLTON, 1984) and their digestion when there exists feeble concentrations of algae (EWARD and CARRIKER, 1983). This also helps to reduce the costs of artificial rearings (URBAN and LANGTON, 1984) and to increase the growth rates of oysters (ALI et PRUDER, 1983) (Fig. 11).
The dissolved substances which are contained in the sea-water or in the phytoplanktonic culture mediums also play a leading part. WILSON (1979) demonstrates that the filtrates of Isochrysis galbana cultures, at stationary phase, speed up the capture of cells by the bivalves, while the filtrates at declining stages are inhibited from doing so.
In the studies in situ, if one of the first explicative factors for growth is the temperature, this is but the third explicative factor for the production of flesh of Crassostrea gigas. Thus HERAL et al (1984) demonstrate a close connection for the production of flesh with phytoplankton and phytobenthos whether in a degenerated form (pheopigments) or live (chlorophyl). On parallel, LELONG and RIVA (1976) demonstrate in situ the action of phytoplankton on the growth of Rudit'apes decussatus. These relations with phytoplankton are confirmed for the fattening of oysters (DESLOUS-PAOLI et al., 1982) (Fig. 13) for the growth of mussels (KAUTSKY, 1982) and for the energetic tenor of Ruditapes decussatus (BODOY ar PLANTE-CUNNY, 1983).
Otherwise, the pernicious influence of a too elevated sestonic load has been demonstrated with the production of flesh by VAHL (1980) for Chlamys is lar dica, by WILDISH et al., (1981) for different lamellibranches and by DESLOUS-PAOLI et al (1981), HERAL et al., (1983) and DESLOUS-PAOLI and HERAL (1984) for Crassostrea gigas. On the contrary, the importance of bacteria (PRIEUR, 1981) often associated with particles, has been pointed out by MARTIN (1976) for Ruditapes decussatus and by AMOUROUX (1982) for Venus verucosa.
In the coastel waters, the levels of dissolved amino-acids vary between 0.2 and 2.9 μ moles per liter (NORTH, 1975). JORGENSEN (1975), at Isefjord, found variations between 0.4 and 2.5 μ moles per liter. In the Marennes-Oleron basin, HERBAL et al. (not published, fig. 14), find fluctuations between 0.2 and 10 μ moles per liter but not presenting significant seasonal peaks, the daily variability during a tidal cycle being superior than the annual variation. The same applies for the dissolved fulvic and humic carbon (FEUILLET et al. (1979). These great variablilities could be caused by the synthesis of absorptions and excretions by molluscs but also by all other organisms.
For the larvae, the ingestion takes place in a continues way, However, the filtration and ingestion rates (Table 5 – 6) can vary depending on numerous parameters.
The efficiency to retain particles depends on the size of these particle For mussel larvae, the optimum capture of particles is situated around ∅ 3.5 um, (Fig. 15) (RIISGARD et al., 1980; SPRUNG, 1984a). The filtration rate depends on the cellular density in the environment and permits to regulate the ingestion (Fig. 16) while decreasing the energy losses caused by the effort made to capture the particles. The ingestion of cells by the larvae depends on the size of the larvae. However, the increase in number of cells ingested, corresponds to the decrease of the percentage which is represented by the ration, with regard to the body weight (Fig. 17) Ingestion also depends on the temperature, thus, on the metabolic level of the individuals. Indeed, UKLES and SWEENEY (1969) register an ingestion of 134 cells of Monochrysis lutheri by Crassostrea virginica larvae of 75 um par day at 10° C while it is 457 cells per larva per day at 27–30° C. Likewise, LUCAS and RANGEL-DAVALOS (1981) remark that the Crassostrea gigas larva ingests 400 cells per day at 21° C and nearly twice as much at 24° C when it is fed a mixture of Isochrysis galbana and Monochrysis lutheri.
For Mytilus edulis fed on Isochrysis galbana, the assimilation efficiency (100 * (respiration + growth ingestion) varies little around 40 % for concentrations of between 5 and 40 cells per liter. On the other hand, it increases up to 75 % for lower cell densities (SPRUNG, 1984b) (Fig. 18). On parallel, the net efficiency of growth, in other words the percentage of energy assimilated for growth, increases from the cell density permitting the acquisition of a maintenance ration, up to a plateau of about 6, 5 % From 10 cells per ul (Fig 19). Indeed, the relation between the larval density in rearing and the availability of food is an important factor for the growth of the larvae (Fig. 20) and must be ajusted according to the size of the larvae.
(See BAYNE and NEWELL, 1983; DESLOUS-PAOLI, 1985)
In feeding conditions, which are much similar to those found in natural environments, the filtration level depends on the physiological state of the animals. Indeed, the high metabolic demand induced when its time for the spawning period and for the reconstitution of gamets of Mytilus edulis to take place, brings about a remarkable increase in filtration rates. These drop to a plateau as soon as spawning ends in the month of June (BOROMTHANARAT, 1986) (Fig. 21). During this period, the amount of material consumed depends on the sestonic load present in the environment.
However, the filtration level depends on the size of the particles having served to define this filtration level. Indeed, the retention of particles is more than 50 % for particles 0f 1 μm for Mytilus edulis (Fig. 22) and of 4 μm for Craasostrea gigas.
A schematic aspect of the relations existing between the sestonic load and the feeding is given by WIDDOWS et al (1979) (Fig. 23). When a certain level of the sestonic load is reached, the quantity of matter retained by the gills exceeds the ingestion possibilities and causes the production of pseudo-faeces. It is still difficult to conclude on whether a qualitative sorting out is made or whether the size of the particles is taken into consideration by the individuals. However, certain authors (KIORBOE et al., 1981; NEWELL and JORDAN, 1983) have remarked a relative enrichment of the ration ingested in comparaison to filtered particles and LOPEZ and CHENZ (1983) pointed out that Nucula annulata ingests selectively the organic and especially the bacterial fraction of the ration consumed. However, they point out that this selectivity can be modulated by sedimentological factors. If the sestonic loads are above values of 200 mg per liter, one will remark a decrease, or even a complete arrest for the capture of particles. This has been remarked for Crassostrea gigas in natural environments, when high sestonic loads were caused by Winter storms. (Fig. 24). On the contrary, when there are low sestonic loads, the efficiency with which the particles are retained increases (Table 7) This mechanism can be used to maintain an optimum ingestion and continues digestion PALMER, 1980b).
The relations between filtration, ingestion and assimilation are schematized for Mytilus edulis by NAVARRO and WINTER ( 1982) (Fig. 25). In this case, point corresponds to the cellular load for which ingestion and assimilation are at optimum. Above this, the assimilation rate is maintained constant by the progressive decrease of the filtration rate. However, with other bivalves, such as Aulacomyas ater. the filtration rate remains constant, which leads to an increase in the cell density. The resulting increase of the digestive transit leads to a decrease of the digestions efficiency which little by little decreases the assimilation (Fig. 26).
The intertidal lateral bivalves have imposed feeding activity rythms by the periodical emergence caused by the tides. However, for species which are constantly submerged the tidal rythms or nychthemerals have not been clearly defined. Certain authors have registered some (SALANKI, 1966; MORTON, 1977; PALMER, 1980; COPPELO, 1982) (Fig. 27), while others have not remarked any (LOOSANOFF and NOMEJKO 1946; WINTER, 1978; HIGGINS, 1980). It seems however that the feeding and digestior rhythms are controlled by the variability of the feed at disposal (LANGTON and GABBOT, 1974; OWEN, 1974; WILSON and LA TOUCHE, 1978; ROBINSON and LANGTON, 1980).
The mechanical aspect of digestion is similar in larvae and adults. It is a trituration, caused by the combined action of the cristalline style of the gastric shield, of the food which is separated and mixed with the enzymes (LUBET, 1978) Only the Fluids and the macromolecules, which result from the extracellular digestion exist in the gastric cavity, are capable of entering into the diverticule (OWEN, 1974). They are then absorbed by the pinocytose and digested by the intercellular passage. The intracellular wastes are rejected by the desintegration of the digestive cell.
The part played by the cristalline style has not yet been clearly described, it seems to act as a never ending screw which carries the fine particles to the epithelium level of the cristalline style sack, for absorption purposes.
At intestine level, digestion and absorption exist in addition to the role of mucilaginous secretion which is used to form and transport faeces.
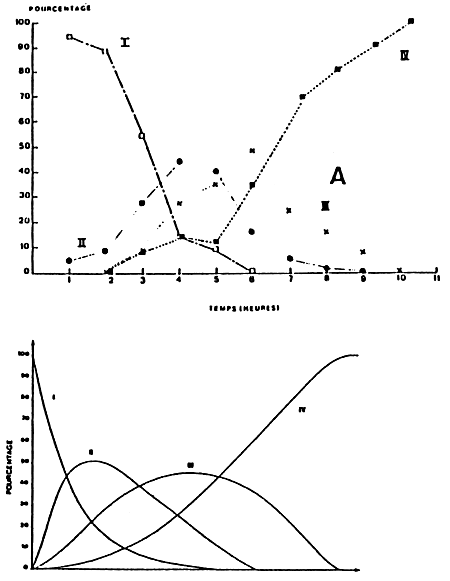
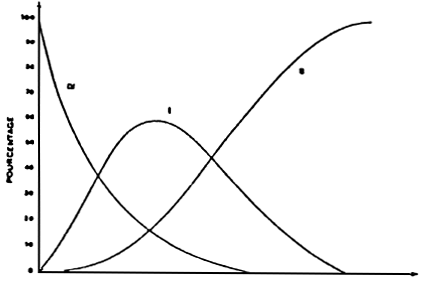
With larvae, the evolution of the digestive gland takes place according to two schemas, depending on whether the feeding takes place continuously or not (LE PENNEC and RANGEL-DAVALOS, 1985). In the first case, all the Pecten maximus larvae ingest and digest at the same time and continuously, after 7 hours of feeding at 16° C, and after 5 hours 20 mn, at 18° C (Fig. 28 b). In the second case, digestion commences 6 hours after ingestion, and finishes after 10 hours at 17° C for Pavlova lutheri (Fig 28 a). The time for digestion varies however according to the algal species employed. Mytilus edulis larvae require 15 hours at 10°C to digest 80 % of the Isochrysis galbana cells and 13 hours with Monochrysis lutheri cells. Digestion is also 2.6 times quicker at 20° C than at 10° C (LUCAS and RANGEL-DAVALOS, 1981).
For Crassostrea gigas adults, the dynamic of the digestive transit takes place in three phases, when a sequential feeding method is employed (LEBESNERAIT, 1985; BOUCAUD-CAMOU et al., 1985).
The infilling of the digestive tube (Fig. 29 a):
This infilling takes place rather quickly, and one can remark intact algae in the stomach, in the principal channels of the digestive gland and in the intestine. It takes around 5–3 hours between 10° C – 20° C for the algae to completely pass through the digestive tube. Then, they are excreted along with a lot of mucus through the anus (Fig. 29 a 1). The temperature has a great influence on this stage (Table 8).
The start of the digestion (Fig. 29 b):
As soon as the alqae enter into the channels of the digestive gland, they are affected (within an hour); while live algae can be observed rather a long time in the stomach (6 hours) and especially in the intestine (8 to 16 hours after feeding). Three to six hours after the commencement of the experiments, the first residues of the digestion appear in the faeces, mixed with numerous live algae (Fig. 29 b 2). Progressively, the percentage of residues will rise, while the faeces solidify and mould themselves into the shape of the rectum. The residues accomulate into a pleated ribbon and are clearly separated from the straight ribbon formed by the intact algae (Fig. 29 b 3). Both ribbons are probably moulded together in the rectal bag so at the start of the digestion at least there are supposedly separate transit tubes for the algae and residues.
The end of the digestion (Fig. 29 c):
The residues will dominate the intact algae, invading all the lumen of the rectum, . and after around 10 hours, homogeneous faeces will be obtained (Fig. 29cl) but we must wait for at least 40 hours to find more live algae in the faeces. They will no longer be excreted continuously, but intermittently, mixed with a lot of mucus. The digestive tract will be completely empty after 50 hours at 20° C, but the digestion can last for 75 hours at 10° C.
As stated by WIDDOWS (1978) the efficiency of digestion and so absorption, depends on the quantity of food available. Indeed, the more food available, the less the need to complete the digestion so to ensure the energy gain necessary for Mytilus edulis. However, as the quantity of food influences the efficiency of digestion so does its composition. BERRY and SCHLEYER (1983) on Perna perna,6BRIEELJ and MALOUF (1984) on Mercenaria mercenaria and BOROMTHANARAT (1986) on Mytilus edulis reveal the increase in efficiency of digestion with an increase of the organic fraction in the food (Fig. 30), thus pointing out the gene that is represented by the mineral seston for the digestion when this makes up 80 % to 90 % of the food ration, as is often encountered in the rearing sectors on the French Atlantic coast. (Fig. 31). Thus, as numerous authors have remarked with different bivalves, the efficiency of absorption varies with the seasons. These variations are probably due to the environmental conditions on one hand and to the requirement of the molluscs on the other. Indeed, it appears that during Wintertime sugars are not used, while during Spring and Summertime around 50 % of the sugars consumed are digested by Mytilus edulis and Crassostrea gigas (DESLOUS-PAOLI and al., 1986) (Table 8), while the lipids are greatly employed during both Summer and Winter. The digestion of the different energetic substrates of the food is thus undouptably induced by the implementation of enzymatic organs adapted to the food requirements. These nutritional requirements are probably linked with the physiological seasonal state of the bivalves.
(See MORTON, 1983)
The study of the dissolution rhythm of the cristallinestyle of Rasaea rubra (MORTON, 1956) and of the structure of the digestive tubules (Mc QUISTON, 1969) along with the results obtained by other authors (MORTON, 1973; LANGTON and GABBOTT, 1974; LANGTON, 1975; MATTEWS, 1976; MORTON, 1977) give to believe that the digestion phases, extracellular in the stomach and intracellular in the digestive tubules are organized in the repetitive phases linked with the tidal cycles. For example, MORTON (1970, 1971) described for Cardmium edule and Ostrea edulis a cycle linked with the tides: The feeding will take place during the high tide cycle, and the matter ingested will not pass through the digestive diverticular before the next high tide, when it will be submitted to intercellular digestion. It is thus during the low tide period that the extracellular digestion is produced in the gastric cavity. The intracellular digestion during out flowing waters and low tide periods will be followed by the fragmentation of the digestive cells and the preparation of the tubules, for the new flow in, of matter during the following high tide cycle.
But numerous authors pointed out that the rhythm of digestion was lost when the animals were placed into continuous immersion or feeding conditions (LANGTON and GABBOT, 1974).
Thus it appears that the synchronism of the digestive processes is regulated by the availability of food(OWEN, 1974; MORTON, 1977; ROBINSON and LANGTON 1980; MORTAN, 1983; HILY, 1985) (Fig. 32), the maximum size of the cristalline style is reached when the stomach is full, and the minimum size, when it is empty (LANGTON and GABBOTT, 1974). This does not differ from the results showing that the rhythm of digestion were under the control of the environmental varients, such as tides or day and night alternance. Indeed, the food levels fluctuate in unnatural environment, especially in relation with the tides for intertidal species.
MASSON (1975) states that from the ovocyte stage, numerous enzymatic activities commence, apart from some lypolitic enzyms which will not develop until after the metamorphosis has taken place, and with the exception of the amylasis which will only commence activity during the pelagic life.
(See OWEN, 1974; MORTAN, 1983)
The studies carried out by HILY (1985) on Ruditapes philippinarum and by BOUCAUD-CAMOU et al., (1985) on Crassostrea gigas will serve as a basis to regroup enzymes according to the actions in the different stages of digestion.
The glucanases (amylase, cellulase, laminarinase) digest the walls of the algae and the reserve substances (starch, laminarine) (BOUCAUD-CAMOU et al., 1985). These glucanasic activities are found in all the epithelium of the digestive system and more so in the digestive tubules. It appears, when digestion commences, that there is a amylase secretion in the stomach, and the glucanases can be found on the surface of the cristallinestyle. The latter then seems to, incorporate the enzymes secreted by the stomach wall (ARNOULT and BOUCHEZ-DECLOUX, 1978).
Lipases and proteases in feeble quantities are found present in the lumen of the digestive tubules and of the stomach. Normally proteases are found in the intestine. The proteins seem to be digested by the enzymes at optimum acid pH (BOUCAUD-CAMOU) et al.,1985).
An intracellular digestion continues in the bordering brushy cells and in the digestive cells by the action of the lysosomale enzymes like the D.glucosidase for glucides (HILY, 1985). the acid phosphatase, the acetyl - glucoseminidase and the peptidase (BOUCAUD-CAMOU et al., 1985). There also exists, at the brushy border level of the digestion canals and in the stomach epithelium, membranar enzymes (peptidases, alkaline phosphatases) which must have a relation with absorption.
Thus, a plan of the digestion of Crassostrea gigas (Fig. 33) is proposed by BOUCAUD-CAMOU et al.,1985): “Oysters seem to fill their digestive tube completely as soon as the food is taken. A flow of particulates enter simultaneously into the stomach and into the canals of the digestive gland. All the substances ring brushy cells. The algal walls are attached as soon as they enter into the digestive canal, due to the action of the glucanases which are particularly active at this level, then progressively in the stomach due to the mechanical and then chemical action of the cristalline style, with the help of the enzymes secreted by the stomach wall and the digestive gland. The food digested and absorbed by the then continue into the digestive gland or else be digested and absorbed by the stomach wall”. The absorption and the intracellular digestion continues in the intestine.
While the experimental work carried out by PEQUIGNAT (1973) points out the nutritional role of the amino-acids and the dissolved sugars, the energetic supply that they represent has, up to present, not been quantified in the energetic balance of molluscs.
Indeed, the branchial epiderm of the lamellibranches is where a strong absorption of the dissolved organic molecules, such as amino-acids, sugars and fatty acids, takes place. Numerous experiments emphasize these mechanisms (JORGENSEN, 1982, 1983; WRIGHT and STEPHEN, 1982; GOMME, 1982; NELL et al., 1983). Thus this absorption is carried out principally at gill, mantle edge, stomach and small intestine level (GOREAU et al., 1973; BAMFORD and GINGLES, 1974; STEWARD and BAMFORD, 1976). Mytilus edulis can thus absorb half of the amino-acids contained in the sea-water which passes through the branchial cavity at concentrations of 1 umole per liter (JORGENSEN, 1983). JORGENSEN (1982) also shows that the absorption of amino-acids from natural water can suffice and supply more than twice the amount of energy necessary for the filtration activity of the gills. On parallel WRIGHT (1982) estimates that the absorption of amino-acids supplies 6 to 60% according to the concentrations available in the water, of the oxydation requirement of the metabolism expressed by the respiration. This mechanism thus permits to satisfy the requirements of 11 essential amino-acids for Mytilus californianus with principally the L-menthionine and L-Lysine Ncl (HARRISON, 1976) as well as taurine which represents 70% of the pool of intracellular free amino-acids of the gills (ZURBURG and DE ZWAAN, 1981). On the contrary, according to NELL et al., (1983), while for amino acids there is an active absorption; for glucose, the absorption appears like a passive diffusion which does not contribute greatly to the carbohydrate needs of the oysters. On the other hand, FANKBONER and DE BRUGH (1978) and FRANKBONER et al.,(1978) point out that oysters and mussels accumulate the organic carbon dissolved in the sea-water and PHLEGER and ROSSI(1982) point out that Hinnites multirugosus juveniles can concentrate 150 times in 24 hours.
On parallel, a certain number of dissolved organic substances can be absorbed in the same metabolic manner and don't play an energetic role but a growth substance role, as does cholin chloride and vitamins (NELL et al., 1983). COLLIER et al., (1953) also pointed out the great beneficial influence of carbohydrates, which are present in marine environments, on the pumping rate and the intervalvular activity of the oysters and THOMSON and BAYNE (1972) on the filtration rates of mussels. These constatations brought about the development of the first artificial diets, employing sugars, lipids and vitamins (CASTELL and TRIDER, 1974; TRIDER and CASTELL, 1980: NELL and WISELY, 1983).
The variety of food found in natural environments, and its variability in a controlled environment, make it difficult to comprehend the nutrition of bivalves.
Indeed, if bivalves are classed as suspensivores and deposivores, this classification is no longer applicable when dealing with animals living in an intertidal environment. The re-suspension of the water-sediment interface leads to an as important participation of the phytoplankton in the food rations of suspensivore animals, such as oysters and mussels for example.
In addition, in a hatchery, a nursery or experimentally, the variability of a same phytoplanktonic species, depending on the factors of the culture environment, or the age of the populations make it difficult to comprehend of the cause-effect relations.
On the other hand, the existing controversy between OWEN (1956) and MORTAN (1973,1983) concerning the rhythms of nutrition, are due more probably to the study of the secondary factors (tides, nycthemerals) rather than the primary ones (food). Indeed, those animals whose feeding rhythm is cyclic in intertidal environments, adapt to continuous feeding when they are fed constantly. Indeed these two authors agree that the digestion depends depends on the availability of food.
However there exist some points where particular efforts are required, if one wishes to fully understand the feeding mechanisms of bivalves. The first is the quantitative and qualitative estimation of the ration really ingested.Up to present,most of the studies have been carried out in conditions which do not bring about the apparition of pseudo-faeces. This means that the totality of the matter filtered was ingested. This is not what normally happens in natural intertidal environments, where the particulate loads are often relatively high. Also the level of digestion is probably linked with the quantity and quality of the food ingested. Indeed, without a doubt a connection is produced between the time of transit of the food in the digestive tract and the level of the different enzymatic activities, which gives an optimization of the energy acquired, depending on the energetic requirements of the animals.
Therefore, the nutrition of bivalves is the result of successive adaptation of the filtration functions, ingestion and digestion, to the amount and the quality of the food available permitting a animal of given physiology to satisfy its requirements in the best way possible.
Table 1. Estimated Five Year Average (1978–1982) of Commercial
Landings for Mollusc in the United States
(from chew and Donaldson, 1985)
| Oysters | Metric Tons (Meat weight) | |
| Pacific | Crassotrea gigas 1 | 2,950 |
| American | Crassostrea virginica 2 | 27,400 |
| Others | 50 | |
| Oyster Total | 30,400 | |
| Clams | ||
| Hard: | Mercenaria mercenaria1 | 6,325 |
| Surf: | Soisula solidissima | 18,850 |
| Ocean quahog: Arctica islandica | 14,740 | |
| Soft: | Mya arenaria | 3,970 |
| Manila: | Tapes japonica2 | 500 |
| Others | 1,315 | |
| Clam total | 45,700 | |
| Scallops | ||
| Bay: | Argopecten irradians2 | 595 |
| Calico: | Argopecten gibbus | 2,490 |
| Sea: | Placopecten magellanius | 12,960 |
| Others | 5 | |
| Scallop Total | 16,050 | |
| Others | ||
| Squids, octopus, Abalone2, Mussels | 42,200 | |
| GRAND TOTAL | 134,3503 | |
1 dependent on hatchery seed for portions of commercial production.
2 seed produced in the hatchery and sold regularly or irregularly to commercial shellfish growers.
Tableau 2 : From Lucas (1981).
- Billan annuel des ventes de naissain par la Seasalter Shellfish, Whitstable (G.B.) exprimé en millers d'individus
| Années | Ostea edulis | Crassastrea gigas | Ruditapes decussaes |
| 1975 | 2374 | 17185 | 236 |
| 1976 | 5134 | 11402 | 0 |
| 1977 | 1860 | 16374 | 357 |
| 1978 | 9324 | 18121 | 1072 |
| 1979 | 9772 | 45085 | 7385 |
| 1980 | 21451 | 57556 | 753 |
- Bilan annuel des ventes de naissain
por la SATMAR, Bardeur, exprime en milliers d'individus
(1) Bilan de juin à juin. (2) Bilan par année civille.
| Années | Osrrea edulis | Crassostrea gigas | Ruditapes philippinarum |
| (1) | |||
| 1974–75 | 0 | 323 | 1979 |
| 1975–76 | 198 | 999 | 1470 |
| 1976–77 | 1579 | 1470 | 1459 |
| 1977–78 | 1765 | 5166 | 2063 |
| (2) | |||
| 1978 | ? | 15383 | 4707 |
| 1979 | 1448 | 29122 | 8534 |
| 1980 | 1527 | 41075 | 18983 |
| TEMPS APRES LA FOUNDATION (en jours) | TAILLE (en μm) | STAGE | CARACTERISTIQUES GENERALES | ORGANES OF NUTRITION |
| 1 | 80 | Trochophore (Trochophore) | Forme de toupie. Couronne ciliée. Glande coquillièere, mais pas de co-quille. | Pas d'alimentation Un archenteron en forme d'U, mais pas de différenciation du tractus digestif. |
| 1+ | 80 – 90 | Post-trochophore (Young veliger) | Sécrétion d'une coquille monovalve | Pas d'alimentation Apparition d'un velum. Tube digestif en voie ce différenciation. |
| 2 à 14 | 90 à150 | Veligère stade D (O shaped or straight-hinge veliger) | Coquille formée de 2 valves à charnière drcite: Prodissoconque I (sécrètée par la glande coquillière) puis Prodissoconque II sécrèté par la manteau | Velum développé rétractable entreles valves. Tube digestif différencié (cesopnage, estomac avec sac du stylet, intestin en U). Glande digestive impaire |
| 15 à 25 | 150 à 230 | Véligère umconée (Veliconcha) | Présénce d'un dissaconque II | Comme ci-dessus, mais giance digestive formant progressivement 2 loces. |
| 26 | 230 à 240 | Veligera oeiilée (Eyed veliger) | Tache pigmentaire ou “oeil” dans les lobes du manteau. Le pied sa différencie. | Comme ci-dessus |
| 27 à 29 | 240à 260 | Pśdivéligère (Pediveliger) | “Oeil” present. pied developpé et functionnel | Velum an reggression progressive. Appareil digestif inchangé. |
| 30 | 250 | Plantigrade (Plantigrde) | Pied. Byssus. Via benthique. filaments branchiaux | Cavitté palléale active. Palpes labiaux. Appareil digestif inchange. |
Tableau 3: Stades larvaires de Mytilus edulis en élevage à 20°C. (Lucas, 1982b) Remarques: les durées des différents stades et les tailles correspondantes ne sont données qu'à titre indicatif, en raison d'une forte variabilité d'origine génétique et écologique. La taille est la plus grande dimension de la coquille sur une ligne parallèle à la charnièra. Les termes anglais sont empruntés à Bayne (1984 et 1976). II faut cependant signaler que cet auteur donne un sens restraint au stade 0 en la faisant correspondre à la prodissonconque I (durée: 1–3 jours): en conséquence le stace veliconcha débute à la prodissoconque II (durée:2 semaines).
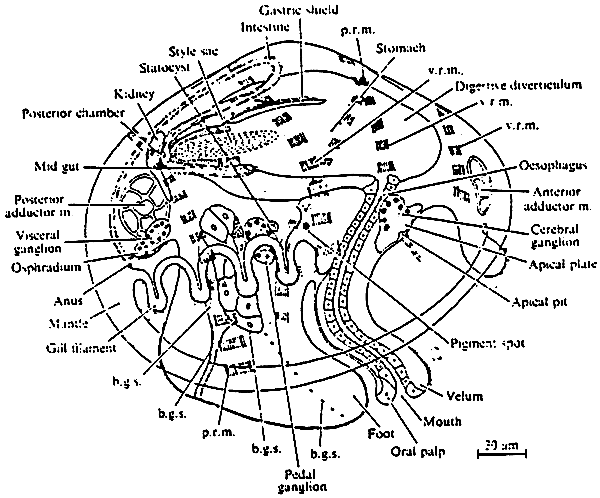
Figure 2: A diagrammatic reconstruction of the pediveliger larva of Mytilus edulis. p.r.m. pedal retractor muscle; v.r.m. velar retractor muscle; b.g.s. byssal gland system. (from Bayne, 1971)
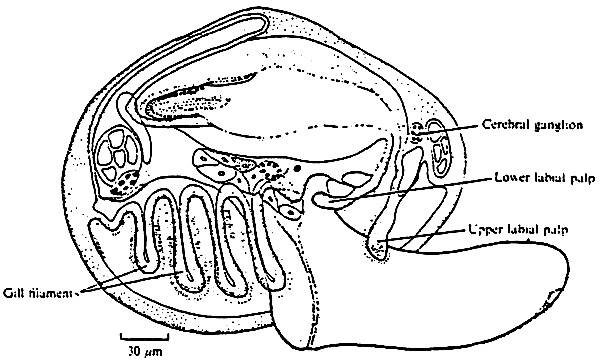
Figure 3: A diagramatic reconstruction of an early plantigrade of Mytilus edulis, immediatly after metamorphosis and before secretion of the dissoconch shell has begun. Organ systems not labelled are as in fig.2 (from Bayne, 1971)
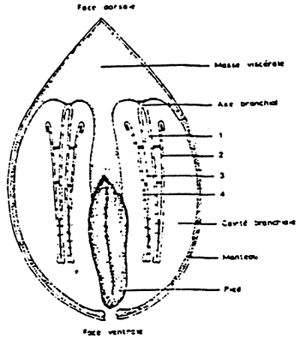
Figure 4: Diagrametic transverse section of a mussel:
(1 – 2) outer demibranchs
(3 – 4) inner demibranchs
(from Dardignac, 1986)
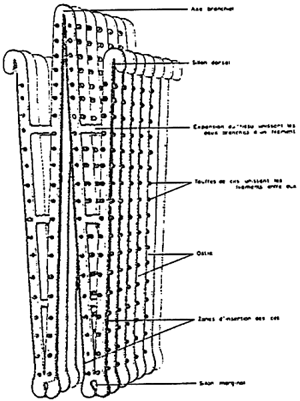
Figure 5: The gill of Mytilus edulis.
(from Dardignac, 1986)
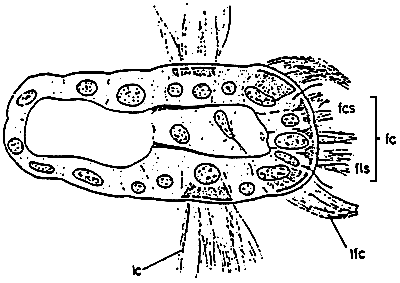
Figure 6: Semidiagrammatic transverse section of a lamellibranch gill filament showing ciliary tracts: fc, frontal cilia fos, frontal tract of short cilia; fls, frontal tract of long cilia; lc, lateral cilia; 1fc, laterofrontal cilia. (from Owen, 1966)
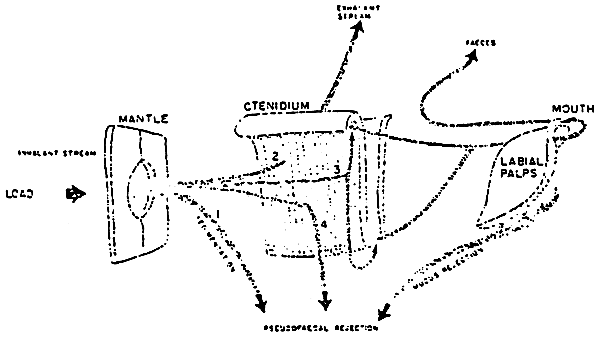
Figure 7: Schematic representation of paths and fate of particulate material drawn into the inhalant pallial cavity. 1: sedimentation of particles; 2: passage through the ostium; 3: impingement upon ctenidium and transportation on frontal mucus bands to food grooves; 4: rejection of large mucus masses. (from Bernard, 1974)
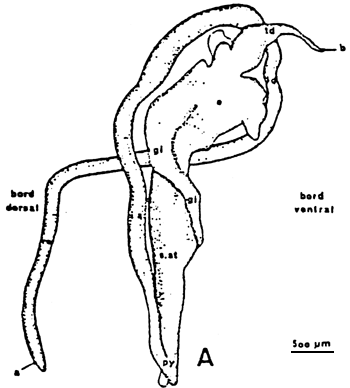 | 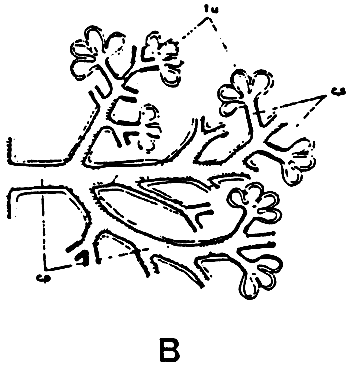 |
Figure 8: Schematic representation of the digest tract (A) of Crassostrea gigas, and of the digestif glande (B). (from respectively Boucaud-Camou et al., 1985 and Owen, 1955)
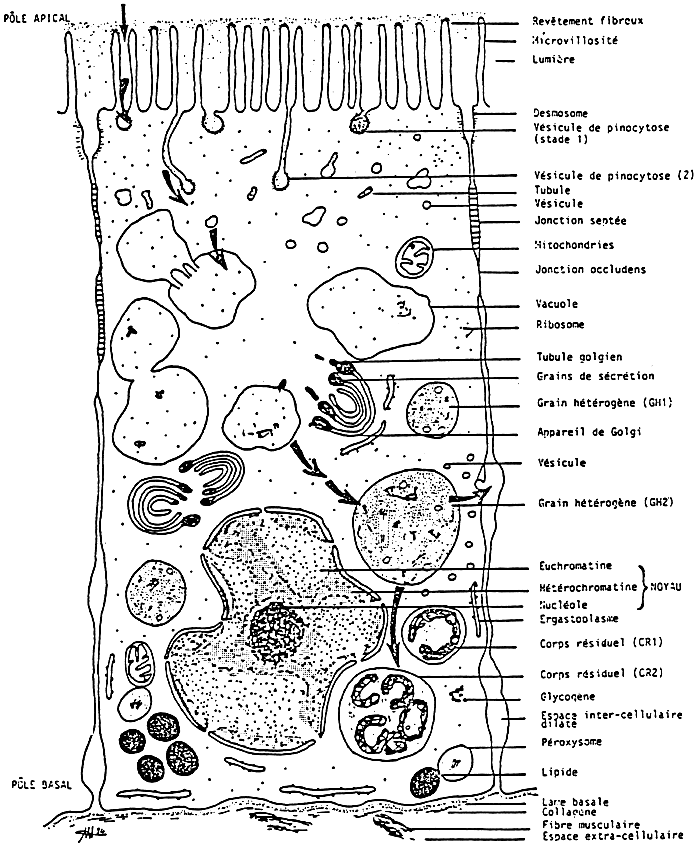
Figure 9: from Henry, 1984a
Schéma d'interprétation ultrastructurale de la cellula digestive des tubules digestifs de la palourde Ruditapes decussatus on métabolisme de routine.
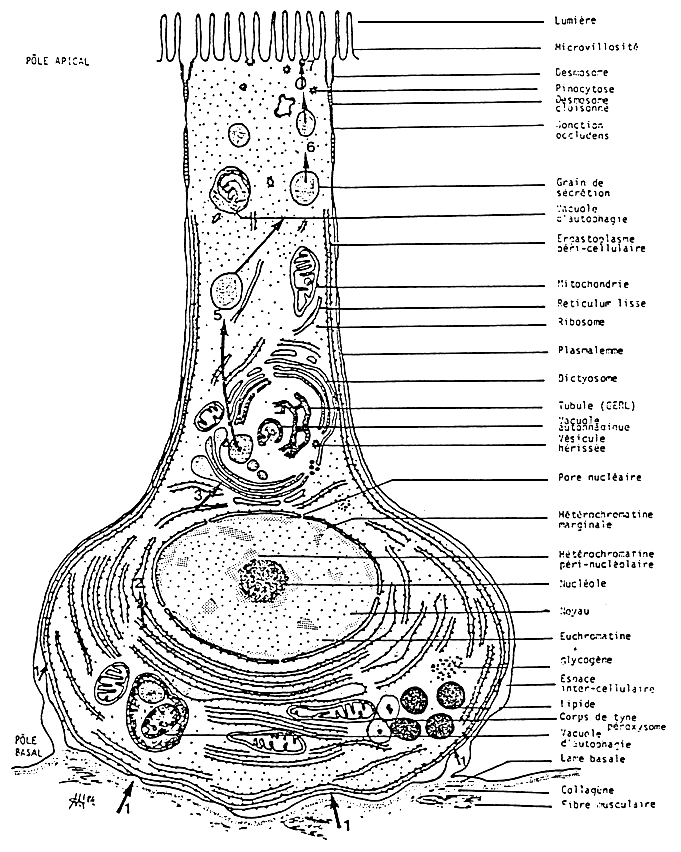
Figure 10: from Henry, 1984b
Schéma d'interprétation ultrastructurale da la callule sécrétrice des tubules digestifs de la palourde Ruditapes decussatus an metabolisme de routine.
Tableau 4 : Percent of use of the main algae in the commercial hatcheries. (from Chretiennot - Dinet et al., 1986)
Nutritive value: *** : Very good
** : good
* : mean
| ALGUE-FOURRACE | Fréquence d'utilisation (en pourcentage) d'apréu LUCAS, 1980 | Fréquence d'utilisation (en pourcentage) d'après WALNE in COST, 1978 |
| Chaetoceros calcitrans *** | 37, 5 | 40 |
| Dunaliella primolecta* | 25 | 0 |
| Isochrysis galbana*** | 75 | 80 |
| Isochrysis off. galbana “Tahiti”** | 0 | 20 |
| Nannochloropsis Oculata* | 25 | 0 |
| Pavlova lutheri*** | 62, 5 | 70 |
| Phaeodactylum tricornutum** | 12, 5 | 50 |
| Pseudoisochrysis paradoxa** | 62, 5 | 50 |
| Pyramimonas Virginica* | 37, 5 | 0 |
| Skeletonema costatum** | 12, 5 | 20 |
| Tetraselmis suecica*** | 25 | 60 |
| Thalassiosira Pscudonana*** | 62, 5 | 40 |
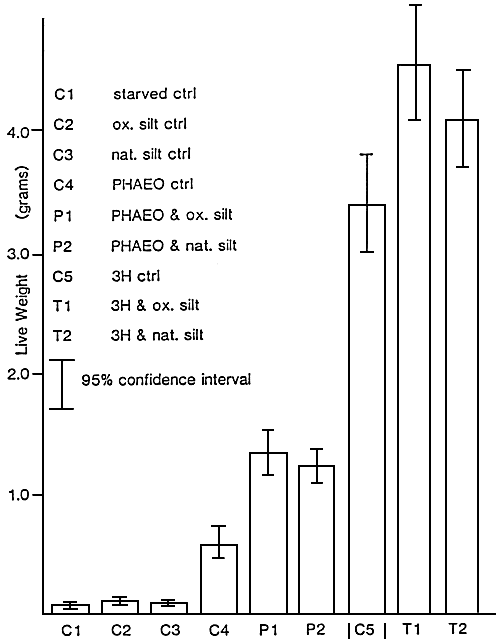
Figure 11 : Average increase in individual live weight of oysters fed
with Phaeodactylum tricornutum (PHAEO), Thalassiosira
pseudonana (3H)and natural and oxydized silt for 7 weeks.
(from Ewart and Pruder, com. pers.)
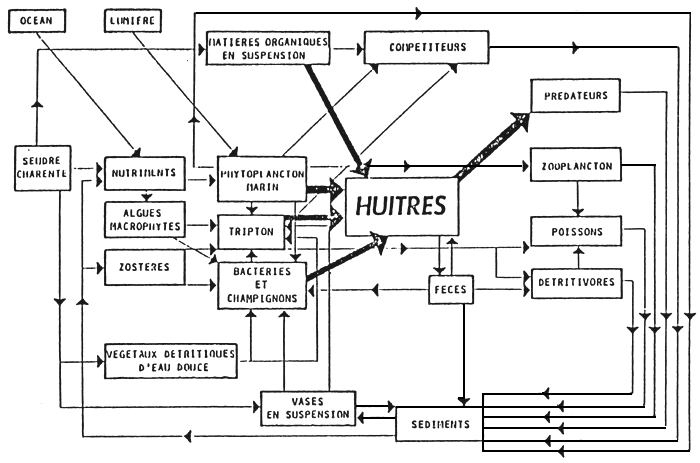
Figure 12 : Schematic diagramme of an oysters' ecosystem in the bay of Marennes-Oléron
(from Heral, 1977)
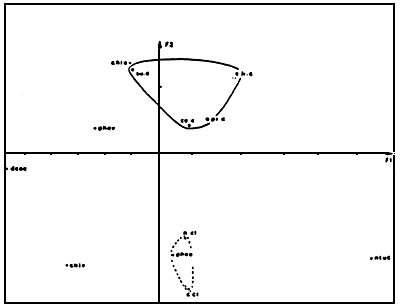
Figure 13 : Factoriel analysis of the relation between oysters and
foods (from Deslous-Paoli et al., 1982)
For the oysters: Protein (pr. c), lipid (li. c), ash (ce.
c), carbohydrate (su.c)
For the foods: turbidity (ntuc), particulate c(C. cl),
particulate N (N. cl), chlorophyl in water (chle) and on
the bottom (chlv), pheophitin in water (phee) and on
the bottom (phev),DCO (dcoc)
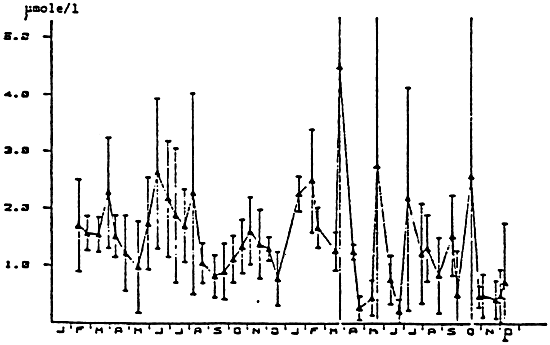
Figure 14 : Variation of the dissolve amino acids in the water of the bay of Marennes-Oleron (from Héral, 1986).
Table 5 : Bivalve larvae: filtration rates reported in literature.
(from sprung, 1984a)
| Species | Shell length (μm) | Temperature (°C) | Food concentration (cellsμ 1-1) | Food alga | Filtrationrate (μ 1 n-1) | Source |
| Ostrea edulis | 200 | 20–22 | 15–26 | flagellates | 27.1 | Jorgensen (1943) with date from Bruce et al. (1940) |
| Ostrea edulis | 218–280 | 19–25 | 31–54 | Isochrysis | 18–20 | Walne (1956) |
| Ostrea edulis | 219 | 23–24 | 8–123 | Isochrysis | 15–42 | Walne (1965) |
| Ostrea edulis | 178–184 | 24 | 8–230 | Isochrysis | 0.8–10 | Walne (1965) |
| Ostrea edulis | 231 | 21–22 | 0–123 | Isochrysis | 13.8–27.5 | Walne (1965) |
| Ostrea edulis | 180–260 | 21 | 20–50 | Isochrysis | 12.5–25.0 | Walne(1966) |
| Ostrea edulis | 228 | 2 | 50–100 | Isochrysis | 0.3–9 | wilson(1960) |
| Ostrea edulis | 250 | 2 | 40–220 | Dunaliella | 1.8–5.4 | Wilson (1980) |
| Crassostrea gages | 87–151 | 25 | 100 | Isochrysis | 2.8–7.0 | Gerdes (1983) |
| Crassostrea gages | 89–294 | 25 | 50–50 | Isochrysis - Chaetoceros | 2.3–93.5 | Gerdes (1983) |
| Mytilus edulis | 170–260 | 16 | 25–380 | Isochrysis | 4–25 | Bayne (1965) |
| Mytilus edulis | 260 | 16 | 64 | isochrysis | 12.5 | Bayne (1965) |
| Mytilus edulis | 260 | 11 | 60 | Isochrysis | 2 | Bayne (1965) |
| Mytilus edulis | 150 | 12 | 1.5–5.5 | Isochrysis | 11.4 | Riisgard et al. (1980) |
| Mytilus edulis | 120–250 | 15 | 3–6 | Isochrysis - Monnchrysis | 16.2–141 | Rusgard et al. (1981) |
| Mytilus edulis | 120–250 | 17–19 | 3–12 | Isochrysis - Monochrysis | 10.6–85.3 | Jespersen and Olsen (1982) |
| Mytilus edulis | 120–250 | 6 | 1–5 | Isochrysis | 4–21 | This Paper |
| Mytilus edulis | 120–250 | 12 | 1–5 | Isochrysis | 10–61 | This Paper |
| Mytilus edulish | 120–250 | 18 | 1–5 | Isochrysis | 17–52 | This paper |
Table 6 : Bivalve larvae: ingestion rates reported in litarature.
(from Sprung, 1984a)
| Species | Shell length (μm) | Temperature (°C) | Food alga | Ingestion rate (cells h-1) | Source |
| Ostrea edulis | 180–195 | 20–22 | Flagellater | 1000 | Bruce et al. (1940) |
| Ostrea edulis | 218–280 | 19–25 | Isochrysis | 1040 | Walne(1956, 1959) |
| Ostrea edulis | 178–184 | 24 | Isochrysis | 133–600 | Walne(1965) |
| Ostrea edulis | 219 | 23–24 | Isochrysis | 591–1517 | Walne(1965) |
| Ostrea edulis | 231 | 21–22 | Isochrysis | 456–2333 | Walne(1965) |
| Ostrea edulis | 180–260 | 21 | Isochrysis | 830–2500 | Walne(1966) |
| Ostrea edulis | 228 | 7 | Isochrysis | 90–900 | Wilson(1980) |
| Crassostrea gigas | >200 | 20 | Isochrysis | 2600 | Maloul and Breese(1977) |
| Mytilus edulis | 150 | 12 | Isochrysis | 81–89 | Riisgard et al. (1980) |
| Mytilus edulis | Whole size spectrum | 15 | Isochrysis - Monochrysis | 150–800 | Jespersen and Olsco (1982) |
| Mytilus edulis | 120–250 | 8 | Isochrysis | 18–80 | This paper |
| Mytilus edulis | 120–250 | 12 | Isochrysis | 41–292 | This Paper |
| Mytilus edulis | 120–250 | 18 | Isochrysis | 38–408 | This Paper |
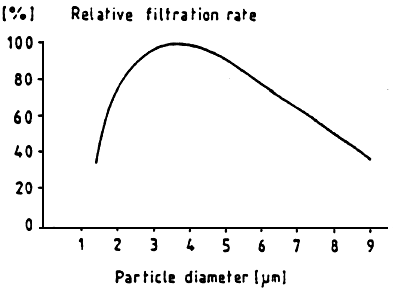 | Figure 15 : Mytilus edulis larv e. Size spectrum
of particle retention. Mean of
spectra corrected to a maximum of
100%: y=-49.31+49.89x-4.17x2 X: Channel of Coulter Counter Y: retention efficiency (from Sprung, 1984a) |
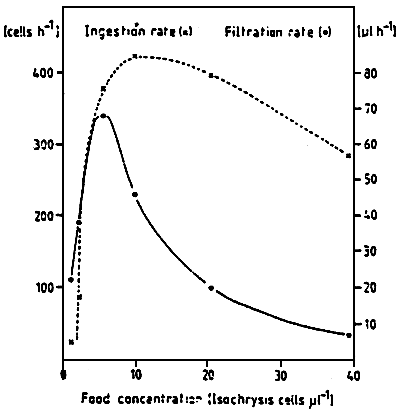 | Figure 16 : Mytilus edulis larvae of 251 um
shell length. Interrelation
between ingestion and filtration
rate at 12°C. (from Sprung, 1984a) |
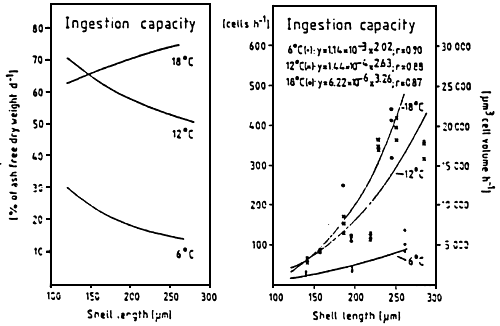 | Figure 17 : Mytilus edulis larvae. Ingestion
capacity of larvae of different
sizes at the experimental
temperatures Y: ingestion capacity (cells. h-1) X: Shell length (um) r: correlation coefficient (from sprung, 1984a) |
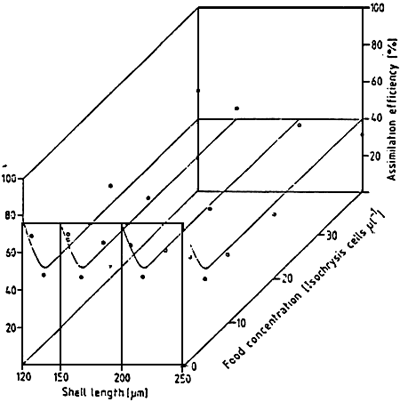 | Figure 18 : Mytilus edulis larvae. Assimilation efficiency (%) at various food concentration and larval sizes. Curves fitted by eye. (from Sprung, 1984b) |
Figure 19 : Mytilus edulis larvae. Gross growth efficiency k1(%) at various food concentration and larval sizes. Curves fitted by eye. (from Sprung, 1984b) | 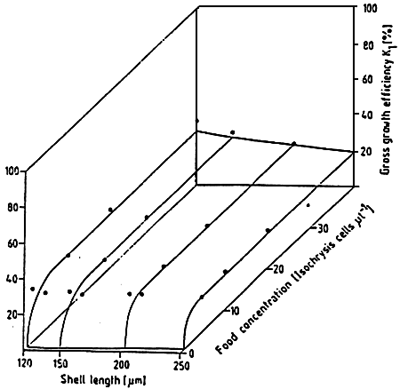 |
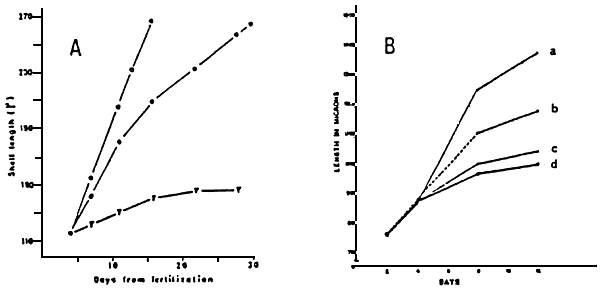
Figure 20 : Growth of Mytilus edulislarvae:
A-Growth of larvae feed with Isochrysis galbana
▼ : Starved
• : 25 cells.ul-1
○ : 100 cells.ul-1
(from Bayne, 1965)
B-with an injection of 50 cells.ul-1.day-1
a : 440 larvae.l-1
b : 2700 larvae.l-1
c : 16500 larvae.l-1
d : 32900 larvae.l-1
(from Davis, 1953)
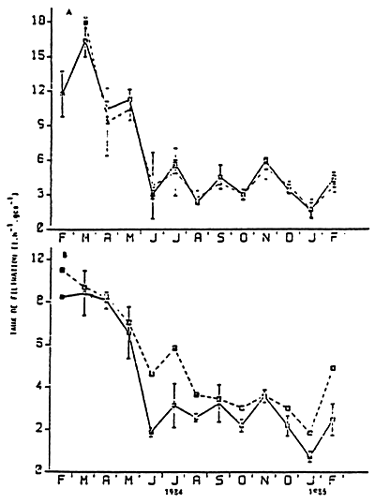 | Figure 21 : Monthly variations of the filtration rates for Mytilus edulis feed with natural food. Measured from | |
| A | (—) Coulter counter (---) chlorophyl and pheophitin | |
| B | (—) total seston (---) biodeposition (from Boromthanarat, 1986) | |
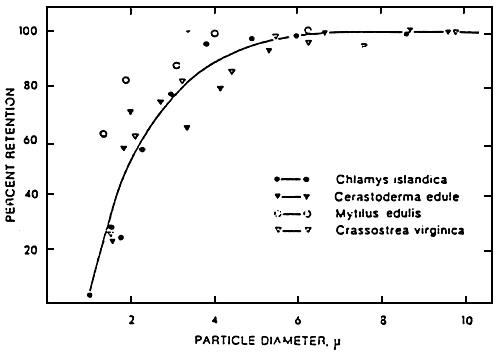
Figure 22: Graph showing the particle retention efficiency of a variety of bivalves as a fonction of particle size. Maximum efficiency of each species = 100 % (from vahl, 1973)
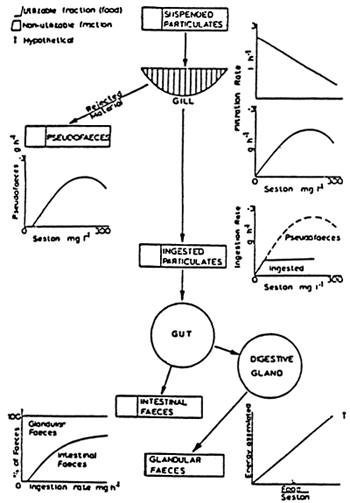 | Figure 23 : Mytilus edulis. Schematic diagram summarising effect of particle concentration on feeding and digestive system (from Widdows et al., 1979). |
| Figure 24: Seasonal evolution of biodeposit product by Crassostrea gigas (g/g dry flesh weight ) and of average seston (g/m3) (from Sornin et al., 1983). | 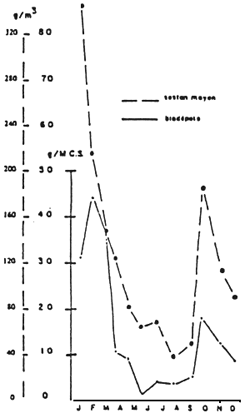 |
Table 7 : Efficiency of particle retention of Crassostrea gigas und or hight natural seston (20/2/84; 19/3/84; 14/5/84 ) and low natural seston (27/2/84; 27/3/84; 22/5/84) in relation with temperature.(.) : standard deviation. (Deslous-Paoli, 1985)
| Date | 20/2/84 | 27/2/84 | 19/3/84 | 27/3/84 | 14/5/84 | 22/5/84 | ||||||||
| rétention % | nb particules n 103 – n 1-1 | rétention % | nb particules n 103 – n 1-1 | rétention % | nb particules n 103 – n 1-1 | rétention % | nb particules n 10 3 – n 1-1 | rétention % | nb particules n 10 3 – n 1-1 | rétention % | nb particules n 103 – n 1-1 | |||
| 0.6–0.8 | 0 | - | 0 | 556 (20) | 0 | 291 (13) | 7.4 (1.8) | 029 (31) | 0 | 332 (30) | 0 | 745 (23) | ||
| 0.8–1.0 | 0 | - | 1.2 (6.7) | 207 (18) | 0 | 360 (8) | 6.7 (2.5) | 322 (41) | 0 | 387 (16) | 14.4 (7.5) | 343 (23) | ||
| 1.0–1.2 | 0 | 60 (3) | 7.4 (1.7) | 91 (8) | 0.9 (1.4) | 350 (5) | 6.5 (8.9) | 70 (11) | 0 | 358 (1) | 13.3 (12.5) | 123 (26) | ||
| 1.2–1.5 | 0 | 74.5 (2.6) | 6.4 (0.9) | 53 (4) | 0.3 (4) | 221 (7) | 8.3 (10.3) | 22 (3) | 8.6 (2.2) | 238 (9) | 24.2 (18) | 65 (11) | ||
| 1.5–1.9 | 1 (2) | 80 (1) | 16 (5.9) | 28 (3.3) | 13.6 (9.8) | 158 (7) | 15.3 (12.1) | 12 (1.5) | 20.3 (1.5) | 157 (5) | 29.2 (24) | 19 (2) | ||
| 1.9–2.4 | 16 (3) | 56 (1.6) | 22.5 (3.4) | 10 (2.4) | 19.5 (14) | 73 (5) | 26.4 (12.5) | 6 (0.7) | 31.2 (1.5) | 70 (4) | 37 (23) | 11 (1) | ||
| 2.4–3.1 | 29 (3) | 32 (1.6) | 37.4 (10) | 4.2 (0.8) | 26.8 (5.2) | 36 (1.4) | 41.6 (12) | 3 (0.3) | 39.1 (5.0) | 28 (2.5) | 49.6 (19) | 6 (0.7) | ||
| 3.1–3.9 | 39 (3) | 14 (1) | 62.9 (9.5) | 2.4 (0.3) | 39.2 (5.5) | 17 (1) | 41.3 (7.3) | 3 (0.3) | 50.1 (4.4) | 15 (1.2) | 65.3 (14) | 3 (0.3) | ||
| 3.9–4.9 | 50 (1) | 5.3 (0.4) | 53.3 (10) | 1.2 (0.1) | 51.7 (6.7) | 7 (0.5) | 48.7 (6.4) | 1.1 (0.2) | 60.7 (0.4) | 7 (0.4) | 76.1 (12) | 1.6 (0.1) | ||
| 4.9–6.1 | 65 (2) | 2 (0.2) | 62.1 (11.5) | 0.6 (0.1) | 62.3 (5.3) | 2.7 (0.2) | 58.5 (13.6) | 0.3 (0.1) | 70.4 (3.7) | 3 (0.1) | 84.9 (9.1) | 1.1 (0.1) | ||
| 6.1–7.7 | 76 (4) | 0.8 (0) | 64.6 (11.9) | 0.3 (0) | 71.8 (5.2) | 1 (0.1) | 64.8 (12.5) | 0.2 (0) | 79.9 (4.8) | 1.4 (0.1) | 89.5 (7.7) | 0.8 (0.1) | ||
| 7.7–9.7 | 78 (8) | 0.2 (0) | 64.1 (9.3) | 0.2 (0) | 78.9 (7.1) | 0.6 (0) | 72.2 (9.4) | 0.2 (0) | 85.7 (6.2) | 1.8 (0.2) | 82.4 (9.0) | 0.2 (0) | ||
| 9.7–12.3 | - | - | - | - | 74.4 (10.5) | 0.2 (0) | 66.3 (17.3) | 0.1 (0) | 53.2 (5.8) | 0.7 (0.1) | - | - | ||
| 12.3–13.5 | - | - | - | - | 67.6 (11.6) | 0.1 (0) | 51.2 (31.8) | 0.02 (0) | 81.6 (5.1) | 0.3 (0.1) | - | - | ||
| 13.5–19.5 | - | - | - | - | 69.1 (6.4) | 0.1 (0) | - | - | 78.9 (5.2) | 0.1 (0) | - | - | ||
| Seston mg1-1 | - | 10 | - | 4 | - | 7.56 | - | 2.93 | - | 8.16 | - | 2.07 | ||
| température °C | 0 °C | 5 °C | 11 °C | 10.5°C | 16 °C | 17 °C | ||||||||
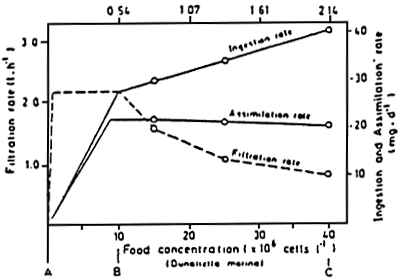 | Figure 25: Mytilus edulis. Concept of the
interrelationships existing
between filtration rate, assimilation
efficiency and food
concentration. (from Navarro and winter, 1982) |
Figure 26 : Aulocomya ater, Ingested
ration, assimilated retion
oxygen consumption and scope
for growth in 50 mm mussels,
expressed as functions of
food concentrations.
(from Griffiths and king,
1979) | 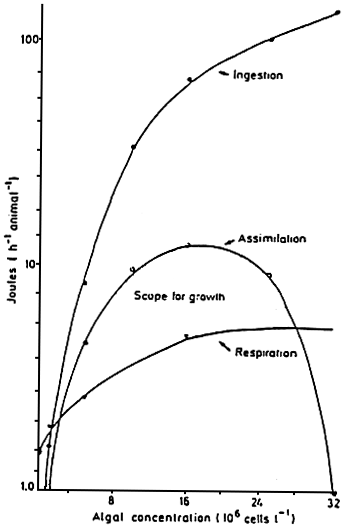 |
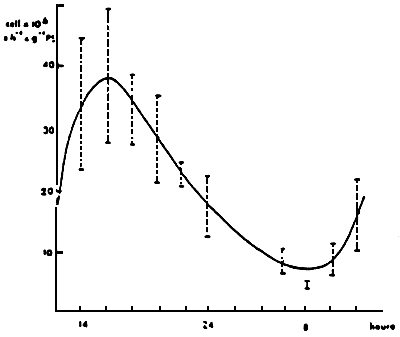 | Figure 27: Daily rhythm of the filtration
rate of Crassostrea gigas. (from Coppelo, 1982) |
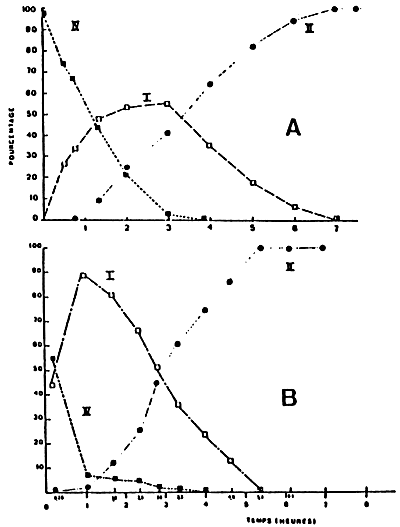 |  |
 | Figure 8a : Synthetic model of the ingestion and
digestion during discontinuous feeding
of larvae of Fecton maximus, (A) at 17°C.
(From Le Pennec and Rangel - Davalos, 1986) |
Figure 8b : Synthetic model of ingestion and digestion during
continuous feeding, (A) at 16°C, (B) at 18°C. |
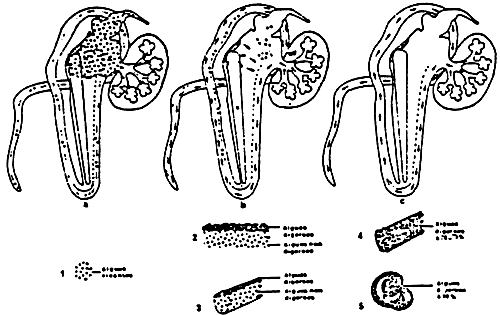
Figure 29 : Schematic representation of the digestive transit in Crassostrea gigas (for explanation see text). (from Boucaud-Camou et al., 1985)
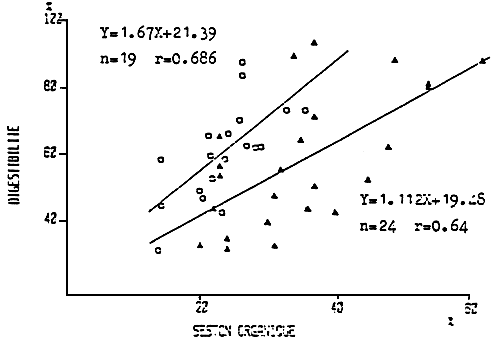
Figure 30 : Relation between the organic fraction of the food and digestibility for Perna perna (Berry and Schleyer, 1984) (○) and for Mytilus edulis (Boromthanarat, 1983) (▲).
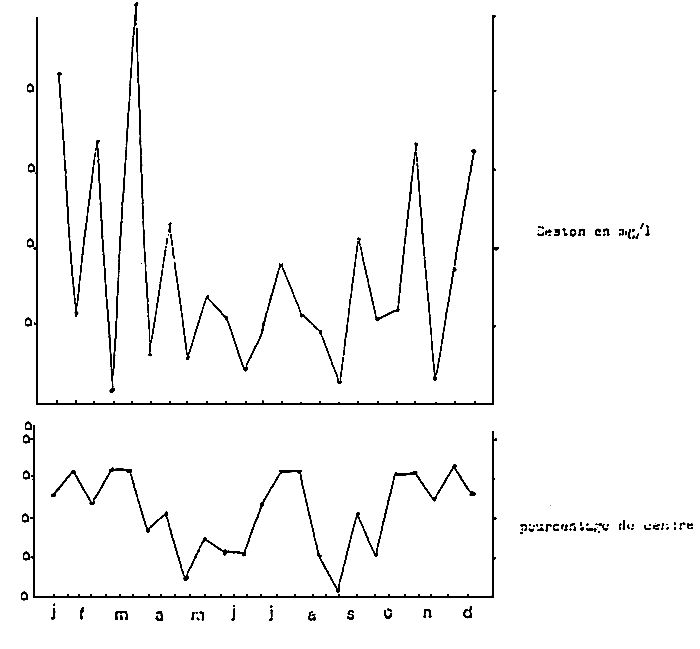
Figure 31 : Variation of the total seston and of its mineral fraction in the bay of Marennes-Oléron. (from Heral et al., 1980)
Tableau 8 : Evolution saisonniére des pourcentages digérés (Dc), des quantités of elements consommés et absorbés ainsi que du taux de filtration pour Mytilus edulis (A), Crassostrea gigas (B) et Crepidula fornicata (C).
| A | B | C | |||||||||||
| Periode | Juil. 1982 | Nov. 1982 | Févr. 1983 | Avril 1983 | juil. 1982 | Nov. 1982 | Févr. 1983 | Avril 1983 | Juil. 1982 | Nov. 1982 | fevr. 1983 | Avril 1983 | |
| D C % | Org | 49,0 | 34,3 | 31,3 | 20,6 | 54,7 | 38,4 | 1,2 | 23,0 | 37,6 | 33,2 | 23,5 | 12,0 |
| Prot | 40,5 | 41,9 | 75,3 | 11,8 | 43,0 | 17,2 | 62,7 | 15,8 | 38,8 | 0 | 74,4 | ||
| Lip | 88,3 | 93,5 | 18,4 | 19,6 | 90,9 | 88,9 | 100 | 32,7 | 100 | 100 | 100 | 100 | |
| Glu | 46,3 | 0 | 0 | 50,5 | 41,2 | 0 | 0 | 26,2 | 21,1 | 0 | 0 | 40,6 | |
| Chloro + phéo | 64,9 | 60,7 | 48,5 | 58,4 | 26,7 | 53,0 | 10,0 | 61,2 | 53,8 | 65,7 | 12,6 | 45,8 | |
| C O N S O M M E S | Org (mg) | 129,9 | 234 | 1572 | 813 | 162,3 | 451 | 543 | 1107 | 36,8 | 75,4 | 106,2 | 86,6 |
| Prot (mg) | 4,9 | 14,5 | 95,6 | 62,8 | 6,1 | 28,0 | 33,0 | 85,5 | 1,4 | 4,7 | 6,5 | 6,7 | |
| Lip (mg) | 2,5 | 6,4 | 12,9 | 14,0 | 3,1 | 12,4 | 4,5 | 19,1 | 0,7 | 2,1 | 0,9 | 1,5 | |
| Gluc (mg) | 10,5 | 10,6 | 59,7 | 64,6 | 13,2 | 20,5 | 20,6 | 87,9 | 3,0 | 3,4 | 4,0 | 6,9 | |
| Chloro + pheo (ug) | 255 | 133 | 760 | 678 | 319 | 257 | 263 | 923 | 72 | 43 | 51 | 72 | |
| A B S O R B E S | Org (mg) | 63,7 | 80,5 | 492 | 168 | 88,8 | 173 | 6,5 | 255 | 13,8 | 25,0 | 25,0 | 10,4 |
| Prot (mg) | - | 5,9 | 40,1 | 47,3 | 0,72 | 12,0 | 5,7 | 53,6 | 0,2 | 1,8 | 0 | 5,0 | |
| Lip (mg) | 2,2 | 6,0 | 2,4 | 2,8 | 2,8 | 11,0 | 4,5 | 6,2 | 0,7 | 2,1 | 0,9 | 1,5 | |
| Gluc (mg) | 4,9 | 0 | 0 | 32,6 | 5,4 | 0 | 0 | 23,0 | 0,6 | 0 | 0 | 2,8 | |
| Chloro + Phéo (ug) | 166 | 81 | 369 | 396 | 85 | 136 | 27 | 564 | 39 | 28 | 6,5 | 33 | |
| Energie (EPLG) (JOULES) | 169 | 376 | 1042 | 1787 | 220 | 719 | 311 | 1910 | 44 | 125 | 34 | 225 | |
| Temps (h) immersion | 14 | 16,5 | 18,5 | 18,5 | 14 | 16,5 | 18,5 | 18,5 | 14 | 16,5 | 18,5 | 18,5 | |
| Taux de Filtration 1/h/gCs | 2,03 | 2,63 | 1,75 | 5,52 | 53 | 5,07 | 0,6 | 7,52 | 0,57 | 0,85 | 0,12 | 0,59 | |
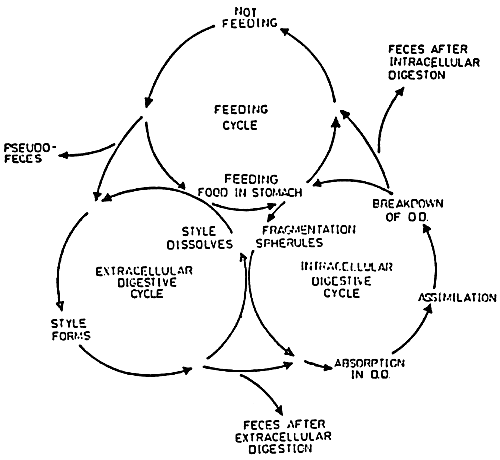
Figure 32 : The coordinated cycles of feeding and extra-and intracellular digestion of the bivalve. (from Morton, 1973)
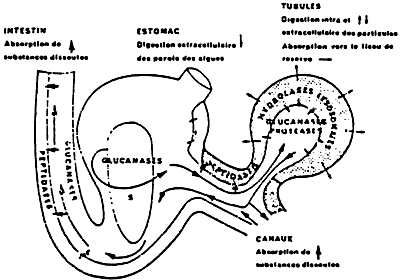
Figure 33: Schematic representation of the digestion for Crassostrea gigas. (from Boucaud-Camou et al., 1986).
← Passage of the food
 transmembranous absorption
↑ absorption by pinocytose
↓ secretion of digestive enzymes
s : cristalin style
ALI S.M., PRUDER G.D., 1983. Effects inorganic particles on the growth of eastern oyster Crassostrea virginica (Gmelin). J. Shellf. Res. 3 (1): 80 – 81
AMOUROUX J.M., 1982. Ethiologie, filtration, nutrition; bilan énergetique de Venus verrucosa. Linné (Bivalves). Thèse Doctorat d'Etat, Univ. p. et m. Curie, PARIS: 132 PP.
ANONYME, 1986. Bilans énergétiques chez les mollusques bivolves: Terminologie et méthodologie. Vie marine; sous presse.
ARNOULT C., BOUCHEZ-DECLOUX N.J., 1978. Histochemical methods for the localization of cellulase, chitinase and leminarinase. Application to the gastric shield of the bivalve mollusc Scrobicularia plana. Histchem., 56 (1): 45 – 54.
BAMFORD D.R., GINGLES D., 1974. Absorption of sugars in the gill of the Japanese oyster, Crassostrea gigas. Com. Biochem. Physiol., 49: 637 – 646.
BAYNE B.L., 1965. Growth and delay of metamorphosis of the larvae of Mytilus edulis(L). Ophelia, 2: 1 – 47.
BAYNE B.L., 1971. Some morphological changes that occur at the metamorphosis of the larvae of Mytilus edulis. 4éme EMBS, Crisp j. ed., Cambridge Univ. Press, LONDON : 259 – 280.
BAYNE B.L.(ed.) 1976. Marine mussels: their ecology and physiology, Cambridge Univ. Press: 506 pp.
BAYNE B.L., NEWELL R.C., 1983. Physiological energetics of marine molluscs. In “The mollusca”, Wiburg K.M., Saleuddin A.S.M. eds., Academic Press. LONDON, 4 (1): 407 – 515.
BERNARD F.R., 1974. Particle sorting and labial palp function in the pacific oyster Crassostrea gigas (Thunberg,1795). Bul., 146 (1): 1 – 10.
BERRY B.F., SCHLEYER M.M., 1983. The brown mussel Perna perna on the Natal coast. South Africe: Utilization of available food and energy budget. Mar. Ecol. Prog. Ser., 6, 13: 201 – 210.
BODOY A., PLANTE-CUNNY M.R., 1984. Relations entre l'évolution saisonnière des populations de palourdes (Ruditapes decussatus)et celles des microphytes benthiques et planctoniques (Golfe de FOS, France)Haliotis, 14: 71 – 78.
BOROMTHANARAT W., 1986. Ecophysiologie de Mytilus edulis L. dans le bassin de Marennes–Oléron: alimentation et bilan d'énergie. Thèse de spécialité, Univ. NANTES: 92 pp.
BOUCAD–CAMOU E., LEBESNERAIS C., LUBET P., 1985. Dynamique et enzymologie de la digestion chez l'huître Crassostrea gigas (Thunberg). Bases biologiques de l'aquaculture, MONTPELLIER, 1983. Actes do colloques du CNEXO, 1 : 75–96.
BRICELJ V. M., MALOUF R.E., 1984. Influence of algal and suspended sediment concentrations on the feeding physiology of the hard clam Mercenaria mercenaria Mar. Biol., 84: 155–165.
CASTELL J.D., TRIDER D.J., 1974. preliminary feeding trials using artificial diets to study the nutrional requirements of oysters (Crassostrea virginica J. Fish. Res. Bd. Can., 31: 95 – 99)
CHEW K.K.,, DONALDSON J.D. 1985. Bivalve mollusc hatchery techniques, maturation and triggeing of spawning. Internet. Seminar Shellf. Cult. Manag., LA ROCHELLE, mars 1985. IFREMER, Actes de colloque: sous presse.
CHRETIENNOT-DINET M.J., ROBERT R., HIS E., 1986. Utilisation des “algues fourrage” en aquaculture. Année biologique, 25(2): 97–119
COLLIER A., RAY S.M., MAGNITZKY A.W., BELL J.O., 1953. Effect of dissolved organic substances on oysters. Fish. Bull., 84–59: 167–183.
COPPELO M., 1982. Données écophysiologiques sur un organisme filtreur benthique des étangs littoraux méditerranéens: Crassostres gigas. Rapport DEA, Univ. PARIS VI: 35pp.
CRISP D. J., 1971. Energy flow measurements. In “Methods for the study of marine benthos”, Holme N.A., Mc Intyre A.D. eds, Blackwell Sc. publ., oxford: 197–323.
DARDIGNAC M.J., 1986. La mytiliculture traditional le. In Aquaculture, vol. l, Technique et document. Lavoiser ed, 283–343
DAVIS H.C., 1953. On food and feeding of the larvae of the american oyster, Crassostrea virginica. Biol. Bull., 104: 334–350.
DESLOUS-PAOLI J.M., 1985. Assessment of energetic requirements of reared molluscs and of their main competitors. Internat. Seminar Shellf. Cult. Develop. manag., LA ROCHELLE, mars 1985. IFREMER, Actes de colloques: sous presse
DESLOUS-PAOLI J. M., HERAL M., 1984. Transfarts énergétiques entre l'huîture Crassostrea gigas de 1 an et la nourriture potential disponible dans l'eau d'un bass in ostréicole. Haliotis, 14: 79–90
DESLOUS-PAOLI J.M., HERAL M., ZANETTE Y., 1982. Problèmes posés par l'analyse des relations trophiques huître-milieu. GABIM, Indicates biochimiques des milieux marins. Actes et colloques du CNEXO, 14: 335–340.
DESLOUS-PAOLI J.M., SORNIN J.M., HERAL M., 1986. Biodéposition et digestibilité des aliments in situ pour trios mollusques estuariens (Mytilus edulis, Crassostrea gigas, Crepidula fornicata) Symposium de la SFM, septembre 1986. Haliotis: sous presse.
DRAL A.D.G. 1967. The movements of the latero-frontal cilia and the mechanism of particle retention in the mussel (Mytilus edulis l.). Noth. j. Sea Res., 3(3): 391–422.
EWARD J.W., CARRIKER M.R., 1983. Characteristics of feacal ribbons from juveniles of Crassostrea virginica (Gmelin) fed Phaeodactylum tricornutum (Bohlin) with and with out the addition of slit. Preliminary observations. J. Shell fish Res., 3(1): 90–91.
FANKBONER P.V., DE BURCH M.E., 1978. Comparative rates of dissolved organic carbon accumulation by juveniles and pediveligers of the Japanese oyster Crassostrea gigas. Thunberg. Aquaculture, 13: 205–212.
FEUILLET M., HERAL M., RAZET D., GUERGUIN F., ABRIOUX M., 1979. Les substances dissoutes dans les eaux du bassin in da Marennes-Oléron et dans les eaux interstitielles de ses parcs conchylicoles. Note au CIEM, C. M. 1979/K: 17: 11 pp.
GOMME J., 1982. Laminar water flow, amino-acid absorption and amino acid recycling in the mussel gill. Ann. Zool., 22: 898–899.
GOREAU T.F., GOREAU N. I., YONGE C. M., 1973. On the utilization of Photosynthetic products from zooxanthellae and a dissolved amino-acid in Tridacna maxima f; elongata (Mollusca: Bivalvia). J. zool., Lond., 169: 417–454
GRIFFITHS C.L., KING J., 1979. Some relationships between size, food availability and energy balance in the ribbed mussel Aulacomya ater. Mar. Biol., 51: 141–149.
GRODZINSKI W., KLEKOWSKI., DUNCAN A. (ed.), 1975. Methods for ecological bioenergetics. Blackwell Sc.Publi., Oxford, IBP Handbook, 24: 1–367.
HARRISON C., 1976. The essential amino-acids of Mytilus californianus. Veliger, 18: 189–193.
HELM M.H., HOLLAND D.L., STEPHENSION R.R., 1973. The effect of supplementary algal feeding of a hatchery breeding stock of Ostrea edulis L., on larval viguor. J. Mar. Biol. Ass. U.K. 53: 673–684.
HENRY M., 1984a. Ultrastructure des tubules digestifs d'un mollusque bivalve marin, la palourde Ruditapes decussates L., en métabolisme de routine. 1–La cellule digestive. Vie marine, 6: 7–15.
HENRY M., 1984b. Ultrastructure des tubules digestifs d'un mollusque bivalve marin, la palourde Ruditapes decussatus L., en métabolise de routine. II–La cellule sécrétrice. Vie marine, 6: 17–24.
HERAL M., 1977. Etudes préliminaries des potentialités nutrivities dans le bassin de Marennes-Oléron. Océanoexpo, BORDEAUX: 14 pp.
HERAL M., 1985. Evaluation of the carrying capacity of the molluscan shellfish ecosytems. Internet. Seminar Shellf. Cult. Develop. Manag., LA ROCHELLE mars 1985. IFREMER, Actes de colloque: sous presse.
HERAL M., DESLOUS-PAOLI J.M., PROU J., 1986 b. Analyse historique de la production conchylicole du bassin de Marennes-Oléron (France). 4éme colloque Sc. Interides. Franco-japonais Oceanogr., september 1985, MARSEILLE: sous presse.
HERAL M., DESLOUS-PAOLI J. M., SORNIN J. M., 1983. Transferts énergétiques entre I'huîture Crassostrea gigas et la nourriture potentielle disponible dans us bass in ostréicole: Première approche. Oceanis, 9(3): 169–194
HERAL M., DESLOUS-PAOLI J.M., RAZET D., PROU J., 1984. Essai de mise en évidence in situ de parameters biotiques et abiotiques de I'eau et de l'interface eau-sediment intervenant dans la production de I'huîture Crassostrea gigas. Oceanis, 10(4): 465–475.
HERAL M., PROU J., DESLOUS-PAOLI J., 1985a. Influence des facteurs climatiques sur la production conchylicole du bassin de Marennes-Oleron. Haliotes: sous presse.
HERAL M., RAZET D., MAESTRINI S., GARNIER J., 1980. Composition de la matière organique particulaire dans les eaux du bassin Marennes-Oleron. Apport energetic pour la nutrition de I'huîture. Note au CIEM, C. M. 1988/L: 44: 14pp.
HIGGINS P.J., 1980. Effects of food availability on the valve movements and feeding behaviour of juvenile Crassostrea virginica (Gmelin). l. Valve movements. and periodic activity. J.exp. mar. Biol. Ecol., 45: 229–244.
HILY A., 1985. Etude histoenzymologique de la digestion chez Ruditapes philippinarum Bases biologiques de l' aquaculture, MONTPELLIER 1985. IFREMER, Actes de colloque, 1: 97–108.
HOLME N.A., Mc INTYRE A.D., 1984. Methods for the study of marine benthos. Black-Well Sc. publ., Oxford, IBP handbook, 16: 1–387.
JORGENSEN C.B., 1975. On gill function in the mussel Mytilus edulis Ophelia, 13: 187–232.
JORGENSEN C. B., 1982. A Kinetic and autoradiographic study of the direct assimila tion of amino-acid from natural sea-water in the mussel Mytilus edulis. Ophelia, 21: 215–221.
JORGENSEN C.B., 1982. Uptake of dissolved amino-acids from natural sea-water in the mussel Mytilus edulis. Ophelia 21–215–221.
JORGENSEN C.B., 1983. Patterns of uptake of dissolved amino-acids in mussels Mytilus edulis. Mar. Biol., 73: 177–182.
KAUTSKI N., 1982. Growth and size structure in a Baltic Mytilus edulis populaton. Mar. Biol., 68: 117–133.
KIORBOE T., MOHLENBERG F., NOHR O., 1981. Effect of suspended bottom material on growth and energetics in Mytilus edulis. Mar. Biol., 61: 283–288
LAING I., MILLICAN P. F., 1986. Relative growth and growth efficiency of Ostrea edulis L. spat fed various algal diets. Aquaculture, 54: 245–262.
LANGTON R.W., 1975. Synchrony in the digestive diverticula of Mytilus edulis L. J. Mar. Biol. Ass U. K., 55: 221–229.
LANGTON C.J., BOLTON E.T., 1984. A microparticulate diet for a suspention-feeding bivalve mollusc, Crassostrea virginica (Gmelin). J. exp. mar. Biol. Ecol., 82: 239–258.
LANGTON R. W., GABBOT P. A., 1974. The tidal rythm of extracellular digestion and the response to feeding in Ostrea edulis L., Mar. Biol. (BERLIN), 24 181–187.
LEBESNERAIS C., 1985. Etude expérimentale de la digestion chez l'huîture Japonaise Crassostrea gigas (Thunburg). These de 32me cycle. Univ. de CAEN: 102 pp + annexes.
LELONG P., RIVA A., 1976. Relations entre croissance de bivalves et phytoplancton en langune et bassin fermé. Haliotis, 7: 104–109.
LE PENNEC M., RANGEL-DAVALOS C., 1985. Observations microscopie àepifluorescence de l'ingestion et de la digestion d'algues unicellular chez des jeunes larves de Pecten maximus (Pectindae, Bivalvia). Aquaculture, 47: 39–51.
LOOSANOFF V.L., NOMEJKO C.A., 1946. Feeding of oysters in relation to tidal changes and periods of light and darkness. Biol. Bull. (woods hole), 90: 244–264
LOPEZ G.R., CHENG I.J., 1983. Synoptic measurements of ingestion rate, ingestion selectivity and absorption efficiency of natural foods in the deposit-feeding molluscs Nucula annulata (Bivalvia) and Hydrobia totteni (Gastropoda). Mar. Ecol. Prog. Ser., 11: 55–62
LUBET P.E., 1978. Nutrition des lamellibranches (huîtres-moules). Oceanis, 4(1): 23–54
LUCAS A., 1981. Le rôle du naissain d'écloserie dans la culture des bivalves en 1980. La pêche maritime, Mai 1981: 294–297
LUCAS A., 1982a. Remarques sur les rendements de production chez les bivalves marins. Haliotis, 12: 47–60
LUCAS A., 1982b. La nutrition des larves de bivalves. Oceanis, 8(5): 363–388
LUCAS A., RANGEL-DAVALOS C., 1981. Vitesses d'ingestion du phytoplancton observées au microscope à épifluorescence chez les larves de Mytilus edulis (L) (Bivalvia, Mollusca ). Haliotes, 11: 171–180
MARTIN J.L., 1976. Importance des bactéries chez les mollusques bivalves. Haliotis 7: 97–103
MASSON M., 1975. Etude expérimentale de la croissance et de la nutrition de la larve de Mytilus galloprovincialis (Lmk), mollusce pélécypode. Thèse 3ème cycle-Univ. de CAEN: 125 pp.
MATHERS N.F., 1976. The effects of tidal currents on the rythem of feeding and diges tion in Pecten maximus L. J. exp. Mar. biol. Ecol. 24: 271–283
MENGUS B., 1978. Rôle des bactéries dans l'alimentation des larves de mollusques bivalves marins en élevages expérimentaux. Thèse 3ème cycle, Univ. AIX - MARSEILLE II, Bull. Observatoire mer, 3: 156 pp.
Mc. QUISTON R.W., 1969. Cyclic activity in the digestive diverticula of Lasea rubra (Montagu) (Bivalvia: Eulamellibranchia). Proc. Malac. Soc. LONDON, 38: 483–492.
MOHLENBERG F., RIISGARD H.U., 1978. Efficiency of particle retention in 13 species of suspension feeding bivalves. Ophelia, 17(2): 239–246
MORTON J.E. 1956. The tidal rythm and action of the digestive system of the lamellibranch, Lasea rubra. J. Mar. Biol. Ass. U.K., 35: 563–586
MORTON B.S 1970. The tidal rythm and rythm of feeding and digestion in Cardmium edule. J. Mar. Biol. Ass. U. K., 50: 499–512
MORTON B. S., 1971. The diurnal rythm and tidal rythm of feeding and digestion in Ostrea edulis. Biol. J. Limn. Soc., 3: 329–342
MORTON B. S., 1973. A new theory of feeding and digestion in the filter feeding lamel libranchia. Malacologia, 14: 63–70.
MORTON B. S., 1977. The tidal rythm of feeding and digestion in the Pacific oyster Crassostrea gigas (Thunberg, 1793). J. Exp. Mar. Biol. Ecol., 26: 135–151
MORTON B. S., 1983. Feeding and digestion in bivalvia.In “The mollusca”, Wilburg K. M., Saleuddin A.S.M. eds. Academic Press LONDON, 5(2): 65–147
NAVARRO J.M., WINTER J.E., 1982. Ingestion rate, assimilation efficiency and energy balance in Mytilus chilensis in relation to body size and different algal concentrations. Mar. Biol., 67: 255–266
NELL J.A., SKELL M.E., DUNKLY P., Uptake of some dissolved organic nutrients by the Sydney rock oyster Saccostrea commercials. Mar. Biol., 74: 313–318.
NELL J.A., WISSELY B., Experimental feeding of Sydney rock oysters (Saccostrea commercialis) 11-Protein supplementation of artificial diets for adult oysters. Aquaculture, 32: 1–9
NEWELL R.J.E., JORDAN S.J., 1983. Preferential ingestion of organic material by the American oyster Crassostrea virginica. Mar. Ecol. Prog. Ser., 13: 47–53
NORTH B.B., 1975. Primary amines in California coastal waters: Utilisation by phytoplancton. Limol. Oceanogr., 20: 20–27
OWEN G., 1955. Observations on the stomach digestive diverticula of the lamellibranchia. Qaterly J. Microsc. Sci., 96(4): 517–537
OWEN G., 1966. Feeding. In“ Physiology of Mollusca”, Wilbur K.M., Yonge C.M. ed., Academic Press, New-York, 2: 1–51
OWEN G., 1974. Feeding and digestion in the bivalvia. In“Advances in comparative physiology and biochemistry”, Lowenstein O. ed., Academic Press, 5: 1–35
PALMER R.E., 1980a. Intracellular digestion and its relation to feeding history in the oyster Crassostrea virginica. Biol. Bull. Woods hole, 45: 273–295
PALMER R.E., 1980b. Behavioural and rythmic aspects of filtration in the bay scallop Argopecten irradians concentricus (Bay) and the oyster Crassostrea virginica (Gmelin). J. exp. mar. Biol. Ecol., 45: 273–293. 6
PANDIAN T.J., 1975. Mechanism of heterotrophy. In “Marine Ecology”, KINNE O. ed., 2(1): 61–241
PEQUIGNAT E., 1973. A Kinetic and autoradiographic study of the direct assimilation of amino-acids and glucose by organs of the muscles Mytilus edulis. Mar. Biol., 19: 227–244
PHLEGER C.F., ROSSI S.S., 1982. Dissolved organic matter accumulation by juveniles of the purple-hinge rock scallop, Hinnites multirugosus Gale. Comp. Biochem. Physiol., A 71: 453–456.
PRIEUR D., 1981. Nouvelles données sur les relations entre bactéries et bivalves marins. Haliotis, 11: 251–260.
PURCHON R. D., 1977. The biology of the mollusca. Kerkut G.A. ed., Pergamon Press, 57(2ème ed.): 560 pp.
RICKER W.E. (ed.), 1968. Methods for the assessment of fish production in freshwater. Blackwell Sc. Publ., Oxford, IBP Handbook 3.
RIISGARD H.U., RANDLOV A., KRISTENSEN P.S., 1980. Rates of water processing, oxygen consumption and efficiency of particle retention in veligers and young post-metamorphic Mytilus edulis. Ophelia, 19: 37–47.
ROBINSON W.E., LANGTON R.W., 1980. Digestion in a substidal population of Mercenaria mercenaria (Bivalvia). Mar. Biol. (BERLIN), 58: 173–179.
SALANKY J.C., 1966. Daily activity rythm of two Mediterranean lamellibranchia. Ann. Inst. Boil. Tihani, 33: 135 -142.
SORNIN J.M., FEUILLET M., HERAL M., DESLOUS-PAOLI J.M., 1983. Effect des biodépots de l'huître Crassostrea gigas (Thunberg) sur l'accumalaton des matières organiques dans les parcs du bassin de Marennes-Oléron. Proc. 2nd. Franco-British Symposium, septembre 1982–LONDON. J. Moll. Stud., Suppt 12A: 185–197.
SPRUNG M., 1984a.Physiological energetics of mussel larvae Mytilus edulis. II - Food uptake. Mar. Ecol. Prog. Ser., 17: 295–305.
SPRUNG M., 1984b. Physiological energetics of mussel larvae Mytilus edulis. IV - Efficiencies. Mar. Ecol. Prog. Ser., 18: 179–186.
STEWARD M.G., BAMFORD D.R., 1976. The effect of environmental factors on the absortion of amino-acids by isolated gill tissue of the bivalve, Myarenaria (L). J. exp. mar. Biol. Ecol., 24: 205–212.
THOMPSON R.J., BAYNE B.L., 1972. Active metabolism associated with feeding in the mussel Mytilus edulis L.. j. exp. mar. Biol. Ecol., 9: 111–124.
TRIDER D.J., CASTELL J.D., 1980. Effect of dietary lipids on growth, tissue composition and metabolism of the oyster (Crassostrea virginica). J.Nutr., 110: 1303–1309.
UKELES R., SWEENY B., 1969. Influence of dinoflagellate trichocystis and other face feeding c Crassostrea virginica larvae on Monochrysis lutheri. Limnol. Oceanogr., 14(3): 403 – 410.
URBAN R., LANGTON C.J., 1984. Reduction in costs of diets for the American oyaster Crassostrea virginica (Gmelin), by use of non algal supplements. Aquaculture, 38: 277–291.
VAHL O., 1980. Seasonal variations in seston and in the growth rate of lceland scallop, Chlamys islandica (O.F. Muller) from Bulsfjord 70° N.J. exp. mar. Biol. Ecol., 48: 195–204
WIDDOWS J., FIETH P., WORRAL C.M., 1979. Relationship between seston, available food and feeding activity in the common mussel Mytilus edulis. Mar. Biol., 50: 195–207
WIDDOWS J., 1978. Combined effect of body size, food concentration and season on the physiology of Mytilus edulis. J. Mar. Biol. Ass. U.K., 58: 109–124
WILDISH D.J., KRISTMANSON D.D., PEER D., Effect of tidal currents on suspension-feeding benthos in the bay of Fundy. ICES, C.M. 1981/L: 33: 7pp.
WILSON J.H., 1979. Observations on the grazing of Ostrea edulis L. larvae when fed on algal culture of different ages. J. exp. mar. Biol. Ecol., 38(2) 187–199
WILSON J.H., LA TOUCHE R.W.,Intracellular digestion in two sublittoral populations of Ostrea edulis (lamellibranchia). Mar. Biol. (BERLIN), 47: 71–77
WINBERG G.G. 1956. Rate of Metabolism and food requirements of fishes. fish. Res. Board. can., Trans. Ser. : 194–1960.
WINTER J. E., 1978. The filtration rate of Mytilus edulis and its dependance on algal concentration measured by a continuous automatic recording apparatus. Mar. Biol., 22: 317–328.
WRIGHT S. H. 1982. A nutritional role for amino-acid transport in filter feeding invertebrates. Amer. Zool., 22: 621–634.
WRIGHT S.H., STEPHENS G.C., 1982. Transepidermal transport of amino-acids in the nutrition of marine J., Ernst W.G.eds.
ZURBURG W., De ZWAAN A.,, 1981. The role of amino-acids in anarobiosis and osmoregulation in bivalves. J. Exp. Zool., 215: 315–325.