![]()
![]()
![]()
SECTION 6
In the previous chapters it was shown that sequential acquisition systems acquire information pixel by pixel, i.e. the smallest area discriminated by the sensor. For example, the Thematic Mapper of LANDSAT discriminates areas as small as 30 m × 30 m. The recorded scene is restored in the form of a grid of pixels. The radiance from each of the pixels is recorded by the detector (s) and then digitized to allow computer manipulation. The radiances that are measured in remote sensing can take any value between 0 and a maximum of Rmax. The value is dependent on the wavelengths being sensed and the characteristics of the sensor.
The digitization process transforms continuous analog data into discrete digital data, i.e. a finite number of integer values is used to represent all the values of the original continuous data. The larger the number of integer values (N) used for digitization, the better the digital data conforms to the original analog data. Due to the configuration of computers, the number N is always a power of 2: (N=2n). The value of n ranges from 6 to 32 (depending on the sensor) and is defined as the “bit”. For example, if the digitization process is carried out with 256 values (or levels), the data is encoded in 8 bits (256 = 28).
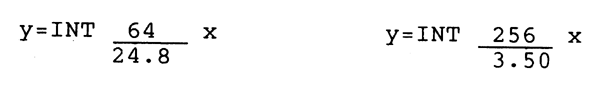
Before the digitization process can proceed, the operator must decide, on the basis of sensor hardware and programming software available, how to assign the infinite number of radiances to the finite number of digital levels available. For example, the zero radiance, R0, may be given the digital value 0, and the maximum radiance, Rmax, the digital value 2n = N. Any radiance value x will therefore correspond to a digital value Y:

Example: n = 8 bits, therefore 2n = 256
Rmax = 20mW · cm-2 · sr-1. m-1 · R0=0
mW = milliwatts
sr = steradian, the unit of measurement for solid angles
The larger the value of Rmax - R0, the greater the range of x values corresponding to the scene y values, resulting in less detailed digitization. The range Rmax - R0 can be reduced to a range Rsup - Rinf of “interesting” values by using a sensor dedicated to a particular mission or target. In the visible part of the spectrum, the water-leaving radiance is very low compared with the land-leaving radiance. A sensor dedicated to water studies typically reduces the digitization range between 0 and Rsup, which is less than Rmax. Any value greater than Rsup is assigned to the value 2n, thus Rsup is the “saturation value” of the sensor. By this method, the radiances of real interest are imaged with more detail, i.e. more digital values are available to represent them. For example, the values of Rsup for LANDSAT MSS and NIMBUS-7 CZCS are given below:
| i) | Maximum radiance at saturation of MSS (gain=1): | ||
| BAND 4: | Rsup = 24.8 mW · cm-2 · sr-1 · μm-1; | λ=550 nm | |
| BAND 5: | Rsup = 20.0 mW · cm-2 · sr-1 · μm-1; | λ=650 nm | |
| BAND 6: | Rsup = 17.6 mW · cm-2 · sr-1 · μm-1; | λ=750 nm | |
| BAND 7: | Rsup = 46.0 mW · cm-2 · sr-1 · μm-1; | λ=950 nm | |
| ii) | Maximum radiance at saturation of CZCS (gain=1): | ||
| BAND 1: | Rsup = 11.46 mW · cm-2 · sr-1 · μm-1; | λ=443 nm | |
| BAND 2: | Rsup = 7.64 mW · cm-2 · sr-1 · μm-1; | λ=520 nm | |
| BAND 3: | Rsup = 6.21 mW · cm-2 · sr-1 · μm-1; | λ=550 nm | |
| BAND 4: | Rsup = 2.88 mW · cm-2 · sr-1 · μm-1; | λ=670 nm | |
| BAND 5: | Rsup = 23.90 mW · cm-2 · sr-1 · μm-1; | λ=750 nm | |
| iii) | Maximum radiance at saturation of CZCS (gain=4): | ||
| BAND 1: | Rsup = 5.41 mW · cm-2 · sr-1 · μm-1; | λ=443 nm | |
| BAND 2: | Rsup = 3.50 mW · cm-2 · sr-1 · μm-1; | λ=520 nm | |
| BAND 3: | Rsup = 2.86 mW · cm-2 · sr-1 · μm-1; | λ=550 nm | |
| BAND 4: | Rsup = 1.34 mW · cm-2 · sr-1 · μm-1; | λ=670 nm | |
| BAND 5: | Rsup = 23.90 mW · cm-2 · sr-1 · μm-1; | λ=750 nm | |
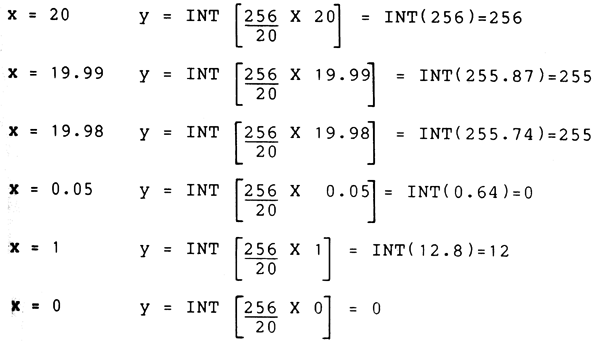
Since it is known that CZCS is 8 bit-digitized (onboard) compared to 6 bits for MSS, the digitization of the green band of each sensor for low (water-leaving) radiances may be compared as follows:
|
MSS (gain=1) |
CZCS (gain=4) |
||
|
|
|||
| x=0.01 | y=0 | x=0.01 | y=0 |
| x=0.05 | y=0 | x=0.05 | y=3 |
| x=0.1 | y=0 | x=0.01 | y=7 |
| x=0.2 | y=0 | x=0.2 | y=14 |
| x=0.3 | y=0 | x=0.3 | y=21 |
| x=0.4 | y=1 | x=0.4 | y=23 |
It is apparent, therefore, that more brightness differentiation is allowed by the CZCS (24 digital levels for a radiance range of 0.4) than by the MSS (2 digital levels for the same range of radiance). On the other hand, CZCS (band 2, gain 4) will not discriminate pixels having a radiance in excess of 3.50 whereas MSS (band 4, gain 1) allows the discrimination of radiances up to 24.8.
At this stage the data has been recorded, digitized and stored on magnetic tape in the form of a grid of pixels, each pixel being assigned an integer value from 0 to 2n. If the data has been acquired with an imaging system it may berestored as an image on a monitor.
The magnetic tape is read by a computer which can, for display purposes, assign to each integer value (or range of values as discussed in Section 6.2.3.5 - Density slicing) a particular character or a particular colour, so each value may be visually distinguished. Encoding by characters was common in the past but is now obsolete. Different methods may be used to encode the data:
i) rainbow encoding: each digital value is assigned to a different colour arbitrarily chosen,
e.g., 0=red, 1=blue … 255=yellow;
ii) grey scale encoding : each value is assigned to a grey level, generally in an ascending order,
e.g., 0=black, 1=dark grey … 254=light grey,
iii) colour scale encoding: each value is assigned to a single colour level, generally in an ascending order,
e.g., 0=dark red … 255=light red.
Colour scale encoding is used when it is necessary to display more than one image at the same time. In this case each image is encoded in a particular colour (e.g., red, green, blue) and thefinal image is a colour composite of the original images. The original images may be the same scene acquired at different wavelengths (multispectral analysis) or at different periods in time (multi-temporal analysis).
After digitizationthe data is appropriately formatted for computer manipulation and analysis. The data may now be transformed by any chosen mathematical function. Each image processing system has its own particular software, i.e. its own package of programs, each performing a different task. The sequence of tasks applied to an image is referred to as “image processing ”, which may be varied depending on the goals being sought. The following sequence gives a step-by-step example of currently used image processing techniques.
Target radiance is altered (attenuated) by the atmosphere through which the radiance passes on its way to the sensor. The sensor itself further distorts this radiance that has reached it.
Correction for atmospheric attenuation is especially important for dark targets such as water bodies. With relatively clear, deep and, therefore, dark water targets, together with somewhat hazy atmospheric conditions, the total radiance reaching the sensor may be composed of only 20% water-leaving radiance and 80% atmospheric path radiance. Although this is an extreme case, useful signals over water targets tend to be overwhelmed by atmosphere-generated noise.
A subjective evaluation of a single image does not require atmospheric correction. When, however, the objective is to extract quantitative information (e.g., chlorophyll concentration, bathymetric depth, etc.) or to compare two images in tonal values, atmospheric effects must be removed.
There are a variety of techniques used for atmospheric correction: the simplest techniques include “dark pixel subtraction” and “histogram matching” which are more prone to error. The more complex involve the mathematical modellingof the atmospheric condition at the time and place of the image, which often requires information taken at the site of the image and at the time of imaging.
Correction of sensor noise is of two types: relative and absolute. Once again, absolute calibration is needed only if quantitative or multi- image analysis is to be performed. Ancillary information sent down by the satellite is used to perform absolute calibration. This is often carried out at the stage of processing when the computer compatible tape (CCT) is created.
Relative correction for sensor “banding” isgenerally performed when the CCT is produced for the user. The “banding” phenomenon occurs because a single channel in a sensor actually contains a number of detectors. In a mirror-scanning system such as the LANDSAT MSS, there are six detectors per channel while in a push-broom system such as the SPOT HRV, there are thousands. During sensor construction, the detectors are matched in terms of sensitivity as much as possible. Detector sensitivity will slowly change with time, making one detector more (or less) sensitive to radiance than its neighbour. The apparent result is that the same target will be depicted as different brightnesses by detectors with different sensitivities. Again, ancillary sensor data is used in the pre-processing (on ground) stage to correct this image defect.
Geometric distortion is produced by the curvature of the earth, the non-uniformity of scanner motion, the non-linearity of the scanner mirror and the rotational movement of the satellite.
The correction of these geometric distortions can be accomplished in two ways:
| i) | the actual positions of the picture elements are changed but the elements retain their intensity values. Because of its limited accuracy, this method is used only for simple geometric corrections such as skew; | |
| ii) | the image is resampled, i.e. a digital image, geometrically distorted, is transformed to a picture on a non-distorted equally spaced grid. The intensity values of the pixels on the derived grid must be determined by interpolation, using neighbouring pixels from the distorted image. |
Enhancement methods are usually applied to an image in which image degradation (radiometric and geometric) has been corrected. Enhancements are designed to aid the human analyst in the extraction and interpretation of pictorial information. This is achieved by emphasizing the features or patterns of interest, e.g., the human visual system can discriminate many more colours than shades of grey, hence a colour display can represent more detailed information, i.e. rainbow encoding rather than grey scale encoding.
Contrast enhancement is a process of accentuating the relative intensity of image elements. It is accomplished in a variety of ways, depending upon the needs of the particular task, e.g.:
|
i) |
linear modification | y=ax+b |
|
ii) |
logarithmic modification | y=b × log(ax)+c |
|
iii) |
exponential modification | y=b × exp (ax)+c |
|
iv) |
external non-linear modification | y=f(x) |
Where x represents the value of an element in the raw image, y is the modified value and a, b and c are constants. The result of contrast enhancement is an image wherein subtle distinctions between shades of grey have become emphasized and therefore easier to distinguish by eye.
This is another method of changing the intensity values in a digital image toimprove the detectability of edge- like features in the scene. It is particularly useful for the detection of linear elements, either oceanographic (warm or cold water fronts) or man-made (canals, waterways). It is carried out with mathematical (high- pass) filters which emphasize the details of an image.
The human visual system can discriminate only 20–30 shades of grey under a given adaptation level. Under the same conditions, it discriminates a much larger number of colours; thus the use of colour provides a dramatic increase in the amount of information that can be perceived.
Multi-images (multispectral, multi-temporal) convey more information than single images. Multi-image enhancement techniques involve independent contrast enhancement of the component images. The enhanced components are then displayed as a false- colour composite. This allows the use of colour as a tool for detecting differences between bands or image dates (i.e. images of the same target recorded at different times).
It is possible to simplify the information content of an image presented in digital form by the reduction of the number of available digital levels. High contrast images with only two levels can be produced by the assignment of a dark colour to one level and no colour to the other. The division of grey scale levels into different classes can be made arbitrarily or according to some specification of the user.
This method is often used for the separation of land and water. In this case a specific wavelength band (generally near infrared) for which land and water radiances are different is chosen. Thus, a histogram of the data would show two very distinct shapes which allow the user to define a threshold to separate them. The pixels having a radiance level below this limit are assigned to a particular colour while those having a radiance level above the limit are assigned to another colour.
After enhancement the image has to be interpreted, in order to extract the real meaning of the digital data, i.e. the environmental significance of the radiances recorded by the sensor.
An image can be divided into distinct classes so that pixels which have similar spectral properties are grouped into the same class. Separating these classes is usually done with statistical or geometric methods. The separation of classes or “classification” is more successful if the targets are spectrally very different. Accuracy of classification suffers when the targets to be separated have near-similar spectral characteristics. An excellent knowledge of surface conditions at representative sites in the area to be mapped is a prerequisite for a successful application of image classification techniques.
Pattern can be defined as an image having spatial or geometrical character in two or three dimensions. For example, the wake of a boat moving on the surface of the sea makes a pattern by which it can be identified in an aerial photograph. Similarly, man-made structures or natural features can be identified by their geometrical shapes. When the identification of pattern or structure is carried out by computer, it is referred to as pattern recognition.
![]()
![]()
![]()