![]()
![]()
![]()
In order that the potential fish producer can select a site, or choose a general location from where a specific site may be selected, then he must have the necessary information telling him the manner in which individual production functions vary spatially, and preferably how selected optimum combinations of these functions vary in “space”. The collection of this information will be one of the most essential activities in the spatial decision-making process, especially in view of the paucity of spatially referenced data in many countries. Indeed, it is now being noted by some involved specifically in GIS (Worrall, 1989) that too little attention is being given to improving data collection techniques, i.e. as a means of improving the quality of the data obtained. Information (or data) would normally, and most usefully, be presented in one of a limited number of ways i.e. as maps, tables of statistics, reports or in graphical form. Since each of these formats must have been compiled from data which were assembled in various ways, it is the concern of this chapter to outline the main ways in which data is acquired, i.e. not the ways in which it is finally mapped.
Figure 1.3 indicated that data could be conveniently sub-divided into the following categories:
Though we will use these four categories, the treatment of the subject matter within each will be rather different, for reasons which will be made clear, and this will greatly effect the amount of space devoted to each and the degree of detail given in some sections - indeed remote sensing will form the subject of a separate chapter.
We cannot explain here the detail of each of the primary techniques involved, mainly because many readers will already be familiar with them, and because there are available numerous authoritative works on the techniques involved in primary data collection. However, since worldwide there are so many potentially promising geographic areas for aquaculture and inland fisheries, about which there exists little or no data, and since in many cases this data would be easy to collect, we shall offer a range of ideas for using primary data collection techniques, i.e. which are relevant to site selection for aquaculture or for the management or development of inland fisheries.
The volume of primary data that can be collected for any specific piece of research, or for any particular site, will be a function of many variables, the important ones being:
However, since resources are usually limited, primary data collection will frequently be location specific and a comprehensive view of an area will seldom be obtained. The actual data acquired from primary data collection will be in several forms, e.g. numeric, digitally encoded, photographic prints, labelled pictorial, written descriptions, colour or key coded spatial. In its raw state it may have little use but most of it will lend itself to transformations. These will include:
Primary data collecting consists of acquiring various types of “original” data by a number of personal or direct methods and techniques. The origins of all published information must have been from various types of primary investigation. It is possible to propose a rather crude typology of primary data collection (Table 3.1). Within each of the technique headings shown there would be specific sub-categories of primary data collection, each applicable to the particular area of research being undertaken. Each of the techniques will encompass a wide degree of sophistication, e.g. for both measurement and photography a range of instruments can be used, and for some techniques it is possible to acquire a high degree of skill, e.g. in field sketching. For all of the techniques there are recognized rules or conventions which are devised to operate within a scientific or objective framework so as to ensure degrees of detail, accuracy, consistency, etc. Most of these primary techniques require that some preparatory work is undertaken, so that aims and objectives are clear, that equipment is available, so that a time table can be met and so that data recording can be easily made. Since it is impractical to completely cover an extensive area by any of the techniques, various sampling methods will need to be employed.
These two techniques can be considered together since they have many similarities and they would be used to gather data on the same production functions. These techniques could be used to locate where conditions were either particularly advantageous or particularly difficult, e.g. steep slopes, dense woodland, cliffs or points where a gravity flow of water could be obtained. Mapping could also indicate locations or points which could be used for particular purpose - in fact, unless very good and up-to-date maps or plans already existed, it would be almost essential to carry out one or other of these techniques for any selected site.
Figure 3.1 (from FAO, 1985) illustrates a typical field sketch of a stretch of river - this has been overlaid by a series of transects along which it is intended to measure soil quality. Any sketch maps could be later transferred to higher quality hard copy or could be improved and then digitized. The user would need to be aware of scale and to have a prepared key. The advantages of using these data collecting techniques are that they are inexpensive, though they are impractical for large areas or sites unless a large number of personnel were available.
| TECHNIQUE | COMMENTS |
|---|---|
| Direct Mapping | Consists of spatial recording of visible features of the landscape, usually by means of coded categories. |
| Photography | Includes still photography, video recording and various kinds of air photography. |
| Field Sketching | Allows scenes to be drawn and annotations to be added referring to important features. |
| Interviewing | This may be face to face or by telephone. |
| Questionnaires | Several important techniques exist each of which can be verbally administered or carried out by post. |
| Measurement | This involves the recording of numerically assessed data, on various measurement scales, by the use of any of a large array of instruments. |
Figure 3.1 Sketch Map Used to Assess Environmental Quality and Soil Sampling Points
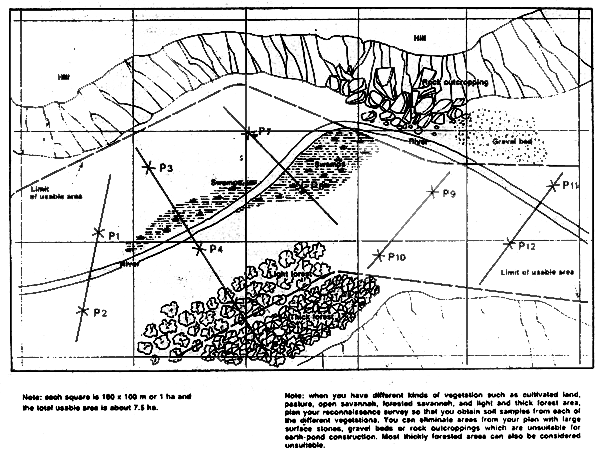
Note: each square is 100×100 m or 1 ha and the total usable area is about 7.5 ha.
Note: When you have different kinds of vegetation such as cultivated land, pasture, open savannah, forested savannah, and light and thick forest area, plan your reconnaissance survey so that you obtain soil samples from each of the different vegetations. You can eliminate areas from your plan with large surface stones, gravel beds or rock outcroppings which are unsuitable for earth-pond construction. Most thickly forested areas can also be considered unsuitable.
By far the most important use is aerial photography but since this is rarely a primary data collection technique carried out purposely for aquaculture or inland fisheries site selection, we shall refer to it along with remote sensing under section 4.4. Ordinary still photography would have few uses other than those mentioned for direct mapping or field sketching. Although ground based photography is also only really viable on a comparatively small scale, video filming is increasingly important since the images can be replicated and shown later to those parties who might be interested in site selection per se or in the viability of particular projects. Similar advantages and disadvantages exist as for direct mapping or field sketching, though camera costs could be very high.
Along with measurement, this is perhaps the most important data collection method. In practice interviewing could help to obtain spatially related information on any production function. Typically, fish farmers are interviewed about management practices, yields and production costs. Fishermen are questioned about catches, gear, operation costs and processing and marketing outlets. This method is enhanced if local experts can be found who can assess the reliability of the responses and who can establish a rapport with the persons being interviewed. Such interviews are particularly valuable if they have the initiative to bring out aspects of spatial information not originally foreseen, but ultimately important for the outcome of the study. For example, various factors relating to a chosen area, e.g. local fishermen frequently have detailed knowledge on local fish habits, climatic factors, water quality, etc. Other people are experts on markets or marketing, on financial matters and credit availability or on the types of advice which might normally be provided by the extension services - though an interview with any existing extension or local fisheries officer before reaching a location decision would seem advisable. Some location factors, such as the availability of underground water, the prevalence of endemic disease and local transport availability, can only be reliably obtained by interviews or personal contact.
There are few particular advantages with this method except that in many cases, as suggested above, interviews can lead to finding out about alternative information sources or important unforeseen problems. The disadvantages are that data obtained might be subjective and it could rarely be converted to mappable or statistical form.
Although questionnaires can only help with the assessment of a limited number of production functions, they may be the only means of finding out about certain important data. Local food preferences can be found out by questionnaire, and fish producers in a given area can be questioned as to their perceptions of the relative importance of each production function to the success of their enterprise. Some marketing information is best found by questionnaire, e.g. which markets will take which kind of fish product, and a survey of fishery officers may indicate details on restocking locations.
Providing that a significant proportion of responses are received then questionnaire techniques have a number of important advantages:
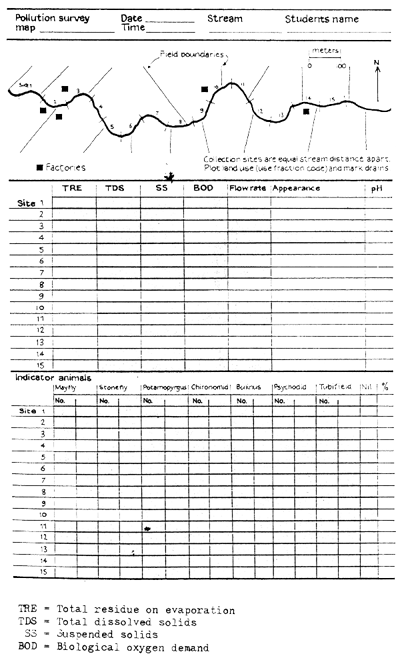
The various measurement techniques could be applied to many functional categories, using an assortment of levels, i.e. nominal, ordinal, interval and ratio scales. Most spatially variable aspects relating to water quality or quantity can be readily measured. Figure 3.2 illustrates two practical ways of measuring water depth - it is taken from FAO (1981) which details all aspects of water quantitative measurements. Other area and yield measurement practices are defined in Petricevic (1988). Soil and water quality parameters are easily measured using various simple techniques (see FAO, 1981 and FAO, 1985). Figure 3.3 gives an example, using several types of measurement, of a data collection survey form designed to give some indication of the overall environment for life along a surveyed stretch of river. Although climatic factors can be measured easily, it may not be worth doing so since valid data needs to be recorded over a considerable time period (perhaps 30 years) and since data on average and extreme conditions can be readily obtained for most areas.
Figure 3.2 Methods for Measuring Water Depth in a Pond or Reservoir
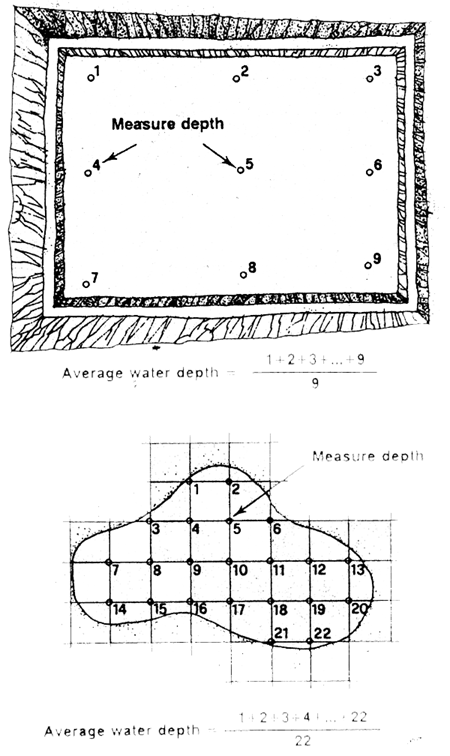
Figure 3.3 Sample Work Sheet for a Stream Survey
The obvious advantage of primary measurement is that site specific data can be obtained. A disadvantage is that several of the measurements would need to be carried out over an extended time period, e.g. water temperatures, and others might be highly variable from day to day, e.g. some water qualitative factors and water volume. Measures such as bathymetric depth and soil quality would be relatively constant. Some measurement techniques could involve rather complex or expensive equipment.
Since all secondary data only represents primary data which has been converted into a more accessible form, and since the actual venues for obtaining most data are mainly self-evident, e.g. libraries, government offices, book shops, private and public organizations, etc., then our concern with obtaining secondary data can be quite short. In this section we will only briefly concern ourselves with three things:
We will briefly allude to the format and sources of secondary data since these are vital to the compilation of the two important methods of assessing location suitability, i.e. via maps and GIS. The format of secondary data takes several basic forms:
Within these four broad categories there are numerous sub-categories. Though any of the formats could be published by themselves, most secondary data relevant to location decision-making would form compilations of these formats. The first three formats will usually be in paper or film form (hard copy). This data format is suitable for most information purposes, as a source for updating obsolete figures or maps, or as data to be used in the absence of an expensive GIS (Butler et al, 1987; Cordell and Nolte, 1988a). However, in this form it is unsuited to modern GIS, which requires that all data be digitally encoded.
The main sources of secondary data may be classified as per Table 3.2. This list is not exhaustive and sub-categorization is possible in all main categories. The source list was compiled largely from: Goddard (1983); FAO (1985); Alonzo (1988); Cordell and Nolte (1988b) and Turnbull (1989). Most of the sources in Table 3.2 are straightforward and may be familiar. They have been listed in several categories in order of increasing utility to the spatial analyst, though in some categories, e.g. handbooks and manuals, it might depend on the particular handbooks or manuals.
There are several trends in evidence regarding secondary data sources. With the advent of new electronic “on-line” methodologies, searching for secondary sources has been made far easier, as long as access is possible!. Computerized data bases are becoming the norm in university and other larger libraries as well as in national and international organizations and larger government departments. These frequently give instant access to files containing abstracts or references on particular subject areas which have been requested.
There has also been an almost exponential proliferation in both academic and trade journals over the past two or three decades as well as a proliferation of specialized conferences which have spawned their “proceedings”. It is this secondary “data surge” which has led first to the need for abstract and bibliographies, then for microfiche facilities and more recently for computer data bases. There has also been a growing “internationalization” of data, a precedence for the English language and a move towards more and more subject specialization.
| Reference Source | Degree of Utility |
|---|---|
| Dictionaries and Glossaries | L |
| Encyclopaedias | L |
| Annuals and Yearbooks | L |
| Newsletters | L |
| Audio Visual sources | L |
| Annual and Quarterly Reports of Fish Depts | M |
| Directories | M |
| Textbooks | M |
| Catalogues | M |
| Trade journals or magazines | M |
| Handbooks and Manuals | M |
| Censuses | M |
| Atlases and Gazetteers | M |
| Reports and Conference Proceedings | H |
| Bibliographies | H |
| Primary journals | H |
| Abstracts | H |
| Statistical sources | H |
| Remote Sensing sources | H |
| Maps | H |
| Computerized Databases | H |
L = of little use. M = of medium use. H = highly useful.
There are several major problems with secondary data acquisition which should be commented on. We have alluded to the difficulty still of gaining access to on-line data base facilities - this remains difficult for many unless fairly high charges can be met or unless access is available via specific occupations. Secondly, much of the secondary data which is of value to those seeking to optimize spatial locations, does not unfortunately fit into easily classifiable categories - we noted earlier how aquaculture and inland fisheries intruded into a complex variety of subject fields. Thirdly, maps are an obvious source of location data, yet map classification is still a poorly ordered subject area. There are many confidentiality and copyright problems to data acquisition which are only slowly being overcome, as are the problems of locating and accessing digital spatial data sets and archives (Dept.of Environment, 1987; Finch and Rhind, 1987).
It would be possible to obtain all data necessary to determine production function variability (of all functions) using only primary data collection. However, since aquaculture and inland fisheries now usually operate in a production environment which incorporates a wide spatial area, this is totally impractical. It would also be possible to obtain most of the necessary data using secondary sources. Here we will restrict our comments to those production functions whose data sources are almost entirely secondary, and we will not be looking at maps as a data source (see section 3.3.3).
Data on market accessibility would be derived from not only maps, but also from various trade and business directories. Sometimes there is government documentation (from Fishery Depts.) giving fish outlets, and in some countries there are wholesale or retail trading associations who issue bulletins or trade magazines. As well as using these sources to seek national information on fish wholesalers, retailers, large institutions, catering chains or outlets, supermarkets, fish freezing or other processing plants, it may be worth seeking data on export opportunities or, at the other extreme, data from various “Chambers of Trade” or directories covering local areas.
Since factors relating to climate must cover as long a temporal period as possible, clearly this data will only be available in published sources. These might comprise, at a general level, larger scale atlas maps but preferably more specific data should be acquired from meteorological offices, agricultural departments or other government sources. River water quantity data is also best obtained from where long-term flow measurement records are kept - these too would usually be government sources or, more specifically, water supply or river authorities.
The availability of inputs which might be obtained from a distant source is clearly going to require secondary data-usually from trade or business directories, from specialist fishery or aquaculture magazines or from the extension services. A good general source of secondary data in many countries is the government organization responsible for overall planning and policy. Of necessity this organization collects and collates statistics on all sectors of the economy, including production from agriculture and livestock by year and by administrative unit. Even if all of the desired data are not available from this unit, the personnel can often direct one to possible sources.
It will be a decision for the intending fish producer, or fishery planner, to determine the balance between obtaining the necessary information from primary or secondary sources. It would be unwise to rely on just one or the other - the balance will largely depend on the resources available for site selection, the amount of secondary data which is actually available and the amount of knowledge which the intending entrepreneur or government official has about the importance of the location decision.
Existing maps will undoubtedly prove to be the best source of data for examining the distribution of most production functions. As Butler et al (1987) has stated, maps “…provide accurate, clear and unambiguous information about the occurrence of various phenomena on or near the surface of the earth”. (p.1). A map is “…a carefully designed instrument that records, analyses and displays the inter-related factors of the area in their true relationship to each other”, and “In many decision-making processes the truly useful information is often that which is obtained from studying the overall relationship of all the data.” (p.1). Butler later explains the essential part that maps and the mapping services can play in the development process generally - this includes many aspects which are directly relevant to both aquaculture and inland fisheries. Butler is a useful source on all aspects relative to the methodology of mapping.
Before we look at uses of the various types of maps (in Chapter 5), we will review here some major sources from where maps can be obtained. The spatial coverage on these sources will be limited and may show a European bias.
There are several sources which give detailed information on the availability of maps throughout the world, e.g. Muriel (1976), Winch (1976), United Nations (1983), Wolter (1985) and Parry and Perkins (1987). Additionally, the “GeoCenter Internationales Landkartenhaus” issue a hierarchy of publications which can be obtained from:
Postfach 800830, D. 7000 Stuttgart 80, West Germany.
Nearly all countries have their own national mapping bodies, most of whom produce topographic and other thematic maps and who issue regular notifications of their publications. Table 3.3 gives a selected list of national mapping organizations (from Lawrence, 1983), and Table 3.4 illustrates the range of map data products available through the National Cartographic Information Center in the U.S.A. (after Cordell and Note, 1988b)
| AUSTRALIA | Division of National Mapping Department of Minerals and Energy, Canberra |
| AUSTRIA | Bundesamt fur Eich-und-Vermessungswesen, Vienna |
| BELGIUM | Institut Géographique Militaire, Brussels |
| CANADA | Department of Energy, Mines and Resources, Ottawa |
| EIRE | Ordnance Survey, Dublin |
| FRANCE | Institut Géographique National, Paris |
| GERMANY | Institut für Angewandt Geodesie, Frankfurt |
| ITALY | Instituto Geografico Militare, Florence |
| JAPAN | Geographical Survey Institute, Ministry of Construction, Tokyo |
| NETHERLANDS | Topografische Dienst, Delft |
| NEW ZEALAND | Lands and Survey Department, Wellington |
| PORTUGAL | Instituto Geografico e Cadastral, Lisbon |
| POLAND | Glowny Urzad Geodezii Kartografii, Warsaw |
| SPAIN | Servicio Geografico del Ejercito, Madrid |
| SOUTH AFRICA | Trigonometrical Survey Office, Pretoria |
| SWITZERLAND | Eidgenössische Topographische, Berne |
| UNITED KINGDOM | Ordnance Survey, Southampton |
| U.S.A. | United States Geological Survey, Reston, Virginia |
| a) | U.S. Geological Survey (USGS) topographic and thematic maps. |
| b) | Color separates (from topographic maps). |
| c) | Feature separates (from topographic maps). |
| d) | Out-of-print map reproductions. |
| e) | Land-use, land cover and associated maps. |
| f) | Slope maps. |
| g) | Digital terrain maps. |
| h) | Maps on microfilm. |
| i) | Orthophoto quads. |
| j) | Geographic computer searches. |
| k) | Geodetic control data. |
| l) | Reproductions on microfiche of State place names. |
| m) | County maps. |
| n) | Topographic maps on rolls of 35mm microfilm. |
| o) | Autopositives. |
| p) | Geographic coordinates of various U.S. and selected world names. |
There are also many private and commercial firms who publish high quality maps, e.g. Bartholomews, Geographica, Philip's, Michelin, Oxford University Press, Rand McNally, Denoyet-Geppert, Hallwag. These firms and others usually supply detailed catalogues. Many national, state or local government departments produce detailed (usually thematic) maps, e.g. Environmental, Agricultural, Industrial, Conservation Departments, etc., and local planning authorities are frequently obliged to provide mapped details of existing and future, urban and rural, plans at various scales.
Various international and national map libraries exist with possibly the most extensive collection being held by the British Library in London (about 1 450 000 sheets plus >20000 atlases). The British Library has recently instigated “CARTO-NET” - a fully functioning, automated map cataloguing and retrieval system which gives a complete bibiographic cover of all maps and map series, based on either a grid coordinate search or by interactive graphics (Morris, 1987).
There are now many government, commercial and academic bodies who are creating digitized topographic and thematic maps, and who are creating archives of their materials. Several developed countries have set targets to have completed digital mapping at 1:50 000 scale or larger by the end of this decade. Various global scale data sets are available, e.g. World Data Bank 1 and 2, and Bickmore (1987) reports a topographic data base for the environmental sciences containing contours, river networks and coastlines, digitized from 1:1 000 000 scale maps. The FAO also holds many continental or world scale digitized maps. Openshaw et al (1986) and Maling (1989) report the application of the interactive video disc for the storage of large numbers of maps in a computer accessible form which does not overwhelm the electronic storage capacity. These maps do not need to be digitized but at the moment they suffer from poor resolution. Several other marine and river data base sets are available, e.g. the MARIS system for the Atlantic coastline of Canada (Butler et al, 1986), and the National River authorities data bases of some river systems in England and Wales. These localized data bases have limited availability and accessibility. Digital mapping will receive further coverage in Chapter 6.
Other map and mapping sources include various atlases, thematic atlases, cartographic journals, university geography departments, gazetteers, map and atlas collections, etc., many of which are documented in Lawrence (1983).
Although unlimited primary data could be collected and much secondary data exists, there will inevitably be deficiencies in relevant data coverage, for some functions in some areas, which could most efficiently be filled by using “proxy” data. This would be data which had been collected and which might appear to have little or no relevance to aquaculture or inland fisheries. The analyst or entrepreneur would need to decide that, on balance, given the time and cost effort needed to collect the true data, it would be more cost-effective to use this alternative. The data itself might be in any of the formats suggested in section 3.3.1 Table 3.5 exemplifies possible “proxy” data which might be used for the particular functions as specified. Any “proxy” data would need to be used with care- clearly some sources are more relevant than others and the degree of relevance would vary spatially. In many cases the balance between using “proxy” data and collecting the relevant primary data might depend upon the accuracy of the “proxy” data or the scale at which it was mapped.
| Production Function Requiring Data | Possible “Proxy” Data | |
|---|---|---|
| 1) | Soil quality | The distribution of particular plant species. |
| 2) | Water quality | The distribution of various aquatic fauna and flora, or the kinds and amounts of various types of land use. |
| 3) | Water temperatures | Maps or tables of air temperatures. |
| 4) | Catering outlets | Directories listing hotels or restaurants. |
| 5) | Underground water sources | Hydrogeological or geology maps. |
| 6) | River water quantity | Annual rainfall maps. |
| 7) | Land costs | Population density maps. |
| 8) | Wholesale market outlets | Distribution of large towns and cities. |
| 9) | Fertilizer inputs | Livestock and/or poultry farms. |
| 10) | Availability of capital inputs | Distribution of large towns and cities. |
Occasionally, where sufficient statistical data exists, it is possible to show a suspected relationship between two variables by the use of scattergrams, regression analysis or correlation coefficients, e.g. there is often a relationship between altitude and rainfall. If this relationship is proven to be strong, then the use of an altitude or relief map of the area covered by the data could be used as a “proxy” data source for rainfall. However, since there is certainly not a universal relationship between altitude and rainfall, then the use of this method for establishing “proxy” data would be spatially limited (unfortunately to an unspecified degree). Sometimes it might be relevant to use two or more “proxy” data sources, e.g. “land costs” could be a function of population density and “quality of land”. Most of the “derived” maps, which will be exemplified in Chapter 5, incorporate one or two sources of “proxy” data.
![]()
![]()
![]()