![]()
![]()
1. GEOGRAPHY AND CLIMATE (Welcomme, 1979a)
Angola (with a surface area of 1 246 700 km2) is divided into
The major part of Angola is a central plateau, 1 000–1 600 m in altitude, rising in the west-central region to highlands of 2 000–2 500 m. There is a narrow coastal plain. The northern part of Angola is covered with rain forest; the south is savanna merging into semi-arid desert. Cabinda is low-lying, tropical and densely forested.
In general, the north of Angola is tropical in climate, whereas the south is semiarid. The climate is largely conditioned by the cold Benguela current and gives a temperate character to the coastal regions. There are two main seasons: a cold, dry season from May to October; and a warm, wet season from November to April. During the cold period temperatures can drop to freezing on the plateau. Angola is a predominantly agricultural country with some mining in the northeastern region.
2. HYDROGRAPHY (Welcomme, 1979a)
2.1 Lakes
There are no large lakes in Angola, but there are numerous smaller bodies of water associated with the floodplains of river systems in the south and east of the country.
2.2 Rivers, Floodplains and Swamps
The country is, on the whole, well watered by rivers draining the central highland plateau. Poll (1967) assigns the rivers to five main basins corresponding to zoogeographical regions. These are:
The major river channels total over 10 000 km in length, without counting small streams. Floodplains with numerous small lakes occur along the lower reaches of many of the rivers, discharging westward into the Atlantic Ocean.
2.3 Reservoirs
There are several impoundments; the largest are at Gove, on the Cunene, and Kiminha, on the Bengo. Several large reservoirs are projected for the future.
2.4 Coastal Lagoons
There are a few coastal lagoons; the largest are Buraco and Chissambe Lagoons.
3. FISHERY PRODUCTION/POTENTIAL
3.1 Aquaculture
Several fish-culture stations already exist in the highlands. However, this sector has experienced a number of difficulties and drawbacks in the past, due mainly to the high cost of investment and inadequate training of personnel (Giudicelli et al., 1987).
Vincke (1989, pers.comm.) estimates the aquaculture production as follows:
| Species | 1982 | 1983 | 1984 | 1985 | 1986 | 1987 |
| Tilapia sparrmanii | 0 | 7 t | - | 2 t | 0 | 0 |
3.2 Fish Production and per caput supply
Table 1. FISH PRODUCTION AND PER CAPUT SUPPLY - Angola, 1970–1987
| Nominal Domestic Production (t) 2 | Nominal Consumer Supply (kg/person) 2 | ||||||||
| Year | Population '000 1 | Inland capture | Aquaculture 3 | Marine capture | Total | Inland capture | Aquaculture 3 | Marine capture | Total |
| 1970 | 5 588 | - 4 | - | 368 200 | 368 200 | - | - | - | - |
| 1971 | 5 763 | - | - | 316 300 | 316 300 | - | - | - | - |
| 1972 | 5 944 | - | - | 599 100 | 599 100 | - | - | - | - |
| 1973 | 6 130 | - | - | 472 000 | 472 000 | - | - | - | - |
| 1974 | 6 322 | - | - | 393 259 | 393 259 | - | - | - | - |
| 1975 | 6 520 | - | - | 153 580 | 153 580 | - | - | - | - |
| 1976 | 6 753 | - | - | 74 542 | 74 542 | - | - | - | - |
| 1977 | 6 998 | - | - | 113 408 | 113 408 | - | - | - | - |
| 1978 | 7 247 | - | - | 118 630 | 118 630 | - | - | - | - |
| 1979 | 7 491 | 8 000 6 | - | 106 072 | 114 072 | 1.0 | - | - | - |
| 1980 | 7 723 | 8 000 | - | 77 585 | 85 585 | 1.0 | - | - | - |
| 1981 | 7 939 | 8 000 | - | 123 457 | 131 457 | 1.0 | - | - | - |
| 1982 | 8 142 | 8 000 | 0 5 | 103 988 | 111 988 | 1.0 | 0 | - | - |
| 1983 | 8 339 | 7 993 | 7 5 | 102 876 | 110 876 | 1.0 | 0.0008 | - | - |
| 1984 | 8 540 | 8 000 | - | 64 700 | 72 700 | 0.9 | - | - | - |
| 1985 | 8 754 | 7 998 | 2 5 | 66 497 | 74 497 | 0.9 | 0.0002 | - | - |
| 1986 | 8 990 | 8 000 | 0 5 | 50 501 | 58 501 | 0.9 | 0 | - | - |
| 1987 | 9 233 | 8 000 | 0 5 | 73 339 | 81 339 | 0.9 | 0 | - | - |
1 Source: FAO
2 Source: FAO Fisheries Dept., FISHDAB
Important note: Inland capture = excluding export. Marine capture = export statistics not available. It is therefore not possible to ascertain precisely what part of the marine capture is actually used for domestic consumption.
3 included in “Inland capture” if not specified
4 - = data not available
5 Vincke, 1989 (pers.comm.)
6 There are no official statistics for inland capture fisheries yield or aquaculture production, nor is it possible from other data sources to derive an accurate estimate of yield in any past year(s). The 8 000 t for 1979–1987 are rough estimates.
3.3 Inland catch range and potential yield
No detailed information available for:
Lakes Bezi-Bezi, Calundo, Cambala, Carumbo, Catete, Chibondo, Dilolo,
Machive, Malanje, Muchova, Nuntechite, Uambafuca;
Rivers Bengo, Catumbela, Cuanza, Cubango, Cunene, Dande, Kasai, Longa, Zaire,
Zambezi;
Floodplain Ovambo;
Reservoirs Cuando, Gove, Jamba, Kambumbe, Kiminha, Mabubas, Matala;
Lagoons Buraco, Carvalhao, Chissambe, Marembo.
Table 2. INLAND CATCH RANGE AND POTENTIAL YIELD
| Period | Annual catch range (t) | Potential annual yield (t) 1 | |
| Moxico Province | current | 2 500–5 000 | 20 000 |
| Lower Zaire Basin | - | - | 10 000 |
| Coastal Basins (Bengo, Cuanza, Dande, Longa Rivers) | current | 5 000 | 5 000–10 000 |
| Cumido-Cubango Basin | - | - | 5 000 |
| Cunene Basin | - | - | 5 000 |
| Other Rivers, small lakes & Reservoirs | - | - | 5 000 |
1 Potential yield estimates after Matthes, 1982.
| Total annual yield: | 6 000 t (Giudicelli et al., 1987) |
| 8 000 t (see Table 1) | |
| Potential annual yield: | 50 000–55 000 t (Matthes, 1982) |
| 113 000 t (SADCC, 1984) |
4. STATE OF THE FISHERY
4.1 Yield
The lack of figures and reported catches from Angola almost certainly presents a false picture of the importance of inland fish and fisheries. There are four major areas for inland fisheries.
* (Note: All potential yield estimates after Matthes, 1982)
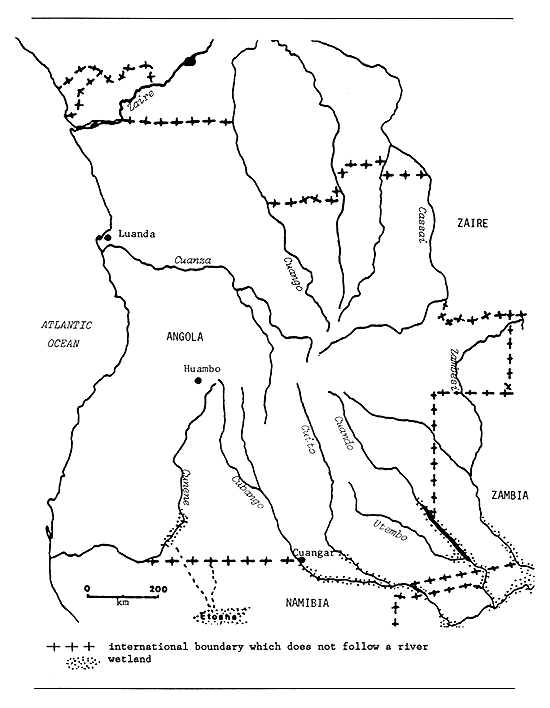
Fig. 1. WETLANDS OF ANGOLA
(Mepham, 1987)
As well as in these major areas, considerable potential for fisheries exists in the numerous other water bodies of Angola. An overall potential of 50–55 000 t/yr is calculated, with the present catch considerably less (possibly about 6–8 000 t/yr). Therefore there exists a great potential for increasing the catch.
4.2 Factors influencing yield
The continued unstable security situation, especially in the south, is probably the single greatest impediment to inland fisheries development. Inland fisheries also tend to be overshadowed by the highly productive marine fishery. Other factors cited as impairing development are lack of trained manpower, unavailability of fishing gear, and nearly total absence of adequate marketing, preservation and transport infrastructure. As most of the inland waters are rivers, the yield would be sensitive to any management works aimed at controlling flow (such as irrigation projects or dam constructions). Almost all major westward flowing rivers are now impounded near the upstream end of their coastal floodplains and this undoubtedly adversely affects floodplain yields to varying degrees. Furthermore, some of the rivers are in densely forested areas and are probably relatively unproductive.
4.3 Future development possibilities
The inland fishery sector is unimportant, relative to the extensive marine fishery, hence little attention has been paid to it. However, there is a large potential for development, particularly in the interior where marine fish rarely penetrate. Here, given the appropriate infrastructure and termination of security problems, there is likely to be rapid expansion of the sector.
5. KEY BIBLIOGRAPHY
Limnology, inland fisheries, ichtyology:
Poll, 1967; Matthes, 1982; Gliwitz, 1986; Mepham, 1987c
Fish processing in Angola: Limpus, 1988
6. WATER BODIES DIRECTORY
| Lakes | |||
| Bezi-Bezi | Chiboco | Embundo Complex | Muchova |
| Calundo (Cameia) | Chibondo | Macanda | Muongo |
| Cambala | Chicapa | Machive | Nangage |
| Carumbo | Chicapa | Magiuas | Nuntechite |
| Catete | Chiuoso | Malanje | Sapua |
| Chandumba | Cuango | Mangue | Uambafuca |
| Chavuma Complex | Dilolo | Maninga Complex | |
| Rivers | |||
| Bengo | Dande | Okavango/Cubango | |
| Catumbela | Kasai/Kwa | Zaire/Congo | |
| Cuanza | Longa | Zambezi | |
| Cunene | |||
| Floodplain | |||
| Ovambo | |||
| Reservoirs | |||
| Biopio | Cuando | Kuando | Matala |
| Cambambe | Gove | Kuene | Misssombo |
| Cariango | Jamba | Lamaun | Tchamutete |
| Chissola | Kambumbe | Luachimo | Yamba-ia-oma |
| Kiminha | Mabubas | ||
| Lagoons | |||
| Buraco | Chissambe (Massabi) | Mabembo | |
| Carvalhao | Ganga | Saca | |
LAKE BEZI-BEZI
| Geographical data | |
| Location: | Angola - 16° 13'S; 19° 39'E |
| Surface area: | 1.4 km2 |
| Max. length: | 2 km |
| Max. width: | 1 km |
LAKE CALUNDO (= CAMEIA)
| Geographical data | |
| Location: | Angola - 11° 43'S; 20° 48'E |
| Surface area: | 4.2 km2 |
| Max. length: | 4 km |
| Max. width: | 1.5 km |
| Outflowing river: | Lumeji |
LAKE CAMBALA
| Geographical data | |
| Location: | Angola - 9° 31'S; 13° 39'E |
| Surface area: | 5.3 km2 |
| Max. length: | 3 km |
| Max. width: | 2.5 km |
LAKE CARUMBO
| Geographical data | |
| Location: | Angola - 7° 47'S; 19° 55'E |
| Surface area: | 2.1 km2 |
| Max. length: | 3 km |
| Max. width: | 1 km |
| Inflowing river: | Luchico |
| Outflowing river: | Luchico |
LAKE CATETE
| Geographical data | |
| Location: | Angola - 10° 30'S; 17° 45'E |
| Surface area: | 5.6 km2 |
| Max. length: | 4 km |
| Max. width: | 2 km |
LAKE CHANDUMBA
| Geographical data | |
| Location: | Angola - 10° 13'S; 19° 23'E |
| Outflowing river: | Chicundo |
CHAVUMA LAKES COMPLEX
| Geographical data | |
| Location: | Angola - 15° 0'-15° 15'S; 21° 0' -22° 0'E |
| Outflowing river: | Chavuma |
| Special features: | a complex consisting of a large number of small lakes lying within the Chavuma River basin (the Chavuma discharges into the Zambezi River). The lakes include Lakes Banda, Licolocolo, Chavo, Suquia, Liesse, Capaco, Chitala, Lilepue, Massunzo, Nhate, Uito, Liamuia, Liassa, Libala, Luparala and Rianguelo. |
LAKE CHIBOCO
| Geographical data | |
| Location: | Angola - 12° 55'S; 22° 37'E |
LAKE CHIBONDO
| Geographical data | |
| Location: | Angola - 10° 32'S; 17° 48'E |
| Surface area: | 9.0 km2 |
| Max. length: | 4 km |
| Max. width: | 3.2 km |
LAKE CHICAPA
| Geographical data | |
| Location: | Angola - 10° 38'S; 19° 35'E |
| Outflowing river: | Cuilo |
LAKE CHICAPA
| Geographical data | |
| Location: | Angola - 11° 10'S; 19° 12'E |
| Outflowing river: | Chicapa |
LAKE CHIUOSO
| Geographical data | |
| Location: | Angola - 12° 34'S; 22° 25'E |
| Inflowing river: | Longonho |
| Outflowing river: | Longonho |
LAKE CUANGO
| Geographical data | |
| Location: | Angola - 8° 33'S; 15° 41'E |
| Outflowing river: | Munene |
LAKE DILOLO
| Geographical data | |
| Location: | Angola - 11° 31'S; 22° 03'E |
| Altitude: | 1 097 m asl |
| Surface area: | 18.9 km2 |
| Max. length: | 9 km |
| Max. width: | 3 km |
| Inflowing river: | Calumbo |
| Outflowing river: | Dilolo |
| Fisheries data | |
| No. of fishermen: | 300 in 1981 |
EMBUNDO LAKES COMPLEX
| Geographical data | |
| Location: | Angola - 16° 10'S; 16° 50'E |
| Outflowing river: | Chimomo |
| Special features: | a complex of approximately ten small lakes, including Lakes Anruima and Kelly |
LAKE MACANDA
| Geographical data | |
| Location: | Angola - 11° 47'S; 20° 49'E |
| Outflowing river: | Lumeji |
LAKE MACHIVE
| Geographical data | |
| Location: | Angola - 16° 41'S; 20° 43'E |
| Surface area: | 3.7 km2 |
| Max. length: | 3.5 km |
| Max. width: | 1.5 km |
LAKE MAGIUAS
| Geographical data | |
| Location: | Angola - 12° 56'S; 23° 21'E |
| Outflowing river: | Lucunhe |
LAKE MALANJE
| Geographical data | |
| Location: | Angola - 9° 31'S; 16° 25'E |
| Surface area: | 2.1 km2 |
| Max. length: | 3 km |
| Max. width: | 1 km |
| Outflowing river: | Lombe |
LAKE MANGUE
| Geographical data | |
| Location: | Angola - 8° 50'S; 15° 47'E |
| Altitude: | 1 204 m |
MANINGA LAKES COMPLEX
| Geographical data | |
| Location: | Angola - 12° 59'S; 24° 00'E |
| Outflowing river: | Maninga |
| Special features: | a group of small lakes drained by the Maninga River. Includes Lakes Cacunguana, Cambuata and Canengane. |
LAKE MUCHOVA
| Geographical data | |
| Location: | Angola - 16° 13'S; 19° 43'E |
| Surface area: | 2.1 km2 |
| Max. length: | 3 km |
| Max. width: | 1 km |
| Outflowing river: | Luangundo |
LAKE MUONGO
| Geographical data | |
| Location: | Angola - 10° 44'S; 19° 45'E |
LAKE NANGAGE
| Geographical data | |
| Location: | Angola - 10° 28'S; 19° 23'E |
LAKE NUNTECHITE
| Geographical data | |
| Location: | Angola - 15° 7'S; 13° 25'E |
| Surface area: | 6.3 km2 |
| Max. length: | 4.5 km |
| Max. width: | 2 km |
| Outflowing river: | Chibia |
LAKE SAPUA
| Geographical data | |
| Location: | Angola - 12° 53'S; 19° 20'E |
| Outflowing river: | Luembe |
LAKE UAMBAFUCA
| Geographical data | |
| Location: | Angola - 17° 15'S; 20° 27'E |
| Surface area: | 1.4 km2 |
| Max. length: | 2 km |
| Max. width: | 1 km |
BENGO RIVER
| Geographical data | |
| Source: | northern Angola (Crystal Mountains) |
| Altitude: | 1 400 m asl |
| Total length: | 300 km |
| Drainage area: | 7 370 km2 |
| Countries traversed: | Angola |
| Discharges to: | Atlantic Ocean - 8° 44'S; 13° 24'E |
| Volume of discharge: | 1.194 km3/yr (47 m3/sec, mean) |
| Special features: | the lower 90 km has a lateral floodplain with numerous small lakes. These include Lakes Panguila (1.5 km2), Quilunda (2.0 km2) and Lalama (16 km2) with a combined overall lacustrine surface area of 75.18 km2). There is a dam at Kiminha. |
| Fisheries data | |
| No. of fishermen: | 85 in 1983 |
| Potential annual yield: | Coastal basins, including Dande, Bengo, Cuanza and Longa |
| Rivers: 5 000 t (Matthes, 1982) | |
CATUMBELA RIVER
| Geographical data | |
| Source: | Central Angola (Bie Plateau) |
| Altitude: | 2 500 m asl |
| Total length: | 260 km |
| Countries traversed: | Angola |
| Discharges to: | Atlantic Ocean - 12° 26'S; 13° 29'E |
| Special features: | the Catumbela is impounded at Biopio and at Lamauna |
| Fisheries data | |
| Potential annual yield: | 200 t (excluding reservoirs) |
CUANZA RIVER
| Geographical data | |
| Source: | Central Angola (Bie Plateau) |
| Altitude: | 1 590 m asl |
| Total length: | 960 km |
| Drainage area: | 121 470 km2 |
| Countries traversed: | Angola |
| Major tributaries: | Luando, Cutato, Cuquema |
| Discharges to: | Atlantic Ocean - 9° 21'S; 13° 9'E, 60 km south of Luanda |
| Volume of discharge: | 26.4 km3/yr (58 m3/sec, mean) |
| Special features: | there is an extensive floodplain with numerous small lakes lying lateral to the main river channel along its last 160 km before the sea. These small lakes include Lakes Cassaque, Cabemba (21 km2), Toa (10 km2), Negolome, Cazanga, Quiombe and Muenga, with an overall combined lacustrine surface area of 184.13 km2. There is an hydroelectric dam at Cambambe. |
| Fisheries data | |
| No. of fishermen: | 1 128 in 1983 |
| Potential annual yield: | Coastal basins, including Dande, Bengo, Cuanza and Longa |
| Rivers: 5 000 t (Matthes, 1982) | |
CUNENE RIVER
(International water)
| Geographical data | |
| Source: | central Angola (Bie Plateau) |
| Altitude: | 1 800 m asl |
| Total length: | 975 km |
| Drainage area: | 83 000 km2 |
| Countries traversed: | Angola, Namibia |
| Major tributaries: | Calonga |
| Discharges to: | Atlantic Ocean - 17° 15'S; 11° 46'E |
| Volume of discharge at mouth: 6.77 km3 | |
| Special features: | the Cunene is impounded at Matala, Kuene and Gove and on the Calonga tributary north of Cassinga. Some 15 000 km2 of the Ovambo floodplain are situated within Angola. |
| Fisheries data | |
| Potential annual yield: | Cunene basin: 5 000 t (Matthes, 1982) |
DANDE RIVER
| Geographical data | |
| Source: | northern Angola (Crystal Mountains) |
| Altitude: | 1 350 m asl |
| Total length: | 285 km |
| Countries traversed: | Angola |
| Discharges to: | Atlantic Ocean - 8° 28'S; 13° 23'E |
| Volume of discharge at mouth: 50 m3/sec (mean) | |
| Special features: | the lower 30 km has a lateral floodplain with numerous small lakes (including Lakes Sungue, Ibendua and Morima) with a combined surface area of 70.79 km2. Further upstream there is a dam at Mabubas. |
| Fisheries data | |
| No. of fishermen: | 238 in 1983 |
| Potential annual yield: | Coastal basins, including Dande, Bengo, Cuanza and Longa |
| Rivers: 5 000 t (Matthes, 1982) | |
KASAI/KWA RIVER
(International water)
| Geographical data | ||
| Source: | near Villa Luso, Angola (Kasai) | |
| Altitude: | 1 500 m | |
| Total length: | 1 735 km (last 85 km, from Kasai-Lukenie/Fimi confluence to Congo/Zaire confluence, called Kwa) | |
| Countries traversed: | Angola, Zaire | |
| Major tributaries: | ||
| Lubilash/Sankuru | 1 150 km | |
| Kwango | 750 km | |
| Kwilu | 960 km | |
| Lukenie/Fimi | 1 060 km | |
| Discharges to: | Congo/Zaire River at Kwamouth | |
| Special features: | Lake Maji Ndombe discharges into Congo/Zaire through the Fimi and Kwa Rivers. In Angola, one tributary (the Luachino River) is impounded by a small 8-m-high dam. | |
LONGA RIVER
| Geographical data | |
| Source: | Angola, near Caliliueke |
| Altitude: | 1 725 m asl |
| Countries traversed: | Angola |
| Major tributaries: | Nhia, Mugige |
| Discharges to: | Atlantic Ocean - 10° 15'S; 13° 30'E |
| Special features: | lateral floodplain along lowermost course (65 km long) with several small lakes (including Lakes Hengue and Toto). Source of Nhia tributary is a small lake. |
| Fisheries data | |
| Potential annual yield: | Coastal basins, including Dande, Bengo, Cuanza and Longa |
| Rivers: 5 000 t (Matthes, 1982) | |
OKAVANGO/CUBANGO RIVER
(International water)
| Geographical data | |
| Source: | Bie Plateau, Angola |
| Total length: | 2 560 km |
| Countries traversed: | Angola, Botswana, Namibia |
| Major tributaries: | Cuito |
| Discharges to: | the mouth of the Okavango splits into three main arms to form an internal delta which discharges into the Okavango Swamps. A further branch, the Thamalkane River, is connected to Lake Dow. A reversible and periodic connection exists between the Okavango and the Kwando and Zambezi system. During the floods the Okavango sends surplus water to the Kwando (or Chobe) River which, in turn, joins the Zambezi. If the Zambezi floods arise early, however, the process may be reversed. |
| Volume of discharge at mouth: 254 m3/sec | |
| Fisheries data | |
| Potential annual yield: | Cumido-Cubango basin: 5 000 t (Matthes, 1982) |
ZAIRE/CONGO RIVER
(International water)
| Geographical data | |
| Total length: | 4 700 km |
| Drainage area: | 4 014 500 km2 |
| Countries traversed: | the basin covers parts of Angola, Burundi, Cameroon, Central African Republic, Congo, Rwanda, Tanzania, Zaire and Zambia. The lowermost 60 km of the river above the mouth forms the international boundary between Angola and Zaire. For a more detailed description of the Zaire/Congo basin, see the Zaire country file. |
| Discharges to: | South Atlantic - 6° S; 12° E |
| Volume of discharge at mouth: 22–67 000 (mean 39 160) m3/sec | |
| Suspended silt load: | 50 500 000 t/yr |
| Flood regime: | bimodal floods with peaks in May and December |
Physical and chemical data | ||
| pH: | upper course: 5.5; middle course: 6.5; Tshwapa River: 4.0–6.5; at Yangambi: 7.05–7.8 | |
| Ionic composition: | (Meybeck, 1978) | |
| mg/l | ||
| Na | 1.70 | |
| K | 1.10 | |
| Ca | 2.40 | |
| Mg | 1.25 | |
| Cl | 2.85 | |
| SO4 | 2.95 | |
| SiO2 | 9.80 | |
| HCO3 | 11.2 | |
Fisheries data
Potential annual yield: Lower Zaire Basin in Angola: 10 000 t (Matthes, 1982)
ZAMBEZI RIVER
(International water)
| Geographical data | |
| Source: | northwest Zambia and eastern Angola |
| Altitude: | 1 600 m |
| Total length: | 2 574 km |
| Drainage area: | 1 300 000 km2 total |
| Countries traversed: | Angola, Mozambique, Zambia, Botswana, Namibia, Zimbabwe |
| Major tributaries: | Cuando, Kafue, Luangwa, Shire. The Zambezi system also communicates with the Okovango system via the Chobe River. |
| Discharges to: | Indian Ocean - 18° 47'S; 36° E |
| Volume of discharge at mouth: 7 070 m3/sec | |
| Flood regime: | December to July, maximum in March |
| Special features: | in Angola, an extensive floodplain complex (20 000 km2) with numerous small lakes within the Luena and Chefumage tributary basins. |
Physical and chemical data (Coche, 1968)
| Above Lake Kariba | ||||
| Flood | Low water | |||
| Temperature: | 30°C | 17°C | ||
| Conductivity: | K20 50 μ S/cm | 96 μ S/cm | ||
| pH: | - | 7.4 | ||
| Total alkalinity: | 20 mg/l | 44 mg/l | ||
| Total hardness: | 17.9 mg/l | 38.1 mg/l | ||
| Ionic composition: | mg/l | mg/l | ||
| Na | 1.70 | 3.26 | ||
| K | - | 0.88 | ||
| Ca | 4.93 | - | ||
| Mg | 1.47 | 3.86 | ||
| NO2-N | 0.00376 | 0.00024 | ||
| NO3-N | 0.0047 | 0.0158 | ||
| PO4-P | 0.0295 | 0.0078 | ||
Fisheries data
No. of fish species: Upper Zambezi: 49 (Jubb, 1961)
OVAMBO FLOODPLAIN
(International water)
| Geographical data | |
| Location: | Angola, Namibia - 16° -18° S; 14° 50' -16° E |
| Surface area: | 23 000 km2 (15 000 km2 in Angola; 8 000 km2 in Namibia) |
| Major inflowing river: | Cunene |
| Outflowing river: | overspill and seepage to Etosha Pan |
BIOPIO RESERVOIR
| Geographical data | |
| Location: | Angola - 12° 28'S; 13° 45'E |
| Dam height: | 13 m |
| Major inflowing river: | Catumbela |
| Outflowing river: | Catumbela |
CAMBAMBE RESERVOIR
| Geographical data | |
| Location: | Angola - 9° 45'S; 14° 30'E |
| Dam height: | 87.5 m |
| Major inflowing river: | Cuanza |
| Outflowing river: | Cuanza |
CARIANGO RESERVOIR
| Geographical data | |
| Location: | Angola |
CHISSOLA RESERVOIR
| Geographical data | |
| Location: | Angola |
CUANDO RESERVOIR
| Geographical data | |
| Location: | Angola - 12° 48'S; 15° 54'E |
| Surface area: | 4.2 km2 |
| Max. length: | 6 km |
| Max. width: | 1 km |
GOVE RESERVOIR
| Geographical data | |
| Location: | Angola - 13° 26'S; 15° 52'E |
| Dam height: | 58 m |
| Surface area: | 140 km2 |
| Depth: | 17.4 m (mean) |
| Volume: | 2.436 km3 |
| Major inflowing river: | Cunene |
| Outflowing river: | Cunene |
JAMBA RESERVOIR
| Geographical data | |
| Location: | Angola - 14° 41'S; 16° 1'E |
| Surface area: | 15 km2 |
| Overall length: | 21 km |
| Max. width: | 1 km |
| Major inflowing rivers: | Colui, Cuandeja |
| Outflowing river: | Colui |
KAMBUMBE RESERVOIR
| Geographical data | |
| Location: | Angola |
| Surface area: | 0.20 km2 |
KIMINHA RESERVOIR
| Geographical data | |
| Location: | Angola - 8° 54'S; 14° 12'E |
| Dam height: | 42 m |
| Surface area: | 50 km2 |
| Depth: | 28 m (mean) |
| Volume: | 1.4 km3 |
| Major inflowing river: | Bengo |
| Outflowing river: | Bengo |
| Fisheries data | |
| No. of fishermen: | 535 in 1983 |
KUANDO RESERVOIR
| Geographical data | |
| Location: | Angola |
KUENE RESERVOIR
| Geographical data | |
| Location: | Angola |
| Major inflowing river: | Cunene |
| Outflowing river: | Cunene |
LAMAUN RESERVOIR
| Geographical data | |
| Location: | Angola |
| Dam height: | 15 m |
| Major inflowing river: | Catumbela |
| Outflowing river: | Catumbela |
LUACHIMO RESERVOIR
| Geographical data | |
| Location: | Angola - 7° 23'S; 20° 50'E |
| Dam height: | 8 m |
| Major inflowing river: | Luachimo |
| Outflowing river: | Luachimo |
MABUBAS RESERVOIR
| Geographical data | |
| Location: | Angola - 8° 32'S; 13° 43'E |
| Dam height: | 40 m |
| Surface area: | 20 km2 |
| Depth: | 2.7 m (mean) |
| Volume: | 53 × 106 m3 |
| Max. length: | 7 km |
| Max. width: | 2 km |
| Major inflowing river: | Dande |
| Outflowing river: | Dande |
MATALA RESERVOIR
| Geographical data | |
| Location: | Angola - 14° 43'S; 15° 3'E |
| Dam height: | 20 m |
| Surface area: | 28 km2 |
| Depth: | 2.5 m (mean) |
| Volume: | 70 × 106 m3 |
| Max. length: | 16 km |
| Max. width: | 2.5 km |
| Major inflowing river: | Cunene |
| Outflowing river: | Cunene |
MISSOMBO RESERVOIR
| Geographical data | |
| Location: | Angola |
| Outflowing river: | Kuebe |
TCHAMUTETE RESERVOIR
| Geographical data | |
| Location: | Angola |
| Outflowing river: | Kalonga |
YAMBA-IA-OMA RESERVOIR
| Geographical data | |
| Location: | Angola |
BURACO LAGOON
| Geographical data | |
| Location: | Angola - 9° 0'S; 13° 3'E |
| Surface area: | 95 km2 |
| Max. length: | 27 km |
| Max. width: | 5 km |
| Outflow: | inlet to Atlantic Ocean |
CARVALHAO LAGOON
| Geographical data | |
| Location: | Angola - 15° 45'S; 12° 06'E |
| Surface area: | 3.2 km2 |
| Max. length: | 3 km |
| Max. width: | 1.5 km |
| Major inflowing river: | Hiquia |
| Outflow: | to estuary of Curoca River |
CHISSAMBE (= MASSABI) LAGOON
| Geographical data | |
| Location: | Angola - 5° 03'S; 12° 04'E |
| Surface area: | 35 km2 |
| Max. length: | 12.5 km |
| Max. width: | 4 km |
| Major inflowing river: | Lubinda |
| Outflow: | canal to Atlantic Ocean |
GANGA LAGOON
| Geographical data | |
| Location: | Angola - 7° 49'S; 13° 8'E |
| Major inflowing river: | Loge |
MABEMBO LAGOON
| Geographical data | |
| Location: | Angola - 5° 10'S; 12° 13'E |
| Surface area: | 14.9 km2 |
| Max. length: | 8.5 km |
| Max. width: | 2.5 km |
| Major inflowing river: | Chiluango |
SACA LAGOON
| Geographical data | |
| Location: | Angola - 7° 10'S; 12° 54'E |
| Major inflowing river: | Mebridege |
7. BIBLIOGRAPHY
Coche, 1968
Giudicelli et al., 1987
Gliwitz, 1986
Jubb, 1961
Limpus, 1988
Matthes, 1982
Mepham, 1987c
Meybeck, 1978
Poll, 1967
SADCC, 1984
Welcomme, 1972; 1979a
1. GEOGRAPHY AND CLIMATE (Welcomme, 1979a)
Botswana (with a surface area of 585 370 km2) is a vast tableland of 1 000 m mean altitude, but in the north and northwest several depressions are associated with the drainage patterns of the main rivers. The country is generally arid savanna, grading into the Kalahari Desert to the west. The Okavango Depression in the northwest is somewhat better wooded and is generally more moist.
Most of the country is dry with hot summers and cold winters; in the desert regions winter temperatures (May-August) can fall below zero at night. Late summer (February-April) is the wettest time of the year, but there is much variability from year to year. Flooding of the Okavango depends greatly on the rainfall in the upper catchment in Angola which may be very different from that in Botswana. Most of the water in the Okavango Delta is lost by evaporation.
The Okavango Delta area is used for subsistence farming, either as dry agriculture or floodplain agriculture. Much of the basin is still occupied by wildlife as population densities are very low. At present there are no irrigation schemes, although some are being proposed.
2. HYDROGRAPHY
2.1 Lakes (after West, 1986)
The main natural lakes of importance are the Ngami, Xau and Liambezi. The Ngami and Xau Lakes form the terminal sumps of the Okavango Delta and are fed mainly by the Boteti River, while the Liambezi Lake is fed by the Chobe River. All three of these lakes used to be highly productive, supporting good fisheries, but in recent years, owing to continued drought, they have all dried up completely.
Until it dried up in 1982, Lake Ngami was a very productive lake which supported a rapidly developing fishery yielding over 200 t/yr. According to estimates, this lake has a potential of producing more than 3 000 tons of fish a year.
Lake Liambezi did not dry up completely until 1986. Before then, the lake used to support a sizeable fishery which was rapidly developing under a viable cooperative system. Yields as high as 1 000 t/yr have been obtained from this lake, most of which were exported. Available records show that up to 800 tons of fish per year (mainly iced) were marketed out of Lake Liambezi to Zimbabwe and Zambia in past years.
2.2 Rivers, Floodplains and Swamps (after Welcomme, 1979a)
The Okavango and its terminal swamps are the largest aquatic system in the country. The Okavango River enters Botswana from Angola after crossing the Caprivi strip, and almost immediately spreads out into fan-shaped delta swamp. The swamp is endorheic and only has outflow in exceptional years when part of the flow drains into the Zambezi system by way of the Selinda Spillway and the Linyati River, and into the Mababe Depression by way of the Khwai River. The Mababe Depression may also be flooded from the Zambezi River via the Savuti River. Some water also moves down the Boteti River toward the Makgadikgadi Depression, although this has not flooded in recent years. The Limpopo River forms part of the boundary with South Africa. Botswanian territory covers a minute part (4 km) of the Upper Zambezi River channel.
2.3 Reservoirs (after West, 1986)
Apart from the three natural lakes mentioned above, three dams have been constructed in Botswana. These are the Shashe Dam on the Shashe River, the Mopipi Dam on the Lower Boteti River and the Gaborone Dam on the Notswane River. These dams, which were constructed mainly for irrigation and cattle watering purposes, now support some fishing, being close to good marketing outlets at Francistown and Gaborone.
The potential yield from Shashe Dam is estimated at over 50 t/yr; that of Mopipi Dam at over 100 t/yr; and Gaborone Dam at 17 t/yr. However, there is very little fishing being carried out on these man-made water bodies at present.
2.4 Coastal Lagoons
None; Botswana is landlocked.
3. FISHERY PRODUCTION/POTENTIAL
3.1 Aquaculture
There is no aquaculture in Botswana (Vincke, 1989, pers.comm.)
3.2 Fish Production and per caput supply
Table 1. FISH PRODUCTION AND PER CAPUT SUPPLY - Botswana, 1970–1987
| Nominal Domestic Production (excluding exports) (t) 2 | Nominal Consumer Supply (exluding imports and exports (kg/person) | ||||||
| Year | Population '000 1 | Inland capture | No aquaculture | Total | Inland capture | No aquaculture | Total |
| 1970 | 623 | 800 | 800 | 1.3 | 1.3 | ||
| 1971 | 647 | 1 100 | 1 100 | 1.7 | 1.7 | ||
| 1972 | 673 | 1 200 | 1 200 | 1.8 | 1.8 | ||
| 1973 | 699 | 1 200 | 1 200 | 1.7 | 1.7 | ||
| 1974 | 727 | 1 200 | 1 200 | 1.6 | 1.6 | ||
| 1975 | 755 | 1 200 | 1 200 | 1.6 | 1.6 | ||
| 1976 | 785 | 1 600 | 1 600 | 2.0 | 2.0 | ||
| 1977 | 815 | 1 500 | 1 500 | 1.8 | 1.8 | ||
| 1978 | 847 | 1 000 | 1 000 | 1.2 | 1.2 | ||
| 1979 | 880 | 1 000 | 1 000 | 1.1 | 1.1 | ||
| 1980 | 915 | 1 250 | 1 250 | 1.4 | 1.4 | ||
| 1981 | 951 | 1 450 | 1 450 | 1.5 | 1.5 | ||
| 1982 | 987 | 1 400 | 1 400 | 1.4 | 1.4 | ||
| 1983 | 1 026 | 1 250 | 1 250 | 1.2 | 1.2 | ||
| 1984 | 1 066 | 1 500 | 1 500 | 1.4 | 1.4 | ||
| 1985 | 1 107 | 1 500 | 1 500 | 1.3 | 1.3 | ||
| 1986 | 1 149 | 1 700 | 1 700 | 1.5 | 1.5 | ||
| 1987 | 1 192 | 1 900 | 1 900 | 1.6 | 1.6 | ||
1 Source: FAO
2 Source: FAO Fisheries Depart., FISHDAB
3.3 Inland catch range and potential yield
Table 2. INLAND CATCH RANGE AND POTENTIAL YIELD
| Period | Annual catch range (t) 1 | Potential annual yield (t) 1 | |
| Lake Ngami | 1977–81 | 800-300 2 | 1 000–3 000 2 |
| Limpopo River | - | - | - |
| Zambezi River | - | - | - |
| Okavango Swamp | 1977 | 400 2 | 8 000 2 |
| Gaborone Reservoir | - | - | 17 |
| Lake Liamberi | 1980's | 180 2 | 250 2 |
| Lake Xau | - | - | |
| Mopipi Reservoir | - | - | 100 |
| Lower Boteti River | - | - | |
| Sheshe Reservoir | - | - | 50 |
1 Sources: see text
2 Catch and potential yield depend on drought situation
| Total Annual Yield: | (depending on drought situation) |
| 1 200–1 750 t (average about 1 600 t) (West, 1986) | |
| Potential Annual Yield: | (depending on drought situation) |
| 8 000–10 000 t (NORAD, 1987) | |
| 10 000–15 000 t (West, 1986) |
4. STATE OF THE FISHERY (after West, 1986)
4.1 Yield
Botswana has two large and important national waterways: the Okavango Delta and the Chobe River system. These, together with their associated rivers and lakes mentioned in Section 2, constitute the main fishing grounds and are said to have considerable fishery resources which could contribute much more to the country's food supply and general economic well-being than they do at present. According to recent estimates these waters have a potential to yield some 10–15 000 tons of fish annually. However, these resources are unevenly distributed and do not coincide with the densely populated areas of the country. In fact, the main water bodies mentioned above are concentrated in the northern sector of the country, which is relatively sparsely populated compared to the more densely populated eastern and southern areas.
4.2 Factors influencing yield
The high potential yield (10–15 000 t) can be depressed considerably by poor hydrological conditions.
The Okavango Delta is tsetse infested and has dense growths of vegetation which render the area unattractive to human habitation. It constitutes the bird sanctuary and game reserve. Compared to other African floodplains, the Okavango has low productivity.
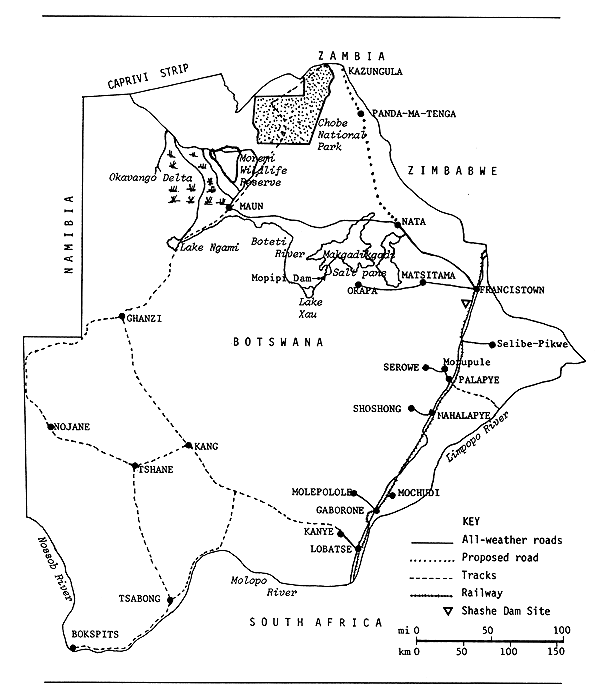
Fig. 1. MAP OF BOTSWANA
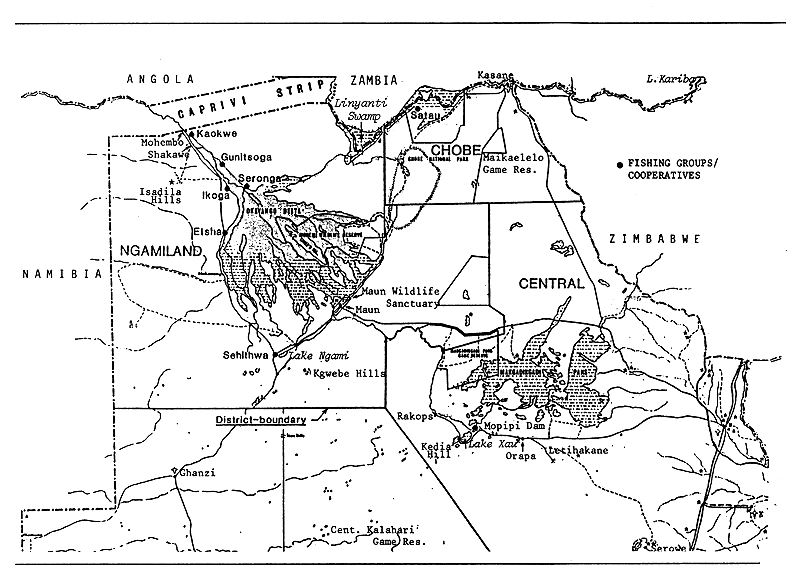
Fig. 2. LAKES, SWAMPS AND RIVERS IN NORTHERN BOTSWANA
(NORAD, 1985)
4.3 Future development possibilities
Despite the high potential yield figure quoted above, the present production of 1 200–1 750 t/yr (annual average about 1 600 t) is small, thus leaving ample room for increasing both output and benefits from the resources.
Until fairly recently fishing was mainly at the subsistence level, by fishermen scattered in remote communities, mainly in the Okavango swamps and the Chobe districts, using rudimentary fishing gear and traditional wooden canoes called “Mokoros”. The fishery has, however, progressed appreciably in the past two decades. Commercial fishing is now developing, not only on the lakes, but also on the main rivers (Boteti and Boro) and even in the remote areas of the Okavango.
5. KEY BIBLIOGRAPHY
NORAD, 1985
6. WATER BODIES DIRECTORY
| Lakes | ||
| Liamberi/Linyanti Swamp | Ngami | Xau |
| Rivers | ||
| Limpopo | Okavango/Cubango | Zambezi |
| Floodplains/Swamps | ||
| Okavango Swamp/Delta | ||
| Reservoirs | ||
| Gaborone | Mopipi | Shashe |
LAKE LIAMBERI/LINYANTI SWAMP
(International water)
| Geographical data (see Fig. 2) | |
| Location: | Botswana, Namibia -18°S; 24°20'E |
| Surface area: | 101 km2 (non-drought periods) (NORAD, 1985) Surface area very variable depending on annual flood inflow volume in any particular year; may dry out. Very little of its surface area lies in Botswana. |
| Inflowing river: | Linyanti/Chobe |
| Outflowing river: | Linyanti/Chobe |
| Fisheries data | |
| No. of fish species: | 43 (NORAD, 1985) |
| Total annual catch: | -about 800 t in the 1960's and early 1970's, most of it marketed in Zambia and Zimbabwe; -no production in the late 1970's; -about 180 t in the early 1980's (NORAD, 1985) |
| Potential annual yield: | |
| For 101 km2 open water: 250 t (25 kg/ha/yr: NORAD, 1985) | |
LAKE NGAMI
| Geographical data (see Fig. 2) | |
| Location: | Botswana - 20°28'S; 22°48'E |
| Surface area: | very variable, depending on annual flood inflow volume in a particular year. Can reach about 200 km2. Remained dry for many years prior to 1951 and was again dry in 1973–74 and in 1982 (1 km2 at the end of 1982). |
| Depth: | 1 m (mean, at max. level) |
| Max. length: | 55 km |
| Max. width: | 15 km |
| Outflowing river: | Thamalakhane (tributary of Okavango/Cubango River) |
| Fisheries data | |
| Total annual catch: | 800 t in 1977; |
| 300 t before lake dried out in 1982 (NORAD, 1985) | |
| Potential annual yield: | 1 000–3 000 t when full (NORAD, 1985) |
LAKE XAU
| Geographical data | (see Fig. 2) |
| Location: | Botswana - 21°20'S; 24°45'E |
| Surface area: | small, non-permanent lake. Surface area depends on annual flood inflow volume in a particular year. |
| Inflowing/Outflowing river: Boteti | |
| Fisheries data | |
| Potential annual yield: 100 t - including Lake Xau, Mopipi Dam and Lower Boteti | |
| River (NORAD, 1985) | |
LIMPOPO RIVER
(International water)
| Geographical data (Welcomme, 1972) | |
| Source: | Witwatersrand, South Africa |
| Altitude: | 1 732 m |
| Total length: | 1 680 km |
| Drainage area: | 358 000 km2 total (77 700 km2 in Botswana) |
| Countries traversed: | Botswana, Zimbabwe, Mozambique, South Africa |
| Major tributaries: | Elefantes/Olifants, Nuanetsi, Umzingwani, Shashi, Changari |
| Discharges to: | Indian Ocean - 25°12'S; 33°31'E |
| Volume of discharge at mouth: 5.33 km3 | |
| Special features: | numerous dams/reservoirs on tributaries, including Massingir (151 km2) floodplain along lower course with numerous lakes. In Botswana the Limpopo is impounded at Gaborone. |
OKAVANGO/CUBANGO RIVER
(International water)
| Geographical data | |
| Source: | Bie Plateau, Angola |
| Total length: | 2 560 km |
| Countries traversed: | Angola, Botswana, Namibia |
| Major tributaries: | Cuito |
| Discharges to: | The mouth of the Okavango splits into three main arms to form an internal delta which discharges into the Okavango Swamps. A further branch, the Thamalkane River, is connected to Lake Xau. A reversible and periodic connection exists between the Okavango and the Kwando and Zambezi system. During the floods the Okavango sends surplus water to the Kwando (or Chobe) River which, in turn, joins the Zambezi. If the Zambezi floods arise early, however, the process may be reversed. |
| Volume of discharge at mouth: 254 m3/sec | |
ZAMBEZI RIVER
(International water)
| Geographical data | |
| Source: | northwest Zambia and eastern Angola |
| Altitude: | 1 600 m |
| Total length: | 2 574 km (Botswana possesses only about 4 km of the south bank of the Upper Zambezi) |
| Drainage area: | 1 300 000 km2 |
| Countries traversed: | Angola, Mozambique, Zambia, Botswana, Namibia, Zimbabwe |
| Major tributaries: | Cuando, Kafue, Luangwa, Shire. The Zambezi system also communicates with the Okavango system via the Chobe River. |
| Discharges to: | Indian Ocean - 18°47'S; 36°E |
| Volume of discharge at mouth: 7 070 m3/sec | |
| Flood regime: | December to July, maximum in March |
| Special features: | Barotse floodplain, 700–9 000 km; Kafue flats, 200–7 000 km2; Lukanga swamps, Kariba and Cahora Bassa dams/reservoirs, 3 000–8 000 km2. |
Physical and chemical data (Coche, 1968)
| Flood | Low water | |||
| Temperature: | 30°C | 17°C | ||
| Conductivity: | K20 50 μS/cm | 96 μS/cm | ||
| pH: | - | 7.4 | ||
| Total alkalinity: | 20 mg/l | 44 mg/l | ||
| Total hardness: | 17.9 mg/l | 38.1 mg/l | ||
| Ionic composition: | ||||
| mg/l | mg/l | |||
| Na | 1.70 | 3.26 | ||
| K | - | 0.88 | ||
| Ca | 4 93 | - | ||
| Mg | 1.47 | 3.86 | ||
| NO2-N | 0.00376 | 0.00024 | ||
| NO3-N | 0 0047 | 0.0158 | ||
| PO4-P | 0.0295 | 0.0078 | ||
| Fisheries data | ||||
| No. of fish species: Upper Zambezi: 49 (Jubb, 1961) | ||||
OKAVANGO SWAMP/DELTA
| Geographical data | |
| Location: | northern Botswana - 18°20'–20°30'S; 21°40'–23°50'E |
| Area: | up to 20 000 km2 during flooding (May-August) (Welcomme, 1972) 10 000 km2 mean area (NORAD, 1985) |
| Major inflowing river: | Okavango/Cubango |
| Special features: | landlocked basin with no outflow normally. Includes Lake Ngami. |
| Fisheries data | |
| No. of fish species: | 80; 50–60% tilapias (mainly Oreochromis andersoni and ex-Tilapia melanopleura); Hydrocynus vittatus; Labeo lunatus |
| No. of fishermen: | 500 in 1984/85 (NORAD, 1985) |
| Total annual catch: | 400 t in 1977 (excluding Lake Ngami) |
| 500 t in 1984/85 (NORAD, 1985) | |
| Potential annual yield: | 8 000 t (NORAD, 1985) |
| Specific reference: | Mepham, 1987b |
GABORONE RESERVOIR
| Geographical data | |
| Location: | Botswana |
| Surface area: | 20.23 km2 at USL |
| Major inflowing river: | Limpopo |
| Outflowing river: | Limpopo |
| Fisheries data | |
| Potential annual yield: | 17 t (West, 1986) |
MOPIPI RESERVOIR
| Geographical data | |
| Location: | Botswana |
| Major inflowing river: | Lower Boteti River |
| Outflowing river: | Lower Boteti River |
| Fisheries data | |
| Potential annual yield: 100 t (West, 1986) | |
SHASHE RESERVOIR
| Geographical data | |
| Location: | Botswana |
| Major inflowing river: | Shashe |
| Outflowing river: | Shashe |
| Fisheries data | |
| Potential annual yield: | 50 t (West, 1986) |
7. BIBLIOGRAPHY
Coche, 1968
Jubb, 1961
Mepham, 1987b
NORAD, 1985; 1987
Welcomme, 1972; 1979a
West, 1986
![]()
![]()