![]()
![]()
![]()
This chapter describes the fuelwood productivity model. The model is schematically shown in Figure 7.1, and is structured along the lines of the crop suitability model1 of the FAO Agro-ecological Zones Project (FAO 1978–81). It is applied within the framework of land evaluation guidelines for forestry (FAO 1984c). It comprises of the following activities:
Selection of tree species and definition of land utilization types (LUTs) (e.g. species; technology and input level; labour; capital; markets).
Determination of climatic requirements of species and LUTs and matching climatic requirements with the characteristics of the inventoried climatic zones (thermal zones and growing period zones), and quantifying the climatically attainable yield potentials.
Determination of edaphic (soil) requirements of species and LUTs, and matching edaphic requirements with the characteristics of the inventoried soil units, textures, phases and stoniness to rate edaphic limitations.
Quantifying soil erosion hazards (topsoil loss) in each climate-soil unit of the land resources inventory by LUT and the associated productivity losses.
Modifying the climatic yield potentials (in ii) according to soil limitations (in iii) and erosion hazards (iv) to quantify yield potentials and ecological land suitabilities of each inventoried climatic-soil land unit for each LUT.
The model operates on the land resources database described in Chapter 3. Each of the above activities are described in the following sections.
A total of 31 species are included in the model. They are listed in Table 7.1 together, with information on height, coppicing ability, nitrogen fixing ability, density, calorific value and utilization.
FIGURE 7.1
Schematic presentation of fuelwood productivity model
TABLE 7.1
Fuelwood species characteristics
| Species | Mature height (m) | Coppicing ability | N-fixer | Density (gm/cm3) | Calorific value (Kcal/kg) | Utilization |
| Acacia albida | 20–30 |  | Fo | |||
| Acacia gerradii | 10–16 | | Fo | |||
| Acacia nilotica | 15–20 | + + | | 0.65–0.70 | 4800–4950 | C,Fo,G,Ho,S |
| Acacia senegal | 2–6 | + + | | C,Fo,G,T | ||
| Acacia tortilis | 4–10 | | Fo | |||
| Bridelia micrantha | 8–15 | C,T | ||||
| Calliandra calothyrsus | 8–12 | + + | | 0.50–0.80 | 4500 | Fo,Ho,M,Or |
| Calodendrum capense | 10–20 | C,Or,T | ||||
| Cassia siamea | 15–20 | + + | 0.60–0.80 | 4500–4600 | C,D,Fo*,H,M,Or,S,T,Wb | |
| Casuarina equisetifolia | 25–30 | + | | 0.80–1.20 | 4950 | C,D,Fo,P,T,Wb |
| Casuarina cunninghamiana | 25–30 | | C | |||
| Conocarpus lancifolius | 15–18 | | 0.81 | C,Fo,T | ||
| Croton megalocarpus | 16–25 | | C,T | |||
| Cupressus lucitanica | 26–30 | 0.45–0.48 | - | |||
| Eucalyptus camaldulensis | 30–40 | + + | 0.56–0.85 | 4800 | C,Fo,H,Ho,Or,P,S,T,Wb | |
| Eucalyptus citriodora | 30–40 | + | 0.65–1.10 | 4760 | C,Fo,Ho,O,P.T | |
| Eucalyptus globulus | 40–50 | + + | 0.55–0.78 | C,P,PI,T | ||
| Eucalyptus grandis | 40–55 | + + | 0.48–0.64 | C,P,PI,T | ||
| Eucalyptus microcorys | 25–30 | + + | 0.90–0.99 | T | ||
| Eucalyptus microtheca | 10–20 | + | 0.75–0.85 | C,T | ||
| Eucalyptus saligna | 35–45 | + + | 0.48–0.64 | C,O,P,PI,T | ||
| Eucalyptus tereticornis | 36–46 | + + | 0.65–1.05 | 4800 | C,Fo,Ho,O,P,PI,S,Sb,T | |
| Faurea saligna | 5–10 | C,Ho,T | ||||
| Gliricidia sepium | 5–15 | + + | | 0.40–0.65 | 4900 | C,Fb,Fo*,Ho,M,Or,S,T |
| Grevillea robusta | 25–35 | | 0.54–0.66 | C,PI,T | ||
| Leucaena leucocephala | 10–20 | + + | | 0.50–0.70 | 4200–4600 | C,Fo*,M,Or,P,S,T |
| Oleo africana | 3–6 | C,Fr,T | ||||
| Parkinsonia aculeate | 4–5 | + + | Fo,Wb | |||
| Prunus africanum | 26–30 | T | ||||
| Sesbania sesban | 4–8 | + + | | 0.40–0.50 | 4500–4600 | Fo |
| Tamarindus indica | 20–30 | | C,T |
Sources: CM. Ndegwa, Project GCP/KEN/051/AUL, ‘Fuelwood afforestation and extension in Baringo’, pers. comm. 1988; Davidson 1985; Teel 1984; Skerman 1982; Goehl 1981; Webb, Wood and Smith 1980; FAO 1981.
Coppicing ability: + + = good;
+ = fair; no entry indicates poor or none.
Utilization: C = charcoal;
D = dye;
Fb = firebreak;
Fo = fodder;
Fo* = fodder (but potentially toxic);
Fr = fruit;
G = gum;
H = hedge;
Ho = honey;
M = green manure;
O = oil;
Or = ornamental;
P = pulp (wood);
PI = plywood, board, etc.;
S = shade;
Sb = shelterbelt;
T = timber, etc.;
Wb = windbreak.
Each tree species is considered for fuelwood production at three levels of inputs circumstances (low,intermediate and high). The attributes of the three input level production circumstances are listed in Table 7.2, and they form the basis of the definition of the land utilization types.
Understanding the relationships between the climatic environment and ecophysiological processes of growth, development and yield in trees forms the basis of formulating quantitative descriptions of the climatic adaptability of improved and unimproved provenances and their productivity potentials in land use. Principles of climatic adaptability for plants are described in Kassam, Kowal and Sarraf (1977) and (FAO 1978–81).
Photosynthesis produces the source of assimilates which plants use for growth, and the rate of photosynthesis is influenced by both temperature and radiation. However, plants are also obliged to undergo sequences of phenological and morphological developments in time and space to allow photosynthetic assimilates to be converted into growth of plant parts and economically usefull yields of satisfactory quantity and quality. The development sequence of tree growth in relation to the calendar (i.e. tree phenology) is influenced by climatic factors.
TABLE 7.2
Attributes of LUTs considered for fuelwood production
| Attribute | Low inputs | Intermediate inputs | High inputs |
| Produce and production | Rainfed production of fuelwood tree species for firewood or charcoal | ||
| Market orientation | Subsistence production | Subsistence production plus commercial sale of surplus | Commercial production |
| Capital intensity | Low | Intermediate, with credit on accessible terms | High |
| Labour intensity | High, including uncosted family labour | Medium, including uncosted family labour | Low, family labour costed if used |
| Power source | Manual labour with hand tools | Manual labour with handtools, some mechanization | Complete mechanization, including harvesting |
| Technology | Local provenances; no agro-chemicals; minimum conservation measures | Improved provenances as available; appropriate extension packages, including some fertilizer application and pest and disease control; some conservation measures | High yielding provenances; optimum fertilizer use; chemical pest and disease control; full conservation measures |
| Infrastructure | Market access not necessary; inadequate advisory services | Some market accessibility necessary, with access to nurseries, demonstration plots and advisory services | Market access essential; high level of nursery and advisory services; application of research findings |
| Land holding | Small, fragmented | Small, sometimes fragmented | Large, consolidated |
| Income level | Low | Moderate | High |
In general, temperature determines the rate of growth and development of plant parts and the tree as a whole. However, in some tree species, temperature may also determine whether a particular development process will begin or not (e.g., chilling requirement for bud formation and floral initiation), the time when bud break will occur, the subsequent rate of development and the time when the process will stop (Cannell and Last 1976).
In the seasonally dry climates of Kenya, ability to survive the dry period is an important adaptability characteristic just as frost hardiness is for survival in the cooler thermal zones at higher altitudes.
Accordingly, in assessments of land suitabilities, consideration has to be given to the specific climatic requirements and adaptability for survival, growth and development.
All the fuelwood species listed in Table 7.1 have C3 photosynthesis pathway and are classified into two adaptability groups (Table 7.3). Group I species are adapted to operate in cooler conditions (mean temperatures 10–20 °C), whereas Group II species are adapted to operate in warmer conditions (mean temperatures 20–30 °C). Both groups have species with nitrogen fixing capability.
TABLE 7.3
Adaptability groups for fuelwood species
| Characteristics | Group I (<20°C) | Group II (>20°) | ||
| Photosynthetic pathway | C3 | C3 | ||
| Rate of maximum photosynthesis (Pmax,/sub>) (Kg CH2O/ha/hr) | 5–30 | 5–30 | ||
| Optimum temperature (mean) for Pmax (°C) | 15–20 | 20–30 | ||
| Productivity class A (Pmax = 5–10 kg CH2O/ha/hr) | Acacia gerrardii | (N) | Acacia albida | (N) |
| Croton megalocarpus | (N) | Acacia nilotica | (N) | |
| Grevillea robusta | (N) | Acacia tortilis | (N) | |
| Oleo africana | Calliandra calothyrus | (N) | ||
| Conocarpus lancifolius | (N) | |||
| Gliricidia sepium | (N) | |||
| Tamarindus indica | (N) | |||
| Productivity class B (Pmax = 10–20 kg CH2O/ha/hr) | Bridella micrantha | Bridella micrantha | ||
| Calodendrum capense | Cassia siamea | |||
| Casuarina cunninghamiana | (N) | Casuarina equisetifolia | (N) | |
| Cupressus lucitanica | Eucalyptus citriodora | |||
| Eucalyptus microcorys | Eucalyptus microtheca | |||
| Faurea saligna | Eucalyptus tereticornis | |||
| Prunus africanum | Parkinsonia aculeata | |||
| Productivity class C (Pmax = 20–30 kg CH2O/ha/hr) | Eucalyptus globulus | Eucalyptus camaldulensis | ||
| Eucalyptus saligna | Eucalyptus grandis | |||
| Sesbania sesban | (N) | Eucalyptus saligna | ||
| Leucaena leucocephala | (N) | |||
| Sesbania sesban | (N) |
Rates of maximum photosynthesis (Pm) for both adaptability groups are in the range 5–30 kg CH2O ha-1 hr-1 (Landsberg 1986). Species in each adaptability group are therefore further classified into three photosynthesis productivity classes. They are class A, Pm = 5–10 kg CH2O ha-1 hr1; class B, Pm = 10–20 kg CH2O ha-1 hr-1 : and class C, Pm = 20–30 kg CH2O ha-1 hr-1. These photosynthesis rates of productivity class A, B, and C correspond to mean annual total (including foliage, stem and roots) biomass increments of 12.5–25.0, 25.0–40.0 and 40.0–60,0 t/ha dry weight respectively or annual wood biomass (stem and branch wood) increments of 8.0–15.0, 15.0–25.0 and 25.0–40.0 t/ha dry weight respectively. The relationships between photosynthesis and temperature for these six adaptability classes are presented in Table 7.4.
Rotation length in the model is taken as the age at ‘maximum yield’, and is the point when annual increment is equal to mean annual increment over the total period since establishment (Nilsson 1983).
| Adaptability class | Temperature (°C) | |||||||
| 5 | 10 | 15 | 20 | 25 | 30 | 35 | 40 | |
| I - A | 0.75 | 3.0 | 6.0 | 7.5 | 7.5 | 6.0 | 3.0 | 1.5 |
| I - B | 1.5 | 6.0 | 12.0 | 15.0 | 15.0 | 12.0 | 6.0 | 3.0 |
| I - C | 2.5 | 10.0 | 20.0 | 25.0 | 25.0 | 20.0 | 10.0 | 5.0 |
| II - A | - | 0.75 | 4.0 | 6.0 | 6.0 | 7.5 | 6.0 | 4.0 |
| II - B | - | 1.5 | 8.0 | 12.0 | 12.0 | 25.0 | 12.0 | 8.0 |
| II - C | - | 2.5 | 15.0 | 20.0 | 20.0 | 25.0 | 20.0 | 15.0 |
TABLE 7.5
Rotation length (years) by moisture zones
| Photosynthetic productivity class | Semi-arid 60–119 days | Dry Sub-humid 120–179 days | Moist Sub-humid 180–269 days | Humid > 270 days |
| A | 15.0–17.5 | 12.5–15.0 | 10.0–12.5 | 7.5–10.0 |
| B | 12.5–15.0 | 10.0–12.5 | 7.5–10.0 | 5.0–7.5 |
| C | 10.0–12.5 | 7.5–10.0 | 5.0–7.5 | < 5.0 |
Rotation length is affected by the photosynthesis productivity class of the species and by length of growing period. Rotation lengths applied in the model are given in Table 7.5.
Thermal zone ratings for each of the species are given in Table 7.6. Five suitability classes are employed (i.e., S1, very suitable; S2, suitable; S3, moderately suitable; S4, marginally suitable; and N, not suitable), and the ratings apply to production at all the three levels of inputs.
A rating of S1 indicates that the temperature conditions for tree growth and development are optimal, and that it is possible to achieve the maximum attainable silvicultural yield potential provided there are no moisture or soil-landform limitations. A rating of S2 indicates that there are moderate temperature constraints to growth and development, and that there would be a suppression of yield potential of the order of 25%. A rating of S2 indicates that there are moderate to severe temperature constraints, and that there would be a yield suppression of the order of 50%. A rating of S4 indicates that yield suppression of the order of 75%. A rating of N indicates that temperature conditions are not suitable for production.
Growing period zones which have been considered for yield assessments for each species are shown in Table 7.7 which represents a moisture screen. Table 7.7 is based on the actual research information obtained from local experiments and permanent sample plots.
Ecophysiological models have not been widely applied in the estimation of stand and site productivity potentials. A useful description of the state-of-the art is given in Landsberg (1986). Potential attainable yields (total and wood biomass) were derived according to the method developed by the FAO-AEZ Project (Kassam 1977; FAO 1978–81), and modified to take into account the generally accepted fact that for fuelwood tree species, total biomass yield at 50% of rotation length is 38% of the standing total biomass yield at 100% rotation length (Nilsson 1983).
TABLE 7.6
Thermal zone suitability ratings for fuelwood species
| Species | T1 >25° | T2 22.5–25.0° | T3 20.0–22.5° | T4 17.5–20.0° | T5 15.0–17.6° | T6 12.5–15.0° | T7 10.0–12.5° | T8 5.0–10.0° | T9 <5.0° |
| Acacia albida | S1 | S1 | S1 | S3 | S4 | N | N | N | N |
| Acacia gerradii | S4 | S3 | S1 | S1 | S1 | S1 | S3 | N | N |
| Acacia nilotica | S1 | S1 | S1 | S1 | S3 | N | N | N | N |
| Acacia Senegal | S1 | S1 | S1 | S3 | S4 | N | N | N | N |
| Acacia tortilis | S1 | S1 | S1 | S3 | S4 | N | N | N | N |
| Bridelia micrantha | S1 | S1 | S1 | S1 | S1 | S1 | S3 | N | N |
| Calliandra calothyrsus | S1 | S1 | S1 | S3 | S4 | N | N | N | N |
| Celodendrum capense | S4 | S3 | S1 | S1 | S1 | S1 | S3 | N | N |
| Cassia siamea | S1 | S1 | S1 | S3 | S4 | N | N | N | N |
| Casuarina equisetifolia | S1 | S1 | S1 | S1 | S3 | N | N | N | N |
| Casuarina cunninghamiana | S4 | S3 | S1 | S1 | S1 | S1 | S3 | N | N |
| Conocarpus lancifolius | S1 | S3 | S4 | N | N | N | N | N | N |
| Croton megalocarpus | S4 | S3 | S1 | S1 | S1 | S1 | S3 | N | N |
| Cupressus lucitanica | N | S4 | S3 | S1 | S1 | S1 | S3 | N | N |
| Eucalyptus camaldulensis | S1 | S1 | S1 | S3 | N | N | N | N | N |
| Eucalyptus citriodora | S1 | S1 | S1 | S1 | S3 | N | N | N | N |
| Eucalyptus globulus | S4 | S3 | S1 | S1 | S1 | S3 | N | N | N |
| Eucalyptus grandis | S1 | S1 | S1 | S1 | S3 | N | N | N | N |
| Eucalyptus microcorys | S4 | S3 | S1 | S1 | S1 | S1 | S3 | N | N |
| Eucalyptus microtheca | S1 | S1 | S1 | S3 | N | N | N | N | N |
| Eucalyptus saligna | S1 | S1 | S1 | S1 | S1 | S1 | S3 | N | N |
| Eucalyptus tereticornis | S1 | S1 | S1 | S1 | S3 | N | N | N | N |
| Faurea saligna | S4 | S3 | S1 | S1 | S1 | S1 | S2 | N | N |
| Gliricidia sepium | S1 | S1 | S1 | S1 | S3 | N | N | N | N |
| Grevillea robusta | S4 | S3 | S1 | S1 | S1 | S1 | S2 | N | N |
| Leucaena leucocephala | S1 | S1 | S1 | S3 | S4 | N | N | N | N |
| Oleo africana | N | S4 | S3 | S1 | S1 | S1 | S3 | N | N |
| Parkinsonia aculeate | S1 | S1 | S1 | S3 | S4 | N | N | N | N |
| Prunus africanum | N | S4 | S1 | S1 | S1 | S1 | S3 | N | N |
| Sesbania sesban | S1 | S1 | S1 | S1 | S1 | S1 | S3 | N | N |
| Tamarindus indica | S1 | S1 | S1 | S3 | S4 | N | N | N | N |
It is assumed that wood biomass (stem wood and branch wood) is 0.6 of total biomass, foliage biomass 0.2 and root biomass 0.2. Partitioning of total wood biomass into main stem and branch wood biomass is assumed to be in the ratio of 0.8 and 0.2. Leaf area index at maximum annual growth rate is assumed to be 5 or more, and the period of annual growth is equal to the inventoried lengths of growing period. These reference model variables can be modified as appropriate to take into account differences between species and environmental conditions.
Total biomass productivity estimates (Bm) in terms of mean annual increments (t/ha dry weight) are given in the Appendix in Table A7.1 for high level of inputs by length of growing period for species with and without nitrogen fixing ability for the three photosynthesis productivity classes. For the low level of inputs circumstance, site yield potentials are assumed to be 50 % of those at the high level. At intermediate level of inputs, yield potentials are assumed to be half-way between the low and the high levels of inputs. Total biomass productivity for intermediate and low levels of inputs are given in the Appendix in Tables A7.2 and A7.3 respectively.
TABLE 7.7
Moisture screen for fuelwood species
| Species | Length of Growing Period (LGP) (Days) | ||||||||||||||
| 0 | 1–29 | 30–59 | 60–89 | 90–119 | 120–149 | 150–179 | 180–209 | 210–239 | 240–269 | 270–299 | 300–329 | 330–364 | 365- | 365 + | |
| Acacia albida | • | • | • | • | • | • | • | ||||||||
| Acacia gerradii | • | • | • | • | • | • | • | ||||||||
| Acacia nilotica | • | • | • | • | • | • | • | • | |||||||
| Acacia Senegal | • | • | • | • | • | • | • | ||||||||
| Acacia tortilis | • | • | • | • | • | • | • | • | |||||||
| Bridelia micrantha | • | • | • | • | • | • | • | • | • | • | |||||
| Calliandra calothyrsus | • | • | • | • | • | • | • | • | |||||||
| Calodendrum capense | • | • | • | • | • | • | • | • | • | ||||||
| Cassia siamea | • | • | • | • | • | • | • | ||||||||
| Casuarina equisetifolia | • | • | • | • | • | • | • | ||||||||
| Casuarina cunninghamiana | • | • | • | • | • | • | • | • | • | • | |||||
| Conocarpus lancifolius | • | • | • | • | • | • | • | • | |||||||
| Croton megalocarpus | • | • | • | • | • | • | |||||||||
| Cupressus lucitanica | • | • | • | • | • | ||||||||||
| Eucalyptus camaldulensis | • | • | • | • | • | • | |||||||||
| Eucalyptus citriodora | • | • | • | • | • | • | |||||||||
| Eucalyptus globulus | • | • | • | • | • | • | |||||||||
| Eucalyptus grandis | • | • | • | • | • | • | • | • | |||||||
| Eucalyptus microcorys | • | • | • | • | • | ||||||||||
| Eucalyptus microtheca | • | • | • | • | • | • | • | • | |||||||
| Eucalyptus seligna | • | • | • | • | • | • | • | • | • | ||||||
| Eucalyptus tereticornis | • | • | • | • | |||||||||||
| Faurea saligna | • | • | • | • | • | • | • | • | • | • | |||||
| Gliricidia sepium | • | • | • | • | • | • | • | • | • | ||||||
| Grevillea robusta | • | • | • | • | • | • | • | • | • | • | |||||
| Leucaena leucocephala | • | • | • | • | • | • | • | • | • | • | |||||
| Oleo africana | • | • | • | • | • | • | |||||||||
| Parkinsonia aculeate | • | • | • | • | • | ||||||||||
| Prunus africanum | • | • | • | • | • | • | • | • | • | ||||||
| Sesbania sesban | • | • | • | • | • | • | • | • | • | • | |||||
| Tamarindus indica | • | • | • | • | • | • | • | • | |||||||
Wood biomass yield estimates (Bw) in terms of mean annual increments (t/ha dry weight) are given in the Appendix in Tables A7.4, A7.5 and A7.6 respectively for high, intermediate and low levels inputs circumstances. Wood biomass estimates in Tables A7.4, A7.S and A7.6 apply in the growing period zones allowable by the moisture screen in Table 7.7.
All tree species are matched to total lengths of L1,13 and L4. Yields in Tables A7.1 to A7.6 apply to years with normal length of growing period, i.e. growing period with a humid period during which precipitation is greater that potential evapotranspiration. For years with intermediate growing periods, i.e. growing periods with no humid period, full water requirements cannot be met and yield reductions are assumed to be of the order of 50% on all soils except Fluvisols and Gleysols. The percentage of occurrence of intermediate lengths of growing periods in all LGP-Pattern zones is 100% in LGP zone 1–29 days; 65% in LGP zone 30–59 days; 25% in LGP zone 60–89 days; 10% in LGP zone 90–119 days; and 5% in LGP zone 120–149 days.
At this stage in the model development, it has not been possible to take into account in the climatic suitability assessment other climatically driven constraints such as pest and diseases and workability, which may reduce yield. It should be possible to take such constraints into account in the future as the information and research base for fuelwood production improves.
An exception to the general methodology for climatic suitability assessment applies to areas occupied by Fluvisols because the length of growing period does not fully reflect their particular circumstance with regards to moisture regime. Fluvisols ratings are presented in Technical Annex 6 for the three levels of inputs circumstances.
In order to assess soil suitability for fuelwood production, the soil requirements of tree species must be determined. Further, these requirements must be understood within the context of limitation imposed by landform and other features (e.g. soil phases) which do not form part of soil composition but have a significant influence on the use that can be of the soil.
Basic soil requirements for fuelwood tree species relate to soil properties (described in Section 5.1.3.2).
From the basic soil requirements for forestry land use, a number of responses related to soil characteristics have been derived for the fuelwood species.
The correlation between the basic soil requirements listed in Section 5.1.3.2 and soil characteristics given in Table 5.9 has been used as soil factors to rate tree crop performance and soil requirements for fuelwood species are summarized in Table 7.8.
TABLE 7.8
Soil requirements of fuelwood species
| Species | Texture | Drainage | Soil depth (cm) | Reaction (pH) | Salinity (mmhos) | Flooding | ||||||
| optimum | range | optimum | range | optimum | marginal | optimum | range | optimum | marginal | optimum | marginal | |
| Acacia albida | SL-SC | LS-KS | W | MW-SE | >120 | 75–120 | 5.6–7.0 | 6.0–7.5 | <4 | 4–6 | F0 | F1 |
| Acacia gerradii | L-C | SL-KC | MW-W | I-SE | >120 | 75–120 | 5.5–7.0 | 6.0–7.5 | <4 | 4–6 | F1 | F2 |
| Acacia nilotica | L-C | SL-KC | W | MW-SE | >120 | 75–120 | 5.5–7.5 | 5.0–8.0 | <4 | 4–8 | F1 | F2 |
| Acacia Senegal | SL-SC | LS-KC | W | MW-SE | >120 | 75–120 | 5.5–7.0 | 5.0–7.5 | <4 | 4–6 | F0 | F1 |
| Acacia tortilis | SL-SC | LS-KC | W | MW-SE | >75 | 50–75 | 6.5–8.0 | 6.0–8.5 | <4 | 4–8 | F0 | F1 |
| Bridelia micrantha | SL-SC | LS-KC | W | MW-SE | >120 | 75–120 | 5.5–7.0 | 5.0–7.5 | <4 | 4–6 | F0 | F1 |
| Calliandra calothyrsus | SL-SC | LS-KC | W | MW-SE | >120 | 75–120 | 6.0–7.0 | 5.5–7.5 | <4 | 4–6 | F0 | F1 |
| Calodendrum capense | SL-SC | LS-KC | W | MW-SE | >120 | 75–120 | 5.5–7.0 | 5.0–7.5 | <4 | 4–6 | F0 | F1 |
| Cassia siamea | SL-CL | LS-SiC | W | MW-SE | >150 | 100–150 | 6.0–7.0 | 5.6–7.5 | <4 | 4–6 | F0 | F1 |
| Casuarina equisetifolia | SL-SiL | LS-CL | W | MW-SE | >120 | 75–120 | 6.5–8.0 | 6.0–8.5 | <12 | 12–16 | F1 | F2 |
| Casuarina cunninghamiana | SL-SC | LS-KC | W | MW-SE | >120 | 75–120 | 5.5–7.0 | 5.0–7.5 | <4 | 4–6 | F1 | F2 |
| Conocarpus lancifolius | SL-CL | LS-SC | MW-W | I-SE | >120 | 75–120 | 6.5–8.0 | 6.0–8.5 | <8 | 8–12 | F1 | F2 |
| Croton megalocarpus | SL-SC | LS-KC | W | MW-SE | >120 | 75–120 | 6.6–8.0 | 6.0–8.5 | <4 | 4–8 | F0 | F1 |
| Cupressus lucitanica | L-CL | SL-SC | W | MW-SE | >150 | 100–150 | 5.6–7.0 | 5.0–7.5 | <4 | 4–6 | F0 | F1 |
| Eucalyptus camaldulensis | SL-SC | LS-KC | MW-W | I-SE | >120 | 75–120 | 5.0–6.6 | 4.5–7.5 | <2 | 2–4 | F1 | F2 |
| Eucalyptus citriodora | SL-CL | LS-SiC | W | MW-SE | >150 | 100–150 | 5.5–7.0 | 5.0–7.5 | <4 | 4–6 | F0 | F1 |
| Eucalyptus globulus | L-C | SL-KC | W | MW-SE | >150 | 100–150 | 5.5–7.0 | 5.0–7.5 | <2 | 2–4 | F0 | F1 |
| Eucalyptus grandis | SL-CL | LS-SiC | W | MW-SE | >120 | 75–120 | 5.5–7.0 | 5.0–7.5 | <4 | 4–6 | F0 | F1 |
| Eucalyptus microcorys | L-CL | SL-SC | W | MW-SE | >120 | 75–120 | 5.5–7.5 | 6.0–8.0 | <4 | 4–8 | F1 | F2 |
| Eucalyptus microtheca | L-C | SL-KC | MW-W | I-SE | >120 | 75–120 | 6.5–8.0 | 6.0–8.5 | <4 | 4–8 | F1 | F2 |
| Eucalyptus saligna | SL-CL | LS-SiC | W | MW-SE | >120 | 75–120 | 5.5–7.0 | 5.0–7.5 | <4 | 4–6 | F0 | F1 |
| Eucalyptus tereticornis | SL-SC | LS-KC | W | MW-SE | >120 | 75–120 | 5.5–7.0 | 5.0–7.5 | <4 | 4–6 | F0 | F1 |
| Faurea saligna | SL-SC | LS-KC | W | MW-SE | >120 | 75–120 | 5.5–7.0 | 6.0–7.5 | <4 | 4–6 | F0 | F1 |
| Gliricidia sepium | SL-SC | LS-KC | W | MW-SE | >120 | 75–120 | 5.0–6.5 | 4.6–7.0 | <2 | 2–4 | F0 | F1 |
| Grevillea robusta | SL-CL | LS-SiC | W | MW-SE | >120 | 75–120 | 5.5–7.0 | 5.0–7.5 | <4 | 4–6 | F0 | F1 |
| Leucaena leucocephala | SL-SC | LS-KC | W | MW-SE | >75 | 50–75 | 5.5–7.0 | 5.5–8.5 | <8 | 8–12 | F0 | F0 |
| Oleo africana | SL-SC | LS-KC | W | MW-SE | >120 | 75–120 | 6.5–8.0 | 6.0–8.5 | <4 | 4–8 | F0 | F1 |
| Parkinsonia aculeata | SL-CL | LS-SiC | W | MW-SE | >120 | 75–120 | 6.6–8.0 | 6.0–8.5 | <8 | 8–12 | F0 | F1 |
| Prunus africanum | SL-SC | LS-KC | W | MW-SE | >120 | 75–120 | 5.6–7.0 | 5.0–7.5 | <4 | 4–6 | F0 | F1 |
| Sesbania sesban | SL-SC | LS-KC | MW-W | I-SE | >120 | 75–120 | 6.0–7.0 | 5.5–7.5 | <12 | 12–16 | F1 | F2 |
| Tamarindus indica | SL-SC | LS-KC | W | MW-SE | >120 | 75–120 | 6.5–7.5 | 5.0–7.5 | <4 | 4–6 | F0 | F1 |
Texture classes: LS = loamy sand;
SL = sandy loam;
SiL = silty loam;
L = loam;
CL = clay loam;
SC = sandy clay;
SIC = silty clay;
C = clay;
KC = kaolinitic clay.
Drainage classes: I = imperfectly;
MW = moderately well;
W = well;
SE = somewhat excessive.
Flooding classes: F0 = no flooding;
F1 = occasional floods;
F2 = frequent floods.
As exlained earlier the soil units (Table 3.16) have been defined in terms of measurable and observable properties of the soil itself; and specific clusters of such properties are combined into ‘diagnostic horizons’ and ‘diagnostic properties’. They are also used in rating soil suitability.
The edaphic suitability classification is input-specific and based on:
matching the soil requirements of fuelwood species with the soil conditions of the soil units described in the soil inventory (soil unit evaluation); and
modification of the soil unit evaluation by limitations imposed by texture, phase and slope conditions.
The soil unit evaluation for fuelwood species production is expressed in terms of ratings based on how far the soil conditions of a soil unit meet the growth and production requirements under a specified level of inputs. The appraisal is effected in five basic classes for each species and level of inputs, i.e. very suitable (S1), suitable (S2), moderately suitable (S3), marginally suitable (S4), and not suitable (N).
A rating of S1 indicates that the soil conditions are optimal, and that suppression of potential yields (if any) are assumed to be nil or slight. A rating of S2 indicates that there are slight to moderate soil constraints and there would be a suppression of potential yields of the order of 25%. A rating of S3 indicates that there are moderate to severe soil constraints and there would a suppression of potential yields of the oder of 50%. A rating of S4 indicates that there are severe soil constraints and there would be a suppression of potential yields of the order of 75%. A rating of N indicates that soil conditions are not suitable for production.
The soil unit ratings for fuelwood are given in Technical Annex 6, and apply as given, provided there are no additional limitations imposed by soil texture, phase and stoniness. Modifications are required where such limitations are present.
In the case of soil texture, soil unit ratings remain the unchanged if the soil is an Albic, Cambic, Ferralic, Calcaro-Cambic or Luvic Arenosol (Q, Qa, Qc, Qf, Qkc, Q1) or a vitric Andosol (Tv), or where textures are medium (fine sandy loam, sandy loam, loam, sandy clay loam, clay loam, silty clay loam, silt), or fine (sandy clay, silty clay, peaty clay, clay). In all other cases (i.e. with coarse textures: sand, loamy coarse sand, fine sand, loamy fine sand, loamy sand) the soil unit rating is one class (25%) lower.
Limitations imposed by phase and stoniness are rated using the five basic classes already described. The ratings are presented in Technical Annex 6.
Limitations imposed by slope are taken into account in three steps (Chapter 4). Step one defines the slopes which are permissible for fuelwood production, and as a model variable this is defined as slopes less than 45% (Table 4.1).
Step two involves the computation of potential topsoil loss which is estimated, by input level, through a modified Universal Soil Loss Equation (Wischmeier and Smith 1978).
Step three relates the estimated topsoil losses to yield losses through a set of equations given in Table 4.4, taking into account soil susceptibility (Table 4.3), level of inputs and regeneration capacity of topsoil (Table 4.2).
All three assessments: the climatic suitability, the edaphic suitability and the soil erosion hazard, are required to determine the ecological land suitability for fuelwood production of each climate-soil unit of the land resources inventory. In essence the land suitability assessment takes account of all the inventoried attributes of land and compares them with the requirements of the fuelwood species, to give an easy to understand picture of the suitability of land for the production of fuelwood.
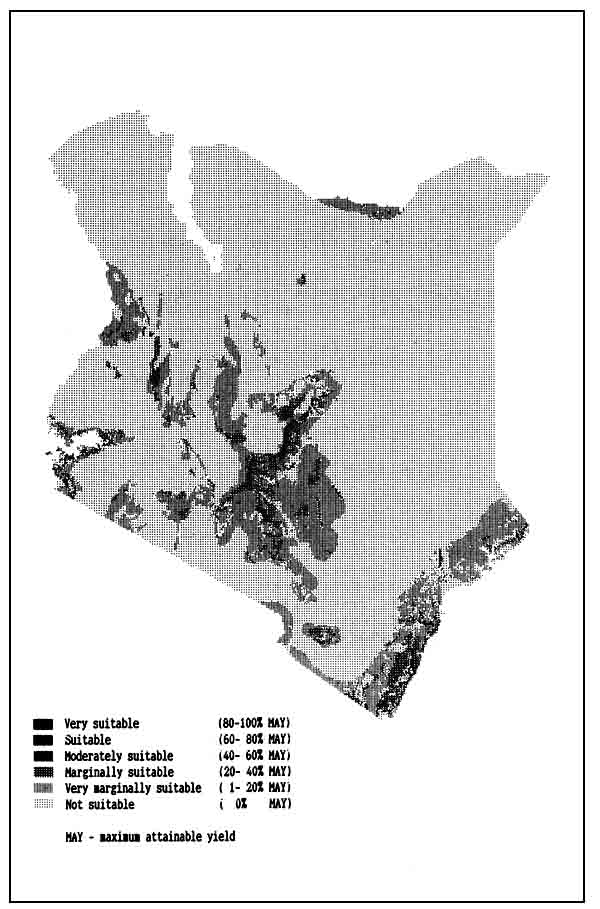
The results of the land suitability assessment can be presented using five basic suitability classes, each linked to attainable yields (mean annual increment) for the three levels of inputs considered. For each level of inputs, the land suitability classes are: very suitable (VS) - 80% or more of the maximum attainable yield; suitable (S) - 60% to less than 80% of the maximum attainable yield; moderately suitable (MS) - 40% to less than 60% of the maximumattainable yields; marginally suitable (mS) - 20% to less than 40%; and not suitable (NS) less than 20%.
Land suitability assessment for fuelwood production can be achieved by applying the programme illustrated in Figure 7.2. The assessment is carried out separately for each species and level of inputs, as explained in Section 5.1.5.
The five classes of land suitabilities are related to attainable yield as a percentage of the maximum attainable under the optimum climatic, edaphic and landform conditions, and so provide an assessment of fuelwood productivity potential of each land unit for calculation of the rainfed production potential of any given area in Kenya.
The generalized results of land suitability assessment for Eucalyptus camaldulensis at intermediate level of inputs are presented in Figure 7.3. Lands suitability results for all fuelwood species are presented in Technical Annex 8. It should be noted that the generalized results presented, include a subdivision of the not suitable class (zero to less than 20% of maximum attainable yield) into two classes (1) very marginally suitable (more than zero to less than 20% of maximum attainable yield) and (2) not suitable (zero yield).
Within the overall population supporting capacity model, the fuelwood productivity model is interphased with crop and livestock productivity models. The interphase in essence allows the possibility of considering:
fuelwood production on land assessed as not suitable for crops;
any portion of crop land for fuelwood production depending on how much land is required for other land uses to meet demand; and
fodder from fuelwood trees for livestock production.
Any land which is allocated to fuelwood production with species that offers palatable foliage would have the potential of contributing a portion of this foliage to fodder for livestock production.
Fuelwood species which offer palatable fodder for livestock are listed in Table 7.1. The amount of fodder which can be utilized by stock without affecting fuelwood yields would depend on the species and ecological situation. However, at this stage of the model interphase developement, it is assumed that about 10 % of the foliage may be utilized by stock without affecting fuelwood yields. The nominal foliage utilization coefficient values may be modified as appropriate for each species and environment.
![]()
![]()
![]()