![]()
![]()
![]()
Chapter 4
THE CONTRIBUTION OF SMALL FARMS
The contribution made by animals within small farm systems to food production (meat, milk and eggs) is considerable. This contribution is consistent with the relatively large proportions of various animals (70– 95% of the individual country populations) found in the small farm sector (Table 3.1)
Table 4.1 summarizes the current contribution of animals to meat, milk and eggs in South-East Asia. Within all categories, there is a steady increase in production. The overall growth rate of total meat production was 3.7%, compared to that for total milk of 4.2% and poultry eggs of 4.8% per annum. Appendix 2, Table 1 provides the details for individual countries.
MEAT PRODUCTION
Of the total meats produced, pig meat accounted for 44.3%, followed by poultry meat (33.0%), beef and veal (11.9%), buffalo meat (5.5%), duck meat (2.9%), goat meat (1.6%) and mutton and lamb (0.8%) (Figure 4).
Among the types of meat produced by ruminants, mutton and lamb had the highest growth rate at 5.6% per annum. However, this is likely to also reflect considerable imports into the region. It was followed by beef and veal (2.9%), goat meat (2.1%) and buffalo meat (2.0%). For beef and veal, the highest production was found in Vietnam (10.1%), followed by Cambodia (4.5%), the Philippines (2.9%) and Laos (2.2%). For buffalo meat, the highest growth rates were recorded by the Philippines (7.5%) and Cambodia (5.9%). Malaysia and Thailand both recorded decreases in buffalo meat production. Thailand had the highest growth rate of mutton and lamb (15.6%), followed by Indonesia (5.9%) and Malaysia (4.9%). High growth rates for goat meat were found in Vietnam (10.2%), Thailand (9.7%), Laos (8.1%) and Philippines (7.0%). Both Indonesia and Malaysia had negative growth rates for goat meat.
| Category | 1981 | 1985 | 1991 | Annual growth rate (%) |
|---|---|---|---|---|
| Beef and veal | 519.4 | 569.0 | 685.5 | 2.9 |
| Buffalo meat | 260.7 | 280.6 | 316.6 | 2.0 |
| Mutton and Lamb | 21.6 | 28.7 | 46.5 | 5.6 |
| Goat meat | 71.1 | 77.5 | 90.6 | 2.1 |
| Pig meat | 1533.0 | 1864.1 | 2541.8 | 5.6 |
| Duck meat | 145.9 | 170.2 | 165.6 | 1.4 |
| Poultry | 1062.7 | 1349.4 | 1895.4 | 6.2 |
| Duck meat | 145.9 | 170.2 | 165.6 | |
| Poultry | 1062.7 | 1349.4 | 1895.4 | |
| TOTAL MEAT | 2551.7 | 4339.5 | 5741.9 | 3.7 |
| Poultry eggs | 164.3 | 202.5 | 258.9 | 4.8 |
| Cow milk | 508.1 | 918.6 | 1074.6 | 6.9 |
| Buffalo milk | 108.6 | 123.9 | 128.3 | 4.1 |
| Other* | 173.6 | 214.8 | 254.6 | |
| TOTAL MILK | 790.3 | 1257.3 | 1457.5 | 4.2 |
With the exception of duck meat, and in comparison to all meats, poultry and pig meat production grew the fastest. In the case of poultry meat, double figure growth rates were recorded in Malaysia (12.9%), Cambodia (10.4%) and Indonesia (10.3%). High growth rates were also noted in Laos (7.3%), Thailand (7.0%) and Vietnam (4.9%).
Figure 4. Food production from animals in South-East Asia.
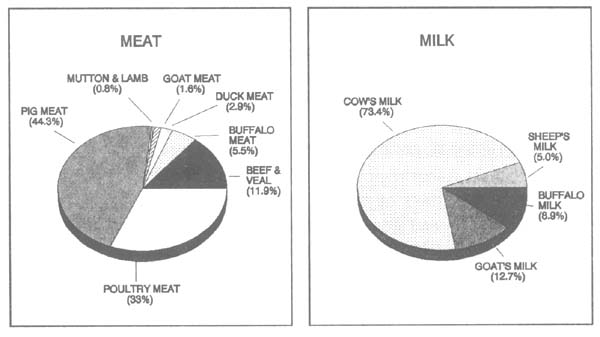
The growth of pig meat production was highest in Cambodia (14.1%), followed by Indonesia (8.4%) and the Philippines (5.5%). Duck meat is emerging as important in a number of countries where relatively high growth rates have been noted. These include the Philippines (10.6%), Laos (6.6%), Cambodia (5.5%) and Indonesia (4.0%).
MILK PRODUCTION
The amount of milk produced in South-East Asia, and especially from small farms, is considerable. This is consistent with the fact that all governments in these countries have given the dairy sector high priority for development, coupled with significant imports of germplasm, dairy production and processing equipment and technology.
Table 4.1 shows that cow milk is the most important among the different types of milk produced and has been growing at the rate of about 6.9% annually. The percentage proportions of milk production are as follows: cow milk (73.4%), goat milk (12.7%), buffalo milk (8.9%) and sheep milk (5.0%) (Figure 4). Among the countries, spectacular annual growth rates for milk production have been recorded in Thailand (24.1%) and Indonesia (13.4%). Lower growth rates have been noted in Laos (4.0%), Vietnam (3.4%) and Myanmar (2.6%).
Goat milk is more important than sheep milk in the region and, in Indonesia, an annual growth rate of 4.1% was achieved. Indonesia is perhaps the only country which also uses sheep milk and the average annual growth rate for this milk was 4.3%.
WOOL AND ANIMAL BY-PRODUCTS
The South-East Asian region also accounts for some wool production and sizeable quantities of various animal by-products, notably cattle and buffalo hides and goat and sheep skins. Of the total amount of hides and skins produced, cattle hides accounted for 55.5%, followed by buffalo hides (25.4%), sheep skins (10.0%) and goat skins (9.1%) (Figure 5). Table 4.2 summarises the total quantities produced. Appendix 2, Table 2 provides more detailed data for individual countries.
Figure 5. Production of animal by-products in South-East Asia.
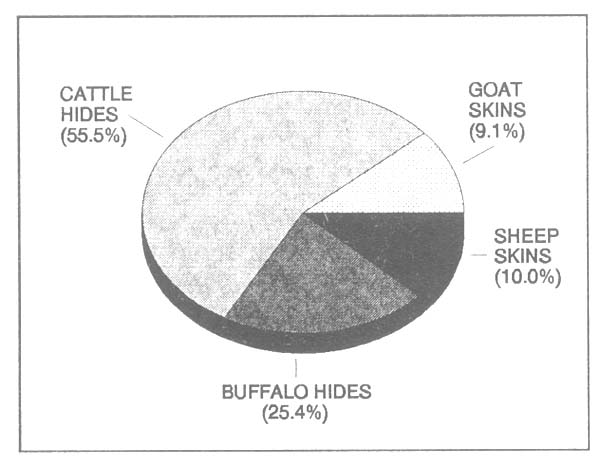
Table 4.2 also shows that, for all categories, there is increasing growth. The wool produced is mostly of the coarse type and is used mainly for carpet production and coarse rugs. Among the animal by-products, production of sheep skins is increasing at the rate of 10.4% and is associated with the increased number of animals being imported into individual countries.
| Category | 1981 | 1985 | 1991 | Annual growth rate (%) |
|---|---|---|---|---|
| Wool, greasy | 12.8 | 15.2 | 17.8 | 3.4 |
| Buffalo hides* | 41.7 | 44.9 | 49.6 | 1.9 |
| Cattle hides* | 89.2 | 94.8 | 108.6 | 2.3 |
| Goat skins* | 14.2 | 15.6 | 17.9 | 2.0 |
| Sheep skins* | 7.2 | 11.1 | 19.6 | 10.4 |
CONSUMPTION OF ANIMAL PRODUCTS
Table 4.3 gives an indication of the level of current per capita energy and protein supply. Appendix 3, Table 1–7, provides the details of consumption of total meat and that of different animal products for individual countries. Table 4.3 indicates that the highest dietary supply of energy and protein was in Malaysia. The lowest animal protein supply occurred in Indonesia.
Table 4.4 summarises the extent of food consumption of individual animal products, as well as the trends in the growth rates between 1980–1990. Pig and poultry meats were the most highly consumed, followed by buffalo and cattle meats. All other categories of meats consumed recorded annual growth rates of between 6.2–6.5% per year. Milk and egg consumption are also on the increase, with growth rates of 5.7% and 4.2% per year respectively. Per capita consumption is also increasing but at a slower rate compared to total consumption.
| Country | Energy (Cal) | Protein (g) | ||
|---|---|---|---|---|
| Total dietary energy | Energy from animal products* | Total dietary protein | Animal Protein | |
| Indonesia | 2631 | 75 | 57.1 | 7.8 |
| Malaysia | 2665 | 398 | 57.8 | 26.1 |
| Myanmar | 2546 | 122 | - | - |
| Philippines | 2235 | 235 | 51.5 | 20.1 |
| Thailand | 2288 | 191 | 49.1 | 14.8 |
* Includes fish and seafood but excludes animal fat
| Category | Total food consumption (kg/year) | Annual growth rate (%) | |
|---|---|---|---|
| 1980 | 1990 | ||
| Buffalo and cattle meat and products | 820 | 1113 | 3.5 |
| Goat and sheep meat and products | 99 | 129 | 6.5 |
| Pig meat and products | 1363 | 2488 | 6.2 |
| Poultry meat and products | 1103 | 1629 | 6.3 |
| Whole milk | 1032 | 1776 | 5.7 |
| Eggs and products | 768 | 1131 | 4.2 |
As one would expect, considerable differences exist between countries in the pattern of consumption of animal products. Total meat consumption varies from as high as 1181 kg per year in Indonesia to 89 kg per year in Cambodia. In Indonesia, meat from buffaloes and cattle represented a high proportion of the intake as did meat from goats and sheep. Vietnam was the largest consumer of pig meat (888 kg per year), followed by the Philippines (666 kg per year), Thailand (336 kg per year) and Indonesia (305 kg per year). Thailand had the largest consumption of poultry meat (506 kg per year), followed by Malaysia (347 kg per year) and Indonesia (347 kg per year).
Milk consumption was highest in the Philippines (412 kg per year), followed by Myanmar (274 kg per year) and Thailand (256 kg per year), and was lowest in Cambodia (16 kg per year). In egg consumption, Indonesia took the lead with 408 kg per year, followed by the Philippines (317 kg per year) and Thailand (191 kg per year).
DEMAND FOR ANIMAL PRODUCTS
The South-East Asian region is experiencing a relatively high rate of economic growth and this is expected to continue even more vigorously. This economic growth, coupled with increasing pressures of population increase and effects on land use systems, will further increase the demand for food. In this context, there will be a need for increased intensification of existing production systems to meet the demand for food.
The production of meat from non-ruminants (pigs and poultry) will increase faster than that of meat from ruminants (buffaloes, cattle, goats and sheep). This projected increase from pigs and poultry will place considerable demand on energy and protein concentrates to support production, especially coarse grains, cassava, oilseed meals and cakes. Questions will arise about the potential uses of indigenous energy and protein sources like cassava and palm kernel meal compared to the wisdom of exporting these and importing alternatives feeds from elsewhere.
The anticipated economic growth, and therefore peoples' income, is expected to further emphasize the demand for animal products, especially meat, milk and eggs. Sarma and Yeung (1985) have estimated income elasticities of demand for animal products as follows: meat=0.63, milk=0.57 and eggs=1.00. For Asia as a whole, the demand for meat and milk are projected to be the highest among all regions. The demand for milk will be partly met by increasing imports but their extent will be influenced by domestic production as well as by foreign currency restrictions.
![]()
![]()
![]()