![]()
![]()
![]()
J. Morin, The Institute of Earth Sciences, The Hebrew University of Jerusalem
Erosion, flood control and tillage management are directly affected not only by the monthly and annual rain volume, but also by the intensity of individual rainstorms. Storm analysis is an important aspect of rainfall evaluation. the rainfall-runoff relationship for any rainstorm depends on the dynamic interaction between rain intensity, soil infiltration and surface storage. Runoff occurs whenever rain intensity exceeds the infiltration capacity of the soil, providing there are no physical obstructions to surface flow. Rainfall storm analysis should consider therefore the sequence of intensive rain events as well as their magnitude.
Long runs of information on rainfall amounts and intensities have been collected in most parts of the world. These data provide a reliable set of information which allows one to assess water resource planning on a probability basis. Quantitative knowledge of a region's rainstorm characteristics is as important as information on soil properties.
The runoff from a given rainstorm is a function of:
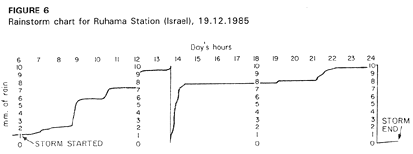
A rainstorm is defined here as a period of rain, in which the interval between rainfall segments does not exceed 24 hours. Autographic rain recorders provide us with rain intensity and storm sequence information. A typical rain record is displayed in Figure 6. The trace on this chart is a cumulative rainfall curve, the slope of the graph being proportional to the intensity of the rainfall.
|
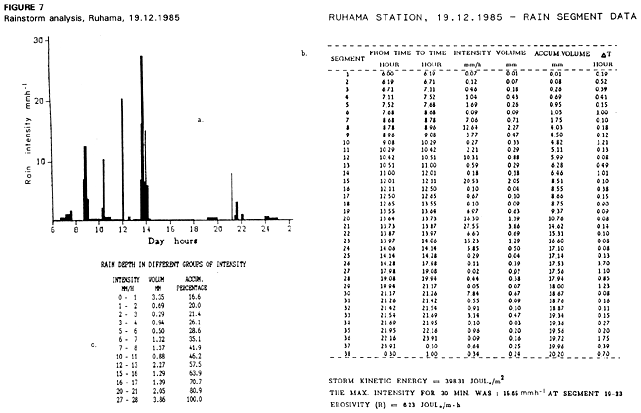
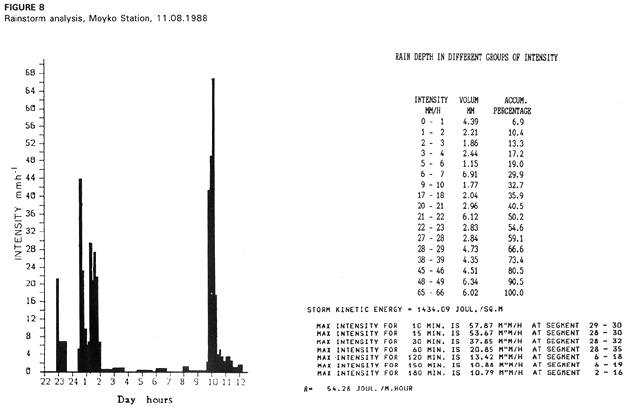
Technically, rainstorm analysis begins with the manual digitization of each inflection point on the graph directly into a computer. Computer programs are then used to carry out the required calculations. A specimen analysis of the rainstorm chart of 19.12.1985 from the Ruhama Station, Israel (Figure 6), is presented in Figure 7. The rainstorm was broken down into segments. Each segment represents a time interval with uniform rainfall intensity. In Figure 7c the storm intensities are grouped regardless of their sequence. For example, segments 19 and 22 have an intensity of between 6-7 mm h-1 with a total volume of (0.63 + 0.69) 1.32 mm. In addition, the maximum rain intensity over a 30 minute period (I30) was at a rate of 15.65 mm h-1, and the median intensity of the storm was approximately 11 mm h-1. The I30 value was chosen since it represents the rainstorm erosivity factor (Wischmeier 1959). Figure 8 gives data for a tropical storm from the Mokyo Station, Cameroon. Here the intensities are higher, with a median of 22 mm h-1 and a maximum intensity over 30 minutes of 38 mm h-1.
|
|
On many cultivated or bare fields the soil infiltration ability is commonly limited by surface crusting rather than by deeper profile conditions. As a result, rainwater falling on bare ground cannot penetrate, and runs off sideways, even on very gentle slopes.
The rapid drop in infiltration rate (IR) of most of the bare soils during rainstorms is due mainly to the surface seal. The seal is less permeable, by a few orders of magnitude, than the subsurface horizon. Surface seal, as well as most of the other crust formations, results from three processes (Agassi et al. 1981).
The above separation of the three processes is artificial. The marked reduction in infiltration rate commonly observed depends on their combined action.
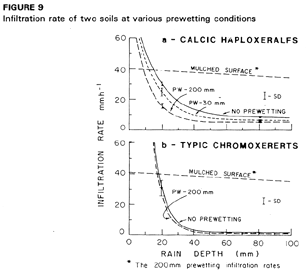
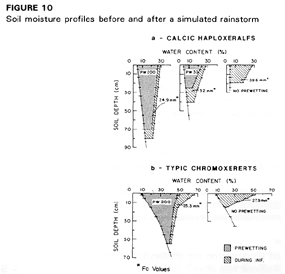
The effect of soil moisture and wetting front depth on the infiltration of two bare cultivated soils, was studied by a field rainfall simulator (Morin and Benyamini 1988). the two soils were: a Calcic Luvisol developed in Loess, and a Vertisol. The field experiments were conducted at the end of the dry season on dry soil profiles. The fields, with a 5% slope, were cultivated and a seedbed prepared before the rain application. Three initial treatments were applied:
The soils in the plots were mulched before the prewetting to prevent crust formation. The prewetting was done 24 hours before the mulch was removed and an artificial storm of 80 mm was applied to the bare soils. Figure 9 illustrates the soil moisture regime during the experiment's different stages.
The infiltration rates (It) of the two soils as a function of accumulated rain depth for the three prewetting treatments, are presented in Figure 10. In both soils the It decreased more sharply when the wetting front was deeper, but this difference became smaller as the storm continued. The high permeability of the soils in the presence of mulch on the surface and the low steady state of IR values for the various prewetting treatments, suggest that the reduced hydraulic conductivity of the soil surface crust controls the actual infiltration rates. The wetting front depth and soil moisture content have only a slight effect on it.
Infiltration functions for crusted soils
Soil infiltration rate can be described mathematically as a function of the cumulative rainfall and several soil parameters. Morin and Benyamini (1977) described the infiltration rates (It) of bare soils under rain by the following equation:
It = Ii + (Ii - If) exp(- ?pt) (1)
| where: | Ii | = | initial infiltration rate of the soil - mm h-1 |
| Ir | = | final (constant) infiltration rate of the soil - mm h-1 | |
| t | = | time from the beginning of the rain - hours | |
| ? | = | soil coefficient related to aggregate stability while forming the crust | |
| p | = | rain intensity - mm h-1 |
The equation (1) describes the effect of the building up of a continuous crust at the surface. The relatively impermeable crust is the main factor controlling infiltration.
In order to calculate the infiltration functions for different soil crust conditions, field experiments with rainfall simulations were conducted. In these experiments, the soil was subjected to simulated rainfall with different intervals between the rainstorms. The conditions studied were:
|
|
|
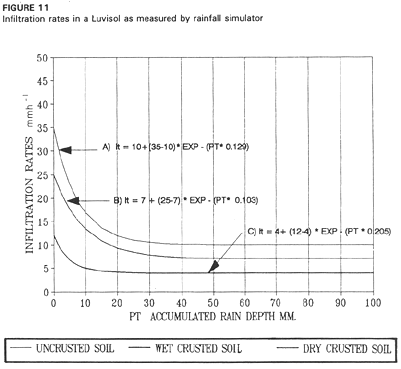
Figure 11 presents the infiltration rate as a function of the cumulative rainfall for a calcic Luvisol (Loess), as measured in the field by rainfall simulator.
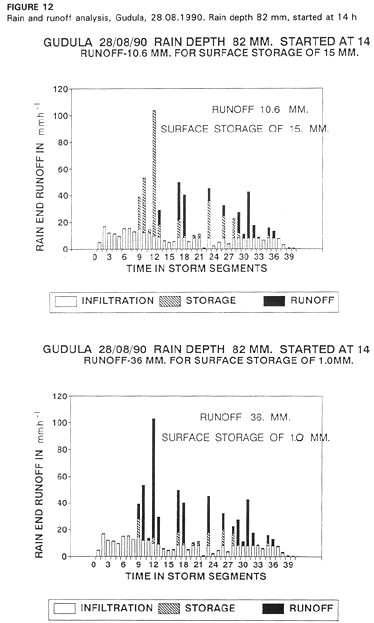
The balance between rain intensity, infiltration and runoff involves another, very important factor - surface storage. The runoff balance equation can therefore be written as follows:
Runoff = rainfall - infiltration - surface storage
Figure 12 demonstrates the surface storage effect on runoff from a storm of 82 mm. Raising the storage from 1 mm (Figure 12a) to 15 mm (Figure 12b) results in reducing the runoff from 36 to 11 mm. The 25 mm reduction in runoff is much greater that the storage itself. This is because surface storage is a dynamic parameter, which allows maximum infiltration for low-intensity rain segments, at the same time renewing the storage capacity free volume.
|
The surface runoff of a storm with varying rainfall rates can be calculated by equation 2 which is evaluated for each individual time segment during which excess rainfall occurred, taking into consideration not only excess of rainfall rate over infiltration rate, but also whether surface detention and surface storage were satisfied prior to runoff initiation.
SRi = S(pi + SDi-1 - Fi - SDm) (2)
| where: | Ri | = | surface runoff (mm) for the time segment |
| SDi | = | surface storage and detention (mm) for the time segment | |
| SDm | = | maximum surface storage and detention (mm) | |
| Fi | = | the potential infiltration (mm) of any time segment ti (mm). |
The amount of infiltration during any time segment of a storm is given by equation 3.
Fi = Irti + [(Ii - Ir)/(- ?Pi)][exp(-?Di)-exp(-?Di - 1)] (3)
with the cumulative rainfall up to the time t; Di = SPiti and all other parameters as in equations 1 and 2.
Values of SDm are iterated from an initial value of zero to any desired predetermined value. The SDm value for a particular soil and its tillage condition may be determined empirically using the rainfall simulator.
Figures 12a and 12b demonstrate the calculation of the runoff rainfall balance for the same soil infiltration equation. Rain segments intensities, magnitude and sequence, determine the surface storage efficiency and the increase in the actual storm infiltration. The low-intensity rain segments in between the higher ones are responsible for the high efficiency of the surface storage.
The feasibility and economic evaluation of tillage operation to reduce runoff losses has to be based on: the soil infiltration characteristics; and the long-term information of the rainstorms.
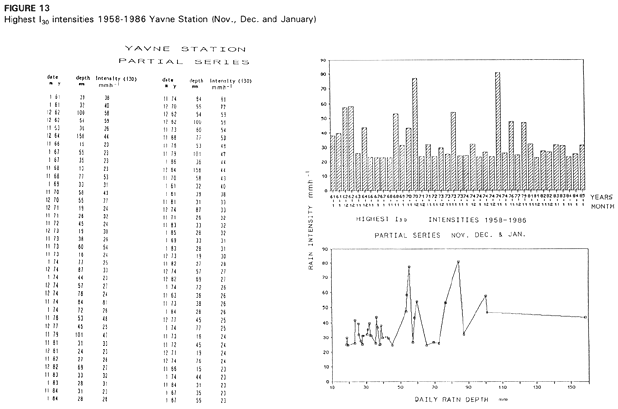
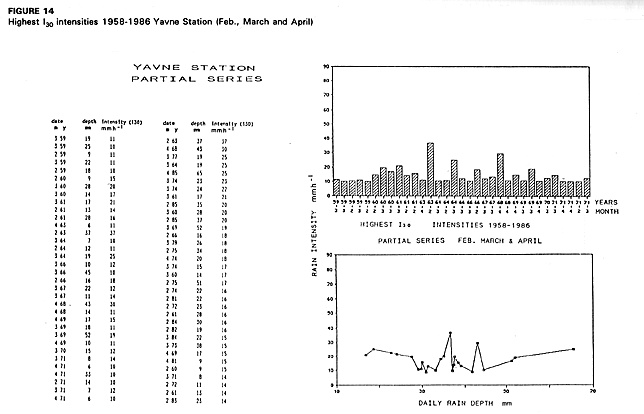
Rainstorm information has been collected in most parts of the world and rain record charts are widely available. This kind of information is probably the only sort which allows one to assess tillage management planning on a probability basis. Data banks of the actual rain intensities for rainstorms in a target region can provide us very useful information. The present section presents some aspects of the use of such data. Figures 13 and 14 present the highest I intensity for 32 years at Yavne Station on the southern coastal plain of Israel. Figure 13 relates to the first half of the rainy season and Figure 14 to its second half. It can be seen that rainfall intensities for the period October to January are much higher than those from February to April. The higher intensities in the early season occur, however, at a time when soils are mostly bare. Obviously, runoff and erosion rates are much higher on bare than on vegetated soil. The high rain intensities during this part of the year should therefore be a key consideration in any planning. Where the infiltration characteristics of a soil are not known, analyses of all recorded rainstorms in a region, together with the infiltration and surface storage information, can be used to generate long-term synthetic runoff data. Probability analysis of such data can then be used to plan water harvesting, for basin tillage specifications, or to assess drainage requirements.
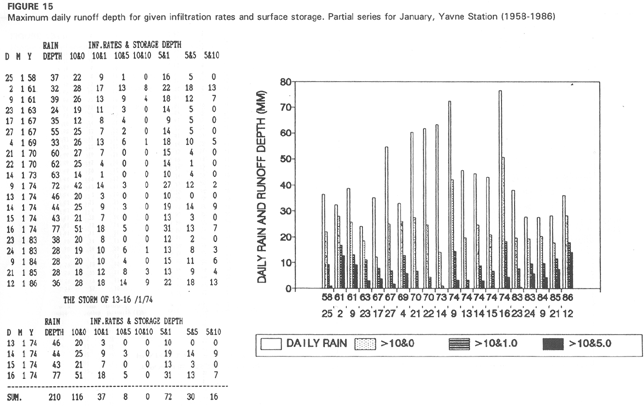
Where only the highest runoff events need to be studies, a simpler type of analysis can be conducted. In this case, uniform infiltration rates are assumed for the whole period of the rainstorm. Rainstorm analysis can then be performed, assuming a set of relevant infiltration rates and surface storage depth. Figure 15 is an example of this type of analysis for Yavne Station during January. January was chosen because the soil of this locality will normally be wet in this month and will have low and stable infiltration rates. Figure 15 illustrates the strongest January storms for the years 1958-1986.
From Figure 15 it can be seen that surface storage magnitude has a marked impact on the production of runoff. If we take the storm of 13-16/01/1974, the total rain depth for this four-day period was 210 mm. Assuming infiltration rates of 10 mm h-1 and zero storage, the runoff will be 109 mm. Adding 1 mm of storage to the infiltration rate of 10 mm h-1 will produce a runoff of 37 mm. If, however, we have a rougher surface with storage of 5 mm, the runoff will be reduced to only 8 mm. The reason for this is that the surface storage is a dynamic parameter which allows maximum infiltration during low-intensity rain periods; renewing the storage capacity frees volume.
|
|
|
Physical and economic evaluation of a water resource project should be based on probability analysis. Water harvesting, basin tillage and drainage are all appropriately treated in this way.
Long runs of information on rainfall amounts and intensities have been collected in most parts of the world. This data probably provides the only reliable set of information which allows one to assess water resource planning on a probability basis.
The digitization and analysis of all available rain charts for a target area provides an important tool in project planning and in assessing various options. In many cases the data should help to decide the best approach at an early planning stage.
![]()
![]()
![]()