![]()
![]()
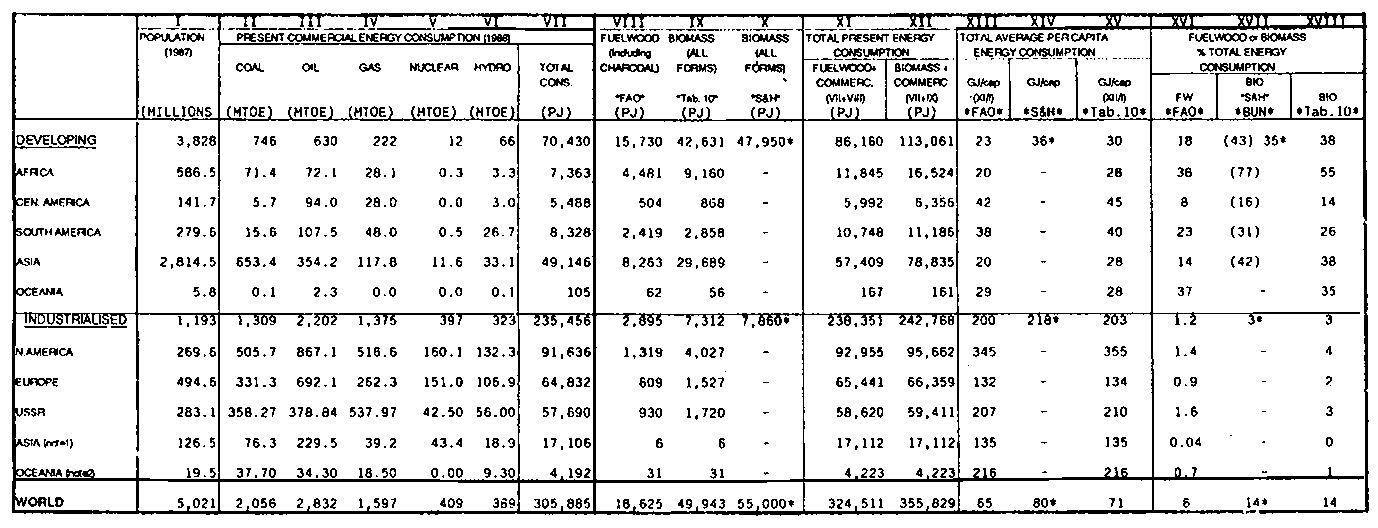
Table 1: Present Energy Consumption (commercial + biomass); Global Summary
|
CONS. |
Consumption |
FW |
Fuelwood |
( ) |
BUN estimate |
S&H |
Scurlock & Hall (1990) |
*Scurlock & Hall estimate in «The Contribution of Biomass to Global Energy Use» BIOMASS 21 75-81 1990
They estimate Developing countries use 38 Developed 218 & World 80 GJ/capita and that biomass provides 35% 3% & 14% of the Worlds energy respectively
( ) - BUN data only from 55 countries (see sources)
ASSUMPTIONS
1 Tonne of Oil Equivalent (TOE) - 42 GJ/t
1 GJ - 109 Joules
BIOMASS/FUELWOOD = 15 GJ/t (air dry 20% moisture)Fuelwood (FW) in this table is equivalent to the FAO's definition of "Fuelwood + Charcoal"; no other forms of biomass use are estimated.
Notes:
1) INDUSTRIALISED ASIA is total for Japan + Israel ONLY2) INDUSTRIALISED OCEANIA is total for Australia + New Zealand ONLY
- HYDRO = HYDRO + GEOTHERMAL for hydro and nuclear statistics regional totals may not add as data source did not provide a comprehensive breakdown for all countries.
- Col. I: 1987 Population data from FAO AGROSTAT database (1980)
Col. II VII: Condensed individual country data from various sources i.e.:
(UNSO) UN Statistical Office "Energy Balances and Electricity Profiles 1988" NY (Developing Country Commercial Data)UN "Energy Statistics Yearbook 1987' NY (Developing Country Commercial Data)
BP "Statistical Review of World Energy 1980" London (Western European, USSR, N. America and Japan Commercial Data)
OECD/IEA "World Energy Statistics and Balances 1985-1988" Paris. (Eastern Europe and Israel Commercial Country Data)
Col. VIII: FUELWOOD = Fuelwood + Charcoal (no other forms of biomass energy use are accounted for under this definition) as defined by (FAO) Food and Agriculture Organization, "Forest Products Yearbook 1989" Rome (Fuelwood use data)
- Col. IX: shows regional summaries of country by country total biomass energy use includes data gained independently from the FAO/UN (see table 10)
- Col. X: Total biomass energy use derived from Scurlock & Hall (1990)
Scurlock J.M.O., Hall D.O., (1990) The Contribution of Biomass to Global Energy Use" BIOMASS 21 75-81- Column XI = Col. VII + Col. VII
- Col. XII = Col. VII + Col. IX (see table 10)
- Col. XII to XV: Per capita energy consumption calculated from the estimated total biomass and commercial energy consumption divided by the 1987 population totals S&H per capita consumption is not calculated using population and commercial energy data shown as the commercial energy database used by them (i.e. BP) cannot be disagreggated at the country level. BP regional estimates for commercial energy consumption are higher than shown here
- Col. XVI to XVIII: The percentage contribution of biomass energy to total energy consumption is calculated using the data shown
- Col. XVII: BUN data has been collected for 55 developing countries only sources (BUN) Biomass users Network & Skills Centre Kings College London (See also Scurlock & Hall 1090 above)
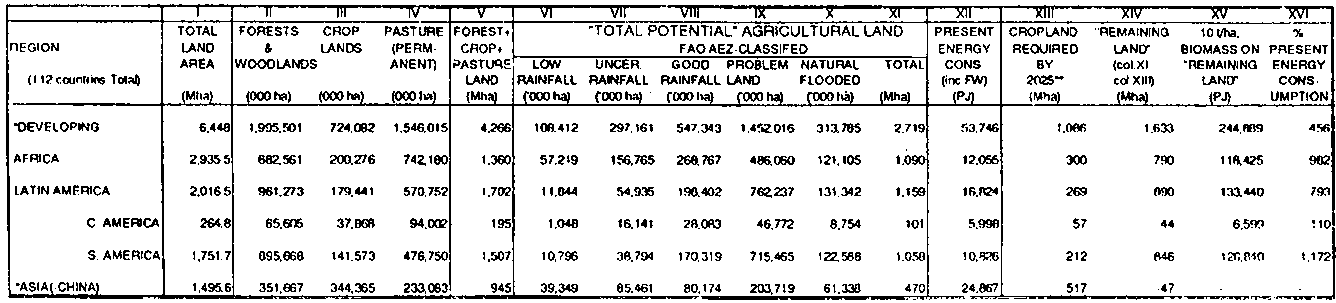
The Regional potential for biomass production in a number of developing countries using only that land defined by the FAO to be suitable for agriculture and forestry as determined by physical water and social constraints (see footnotes) Yields of 10 t/ha are not necessarily realistic on all land but are chosen to represent a convenient global midpoint for biomass production on a large scale in the future in practice yields of less than 1 to more than 30 t/ha/yr. are presently experienced.
|
* does not include China |
CONS. |
Consumption |
FW |
Fuelwood and Charcoal only. |
NOTES:
"TOTAL POTENTIAL" Land is defined by the FAO as land which is physically capable of crop production within soil and water constraints It excludes land which is too steep, dry or with unsuitable soils.** IPCC III calculates that demand for cropland in developing countries will increase by 50% by the year 2025. Present cropland area (col. III) from the FAO "Production Yearbook. 1989," is therefore increased by 1.5 times to give future likely land area under cultivation
The regional classifications used here miss a total of 50 countries including China. Some Africa and much of the Caribbean whose combined population is over one billion people.
China is not included in the developing country totals.
This table highlights the need for detailed local level data and the benefit of greater disaggregation of global data collection. A direct comparison of the FAO's "Production Yearbook. 1989," land classification (Col. V) and their new "AEZ. Agriculture Towards 2010, 1992." inventory (Col. XI) shows moderation of predicted land requirements for biomass energy. Thus using Col. V data & assuming a 10 t/ha yield would provide Botswana with over twenty times their present energy requirement. However, if Col. XI data is used the figure drops to a far more realistic level of about one fifth present energy requirements if ONLY "good" land is used in some countries, however, notably India and Bangladesh, predictions (or potential biomass supply come well below recorded values e.g. Bangladesh now obtains about 80% of its present supply from biomass and India about 50% cf. 28 & 25% for respective predicted values. This is due to the high level of agricultural residue use which dominates the domestic supply scene.
The negative land area of 47 Mha for Asia (China) assumes no increases in productivities to the year 2025 as it is only a linear extrapolation of existing food production trends.
In India for example, there are extensive areas of degraded land (150 Mha) which could be productive for biomass growth given appropriate policies
ASSUMPTIONS:
1 Tonne of Oil (TOE) = 42 GJ. 1 GJ = 109 Joules
BIOMASS/FUELWOOD = 15 GJ/t (air dry 20% moisture)
SOURCES
Cols. IV from FAO: "Production Yearbook. 1989" RomeCROPLAND = Arable & Permanent Cropland.
FORESTS & WOODLANDS = Forests & Woodlands.
PASTURE = Permanent Pasture (FAO definitions 1990).Cols. VI-XI: data from FAO. (1992) "AEZ; New Inventory. AT2010" Fischer G. & van Velthuizen H. Rome.
"Total Potential" agricultural land definition (see above)Col. XII: Total present energy use: commercial + Fuelwood ONLY (FAO. "Forest Products Yearbook. 1989" Rome.)
Col. XIII: Cropland required by 2025, assumes a 50% increase in demand for cropland in Developing Countries (ref. IPCC III) and no change for Industrialized countries. (therefore col. III * 1.5)
Table 3: Summary of biogeoclimatic data and yields for trial plantations in Northeast Brazil."
(a) Source: Centro Nacional de Florestas, Empresa Brasileira de Pesquisa Agropecuaria.(b) C = Clay, R = rocky, S = sandy.
(c) I = especially well-suited to support tree growth, II = average suitability, III = useable with restrictions, IV = cannot be used for trees.
(d) All are species within the genus Eucalyptus. Spacing of trees in all trials was 3 by 2 meters.
Table 4: Global Land Use 1882-1989.
|
Category |
1882 |
1981 |
1989 |
|||
|
Mha |
(%) |
Mha |
(%) |
Mha |
(%) |
|
|
Arable Land |
860 |
6.5 |
1,469 |
11.2 |
1,477 |
11.3 |
|
Grass-Land |
1,500 |
11.4/ |
3,172 |
24.3 |
3,304 |
25.3 |
|
Forest Land |
5,200 |
39.8 |
4,090 |
31.3 |
4,087 |
31.3 |
|
Other Landa |
5,517 |
42.2 |
4,346 |
33.2 |
4,208 |
32.2 |
|
Totalb |
13,077 |
100 |
13,077 |
100 |
13,077 |
100 |
Source: FAO Production Yearbooks 1982 & 1990.a "Other Land" includes, desert land, stony, rock and steep land in mountains, ice caps (polar regions).b Does not include water covered land such as lakes, rivers and marshes.
Table 5: Potential Land For Reforestation.
|
Source |
Total Available Area Mha |
Comments |
|
Houghton & Woodwella (1989) |
850 |
350 Mha of which "could be returned to forest if permanent agriculture were to replace shifting cultivation |
|
Graingerb (1988) |
758 |
2007 Total degraded tropical land area of which available land area is estimated at: 203 Fallow Forests 137 Logged forests 87 Deforested watersheds 331 Desertified Drylands |
|
Myersc (1989) |
300 |
200 Mha "needs reforestation for reasons other than the Greenhouse effect. 160 Mha of the 200 Mha above, from upland watersheds which urgently need reforestation, the rest required as woodlots. |
|
Massoudd (1979) |
1,000.5 |
Based on UNESCO soil map of the world (1973), Massoud estimates the total land area affected by soils by region. Definitions of the levels of salt and its effect on plant growth are species and climate dependant and should be treated with caution. |
|
Alpert et al.e (1992) |
952 |
Estimated as the total area available for halophyte culture. 125 Mha of the above is assumed to be feasible due to restrictions for saline irrigation. |
|
Bekkeringf (1992) |
385 |
Theoretical land available in 11 Tropical countries out of 117 estimated to have excess land available when Forest area is considered as unsuitable, and agricultural land is also subtracted. |
|
NaKicenovic et al.g (1993) |
265 |
84.5 Mha extra is considered as available for agroforestry. Global estimate, which distinguishes between land considered "suitable" and that which is likely to be "available." |
Sources:
a Houghton & Woodwell (1989).
b GRAINGER (1988).
c Myers (1989)
d Massoud (1979)
e Alpert et al., (1992)
f Bekkering, (1992)
g NaKicenovic et al. (1993)
Synthesised by J. Woods.
Table 6: Land area in plantationsa (million hectares)
|
|
Industrial plantationsb |
Industrial plantations of fast-growing treesc |
|||||
|
Conif. |
Non-conif. |
Total |
Conif. |
Non-conif. |
Total |
||
|
North America |
|||||||
|
|
United States |
|
|
|
12.00d |
0.50 |
12.50 |
|
|
Subtotal |
12.0 |
0.5 |
12.5 |
12.00 |
0.50 |
12.50 |
|
Europe |
|||||||
|
|
Spain |
|
|
|
- |
0.45 |
0.45 |
|
|
Portugal |
|
|
|
- |
0.40 |
0.40 |
|
|
Subtotal |
15.7 |
3.3 |
19.0 |
- |
0.85 |
0.85 |
|
Oceania |
|||||||
|
|
New Zealand |
|
|
|
1.18 |
0.02 |
1.20 |
|
|
Australia |
|
|
|
0.90 |
0.06 |
0.96 |
|
|
Subtotal |
2.1 |
0.1 |
2.2 |
2.13 |
0.11 |
2.24 |
|
Former USSR |
16.9 |
- |
16.9 |
- |
- |
- |
|
|
Latin America |
|||||||
|
|
Brazil |
|
|
|
1.60 |
2.30 |
3.90 |
|
|
Chile |
|
|
|
1.14 |
0.06 |
1.20 |
|
|
Argentina |
|
|
|
0.46 |
0.18 |
0.64 |
|
|
Venezuela |
|
|
|
0.18 |
0.02 |
0.20 |
|
|
Mexico |
|
|
|
0.06 |
0.02 |
0.08 |
|
|
Other |
|
|
|
0.08 |
0.35 |
0.43 |
|
|
Subtotal |
3.5 |
2.9 |
6.4 |
3.52 |
2.93 |
6.45 |
|
Africa |
|||||||
|
|
South Africa |
|
|
|
0.50 |
0.80 |
1.30 |
|
|
Angola |
|
|
|
0.02 |
0.05 |
0.07 |
|
|
Congo |
|
|
|
- |
0.04 |
0.04 |
|
|
Kenya |
|
|
|
0.16 |
0.01 |
0.17 |
|
|
Zimbabwe |
|
|
|
0.07 |
0.01 |
0.08 |
|
|
Other |
|
|
|
0.55 |
0.33 |
0.88 |
|
|
Subtotal |
1.3 |
1.2 |
2.5 |
1.30 |
1.24 |
2.54 |
|
Asia |
|||||||
|
|
Indonesia |
|
|
|
- |
0.10 |
0.10 |
|
|
China |
|
- |
|
- |
0.40 |
0.40 |
|
|
Other |
|
|
|
- |
0.17 |
0.10 |
|
|
Subtotal |
31.6 |
8.2 |
39.8 |
- |
0.67 |
0.67 |
|
Total |
83.1 |
16.2 |
99.3 |
18.95 |
6.30 |
25.25 |
|
a Bazett (1992)b. The majority of the temperate zone plantations tend to involve slow-growing trees, with increments of the order of 5 to 6 m3 per hectare per year and rotation periods of up to 100 years.
c Average yields for fast growing industrial plantations are typically in the range 18 to 30 m3 per hectare per year for Eucalyptus species (7 to 12 year rotations) and 15 to 25 m3 per hectare per year for Pinus species (25 to 35 year rotations).
d Borderline last-growing (12 m3 per hectare per year for pine rotations).
TABLE 7: Evolution of charcoal consumption in Brazil ('000m3)
|
YEAR |
CHARCOAL FROM NATIVE FORESTS |
% |
CHARCOAL FROM PLANTED FORESTS |
%a |
TOTAL |
|
1978 |
13,317 |
88 |
1,833 |
12 |
15,150 |
|
1979 |
15,116 |
87 |
2,184 |
13 |
17,300 |
|
1980 |
16,866 |
85 |
2,777 |
15 |
19,644 |
|
1981 |
15,577 |
81 |
3,654 |
19 |
19,230 |
|
1982 |
14,929 |
80 |
3,732 |
20 |
18,660 |
|
1983 |
18,423 |
82 |
4,087 |
18 |
22,510 |
|
1984 |
24,597 |
83 |
5,010 |
17 |
29,607 |
|
1985 |
26,085 |
83 |
5,501 |
17 |
31,586 |
|
1986 |
29,049 |
82 |
6,065 |
18 |
35,114 |
|
1987 |
27,726 |
81 |
6,624 |
19 |
34,349 |
|
1988 |
28,563 |
78 |
8,056 |
22 |
36,619 |
|
1989 |
31,900 |
71 |
12,903 |
29 |
44,803 |
|
1990 |
24,355 |
66 |
12,547 |
34 |
36,902 |
Source: (ABRACAVE, 1990 & 1991)a Decree No. 97.628 (of 12/4/89) required that the percentage of charcoal to be obtained from plantations must be as follows:1989 = 40%
1990 = 50%
1995 = 100%However, the same decree allows the production of 20% of charcoal from forest residues and hence in actual practice the maximum amount of charcoal to be produced from plantations would not be over 80% of total, as from 1995 onwards.
Table 8: SOME USES OF BIOMASS RESIDUES.
|
Source |
Type |
Use as Domestic Fuel |
Industrial Uses |
Competitive End Uses |
Suitability for Transport |
Future Availability |
|
Coconut |
Fuelwood |
|
Bricks Tiles; Bakeries |
Construction (15) |
Good |
Stable |
|
Shells |
Ironing |
Charcoal |
latex cups (20) |
Fair |
Stable |
|
|
Husks |
Cooking |
|
Fibre (20) |
Fair |
Stable |
|
|
Leaves |
Cooking |
|
Cadjans (20) |
Poor |
Stable |
|
|
Natural Forest |
Fuelwood
Charcoal |
Cooking |
Bricks |
|
Good |
Declining |
|
Tiles |
||||||
|
Bakeries |
||||||
|
Tea |
||||||
|
Rubber |
||||||
|
coconut |
||||||
|
hotels |
||||||
|
Pig Iron |
||||||
|
Rubber |
Fuelwood |
Cooking
|
Bricks |
|
Good |
declining |
|
Tiles |
||||||
|
Bakeries |
||||||
|
Tea |
||||||
|
Rubber |
||||||
|
Coconut |
||||||
|
Hotels |
||||||
|
Home Garden |
Fuel-wood |
Cooking |
|
Poles (5) |
Fair |
Rising |
|
Shells |
Ironing |
|
Poor |
Rising |
||
|
Husks |
Cooking |
Fertiliser (100) |
Poor |
Rising |
||
|
Leaves |
Cooking |
Cadjans (15) |
Poor |
Rising |
||
|
Tea
|
Fuel-wood |
Cooking |
Tea
|
Fertiliser (20)
|
Fair |
Rising |
|
Biomass |
Cooking |
Poor |
Rising |
|||
|
Palmyrah
|
Fuel-wood |
Cooking |
|
Thatching |
Good |
Rising |
|
Biomass |
Cooking |
Fencing (30) |
Poor |
Rising |
||
|
Cinnamon |
Fuel-wood |
Cooking |
|
Vegetable sticks (?) |
Good |
Rising |
a Source: Howes (1989).b Estimated percentage consumed by alternative end use in parentheses,
The three main sources of residues are estimated in terms of the total energy content of potentially harvestable residues. Total energy use is compared with the energy content of recoverable residues (1/4 of (he potentially harvestable residues). Biomass yields of 10 t/ha/yr. are not necessarily realistic on all land, but are chosen as a convenient midpoint for biomass energy production on a large scale in the future; yields of less than 1 t/ha to more than 30 I/ha are presently experienced.
Footnotes to Table 9a:
Columns
I & II data from FAO, "Production Yearbook, 1989, " Rome.III-V total energy content of Potentially Harvestable residues estimated from three major sources namely:
a) crop; residue coefficients are derived from the ratio of Byproduct (Potentially Harvestable Residues): Product (Commercial Production data from FAO Production Yearbook 1989). Average values: Cereals (1.3; 12 GJ/t), Vegetables & Melons (1.0; 6 GJ/t), Roots & Tubers (0.4, 6 GJ/t), Sugar Beet (0.3, 6 GJ/t) and Sugarcane (0.55, 16 GJ/t).b) forest; Potentially Harvestable residues are assumed to equal all residues generated during cutting and processing. For each country total Cut is calculated as 1.67 times "Roundwood Production."(FAO Forest Products Yearbook, 1989). Residues arise at the site of cutting are assumed to be 40% of Total Cut, and at the mills, assumed as 50% of "Industrial Roundwood". [Globally, "Industrial Roundwood" and "Fuelwood + Charcoal" are each equal to about half of "Roundwood Production." (15 GJ/t)], but such a ratio cannot be used at the country or regional level because of the country differences between cutting for fuelwood and for industrial roundwood. Calculation of on site residues from the total cut are not possible in the case of use for fuelwood and charcoal because of widely 'differing local practices; thus we assume a 40% residue from the total cut for both industrial roundwood and fuelwood + charcoal.
c) dung; Animals populations are derived from WRI, "World Resources; 1990-91." Washington, D.C. 20006. Each category is assigned a dung production coefficient which estimates the average daily dry dung production for each type of animal (Taylor et al., 1982; Senelwa A, K, Hall D, O,. 1991) i.e. Cattle (3 kg d-1; 15 GJ/t), Sheep & Goats (0.5 kg d-1; 17.8 GJ/t), Pigs (0.6 kg d-1), Equines (1.5 kg d-1;15 GJ/t), Camels & Buffaloes (4.0 kg d-1; 14.9 GJ/t) and Chickens (0.1 kg d-1; GJ/t). It is then assumed that 50% of total production is Potentially Harvestable. Recoverable Dung is then assumed to be 25% of Potentially Harvestable Dung i.e. 1/8th of total production, dry weight.
VII Present commercial energy consumption is calculated using FAO, "Energy Statistics Yearbook, 1989, ". FAO's, Forest Products Yb. 1989, is used for "Fuelwood + Charcoal." No attempt is made to estimate any other form of Biomass Energy use.
VIII uses Col. VII to calculate Present per capita energy use.
IX & X assumes total energy usage of either 35 or 70 GJ/cap/yr. to estimate present and future total energy consumption for each country. 70 GJ/cap is approximately twice the present energy consumption for developing countries, and is predicted to occur in the next century.
XI-XII show percentage of "present energy consumption" (col. VII) and "total energy consumption" at 35 GJ/cap (col. IX) which could be provided by 25% of recoverable residues alone.
XIII-XIV indicate potential land use for biomass growth. A biomass productivity of 10t/ha/yr. is used to show the land area needed for each country, to provide the energy requirements given in col. IX (35GJ/cap).
XV & XVI shows land needed to provide 35 GJ/cap. using 25% of the of potentially harvestable residues and biomass growth @ 10 t/ha/yr.
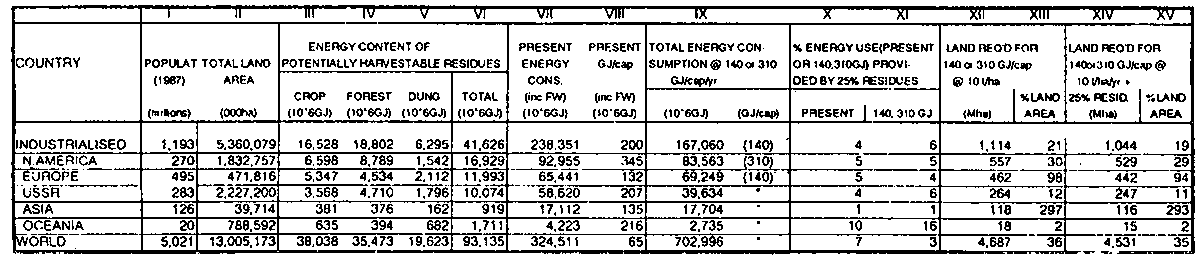
The three main sources of residues are estimated in terms of the total energy content of potentially harvestable residues Total energy use is compared with the energy content of recoverable residues (1/4 of potentially harvestable residues) as a fuel Yields of 10 t/ha/yr. are not necessarily realistic on all land but are chosen to represent a convenient global midpoint for biomass production on a large scale in the future, in practice yields of less than 1 t/ha to more than 30 t/ha are presently experienced
Footnotes to Table 9b:
I & II data from FAO, "Production Yearbook, 1989," Rome.III-V show the total energy content of Potentially Harvestable residues estimated from three major sources namely:
a) crop; residue coefficients are derived from the ratio of by-product (Potentially Harvestable Residues): Product (Commercial Production data from FAO Production Yearbook 1989). Average values (20% moisture, HHV's): Cereals (1.3; 12. 77 GJ/t), Vegetables & Melons (1.0; 6.38 GJ/t), Roots & Tubers (0.4, 6.38 GJ/t), Sugar Beet (0.3, 6.38 GJ/t) and Sugarcane (0.55, 17.33 GJ/t, oven dry).b) forest; Potentially Harvestable residues are assumed to equal all residues generated during cutting and processing. For each country total Cut is calculated as 1.67 times "Roundwood Production."(FAO Forest Products Yearbook, 1989). Residues arise at the site of cutting are assumed to be 40% of Total Cut, and at the mills, assumed as 50% of "Industrial Roundwood". [Globally, "Industrial Roundwood" and "Fuelwood + Charcoal" are each equal to about half of "Roundwood Production." (15.96 GJ/t HHV, 20% moisture)], but such a ratio cannot be used at the country or regional level because of the country differences between cutting for fuelwood and for industrial roundwood. Calculation of on site residues from the total cut are not possible in the case of use for fuelwood and charcoal because of widely differing local practices; thus we assume a 40% residue from the total cut for both industrial roundwood and fuelwood + charcoal.
c) dung; Animals populations are derived from WRI, "World Resources; 1990-91." Washington, D.C. 20006. Each category is assigned a dung production coefficient which estimates the average daily dry dung production for each type of animal (Taylor et al., 1982; Senelwa A, K, Hall D, O,. 1991) i.e. Cattle (3 kg d-1; 15 GJ/t), Sheep & Goats (0.5 kg d-1; 17.8 GJ/t), Pigs (0.6 kg d-1), Equines (1.5 kg d-1; GJ/t), Camels & Buffaloes (4.0 kg d-1; 14.9 GJ/t) and Chickens (0.1 kg d-1; GJ/t). It is then assumed that 50% of total production is Potentially Harvestable. Recoverable Dung is then assumed to be 25% of Potentially Harvestable Dung i.e. 1/8th of total production, dry weight.
VII; Present commercial energy consumption is from BP, "Statistical Review of World Energy, 1990." FAO, "Forest Products Yearbook, 1969," for Fuelwood and Charcoal use only. No attempt is made to estimate any other form of Biomass Energy use by the FAO.
VIII; Present per capita energy using Col. VII data.
IX assumes total energy use of 140 or 310 GJ/cap. thus estimating present and future energy consumption by country.
X-XI show the percentage of either "present energy" use or energy use at 140 or 310 GJ/cap (from cols. VII and IX resectively) provided by 25% of recoverable residues alone.
XII-XIII indicate potential land use for biomass growth at a productivity of 10 t/ha/yr., to provide 140 or 310 GJ/cap (Col. IX). Col. XII shows total land needed for each country, and XIII the percentage of total land area.
XIV & XV uses 25% of recoverable residues and 10 t/ha/yr. to provide 140 or 310 GJ/cap., showing the total and percentage of each country's land area required.
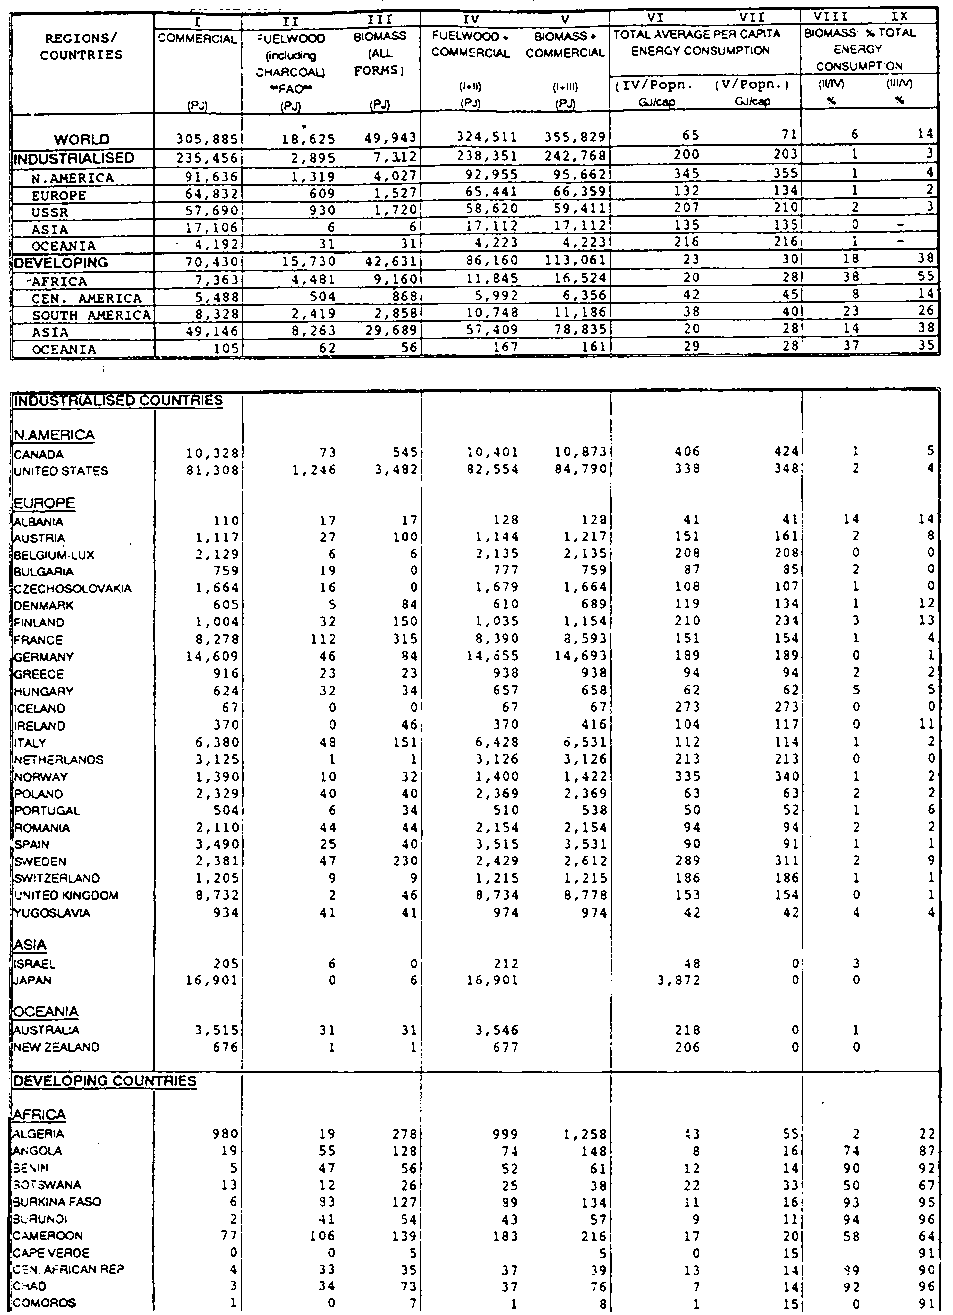
Table 10: Estimated total energy consumption by country a region (a)
Table 10: Estimated total energy consumption by country a region (b)
Table 10: Estimated total energy consumption by country a region (c)
Table 10: Estimated total energy consumption by country a region (d)
FAO fuelwood + charcoal consumption data is compared with a total biomass consumption estimate for each country
|
1 Tonne Oil Equivalent, TOE (GJ/t) |
42 |
|
Fuelwood Density (cubic metres/t) |
1.4 |
|
Fuelwood energy density (air dry. 20% moisture; GJ/l) |
15 |
Footnotes:
Col. I Commercial energy consumption data was derived from three data sources; i) North America, Western Europe and USSR (BP, 1991), ii) Eastern European and Developing countries predominantly IEA (1990) iii) remaining country data from the UN (1987).Col. II. Fuelwood = "Fuelwood + Charcoal" as from FAO Forests Products Year Book; 1990. FAO estimates total wood cut for firewood and for conversion to charcoal; no other form of biomass use for energy e.g. residues.
Col. III. Biomass energy consumption data was derived from: i) FAO "Fuelwood + Charcoal" (FAO. 1990), ii) the Biomass Users Network (BUN), which estimates all forms of biomass use for energy: so far detailed studies have been earned out for only 55 developing countries (Hall, 1991), iii) the United Nations Statistical Office, which includes various forms of biomass use for energy in their Energy Balances & Electricity Profiles publication (UNSO, 1990).
Due to the sparseness of biomass energy use data in both industrialised and developing countries, where no data is published we have estimated biomass use in developing countries by assuming that the per capita consumption of biomass for energy is 1 tonne of wood equivalent (twe)/cap for rural inhabitants and 0.5 twe/cap for urban inhabitants. 1987 population data is from FAO Agrostat database (1990) (FAO, 1991). Thus the order of preference for data sources was BUN>UNSO>per capita (Popn.) estimate.
Col. IV & V The different biomass energy consumption estimates (col. II & III) are added to the commercial energy consumption data from col. I.
Col. VI & VII Per capita total energy consumption (including biomass, Col. IV & VII) is calculated using 1987 population data from the FAO's AGROSTAT database (1990). (see table 10 for regional population breakdown)
Col. VIII & IX the percentage share of total energy consumption provided by biomass is calculated by dividing col. II by IV (col. VIII) and Col. Ill by V (Col. IX)
Table 11: SELECTED SUGARCANE AND PLANTATION WOOD FEEDSTOCK COSTS IN VARIOUS DEVELOPING COUNTRIES
|
Country |
Feedstock Costs in US$/GJ |
Electricity Production Costs c/kWhe |
|||
|
Sugarcane |
Plantation Wood |
Technology |
|||
|
Tops & Leaves |
Bagasse |
|
CEST |
STIG |
|
|
Brazila (1992) constant 1988 US$ |
1.19 (CEST)f |
1.18 (CEST) 1.68 (STIG) |
1.09-3.17 (for the Northeast Region.) |
13.45-7.06 |
6.70-4.40 |
|
Thailand (1990)b |
1.68-1.45 |
- |
- |
- |
- |
|
Costa Rica (1988)c |
0.95-1.42 |
0.28-1.10 |
2.51-3.17 |
4.8-5.1 |
4.1-4.0 |
|
Jamaica (1985)d |
0.58-2.02 |
0.97-2.21 |
1.00-1.50 |
4.8 |
- |
Source: Tugwell et al. (1988).a Costs of both the biomass feedstock and electricity vary as a result of predicted increases in productivity from the present (52 t/ha/yr.) to future sugarcane yields (71 t/ha/yr.) The efficiency with which the tops & leaves are collected is also predicted to improve from about 50% of total production presently to about 75% of total production in the future with further gains limited for environmental reasons. Ethanol in Brazil now (1992) costs about US$ 7.9/GJ or an average 18.5c/l.b These prices are competetive with oil costing US$ 2.19/GJ or US$ 19/barrel.
c Costs vary here due to increasing transport distances; even at further distances sugarcane residues are competetive with fossil fuel alternatives estimated to cost (constant 1985 US$): US$ 2.45-3.84/GJ for fuel oil, US$ 2.35-3.09/GJ for imported coal and US$ 3.79-4.22/GJ for indigenous coal.
d The cost (1985 US$) of sugarcane residues is dependant on the processing technology, with briquetting generally costings less than pelletizing. In Jamaica, also, the costs of biomass fuels are competetive with fossil fuels: residual fuel oil, US$ 2.9-4.00/GJ; Distilled fuel oil, US$ 5.4-7.50/GJ; and imported coal, US$ 1.43-2.08/GJ.
e Electricity costs are estimated from the feedstock costs of the biomass. For sugarcane residues the feedstock is derived from both the tops & leaves and bagasse produced from crushed sugarcane.
f CEST stands for Condensing Extraction Steam Turbine which is a robust and mature technology of relatively low efficiency (25-35%) compared to STIG (Steam Injected Gas turbine, about 40% efficient).
Table 12 Main characteristics of a Typical Charcoal kilna
|
Kiln diameter volume (base) |
5m | |
|
Nominal kiln volume (wood) |
36 - 44 steres (l) | |
|
Operating cycle | ||
|
|
Loading |
4 hrs. (2 men) |
|
|
Unloading |
5 hrs. (2 men) |
|
|
Carbonization |
96 hrs |
|
|
Cooling |
96 hrs |
|
Yield | ||
|
|
Charcoal (db) |
33% (in weight) |
|
|
Volumetric conversion efficiency rate |
1.9 - 2.0 steres per 1 m3 charcoal (2) |
|
|
Charcoal production efficiency |
1.8 - 2.4 stere/ha/yr |
|
|
Useful life of kiln |
4 years |
|
|
Annual charcoal production (appx.) |
5,400 m3 |
|
|
Volumetric efficiency charcoal to pig iron |
4.2 - 3.2 (3) |
a Source: Rosillo-Calle et al.(in press)
Notes
(1) Between 21.7-26.5 m (1m =1.66 steres) However, this ratio varies in practice according to the type of wood- e.g. one store of dry eucalyptus wood is about 0.6m, although this is not always the case.(2) The volumetric conversion efficiency rate varies considerably, depending on the type of kiln, management, wood characteristics etc. Efficiencies of 2.2-1.6 are also common.
(3) Volumetric efficiency charcoal to pig iron depends on many factors - from charcoal quality (e.g. density to the type of the pig iron kiln. In the most modern kilns efficiencies of up to 2.6 m/charcoal per one tonne of Dig iron have been achieved. In the future an efficiency of 1.9 m charcoal (and even better) can be expected to be achieved.
Sources:
Rivelli Rezende (1989), Neto (1991), Grupo Itaminas (1989).
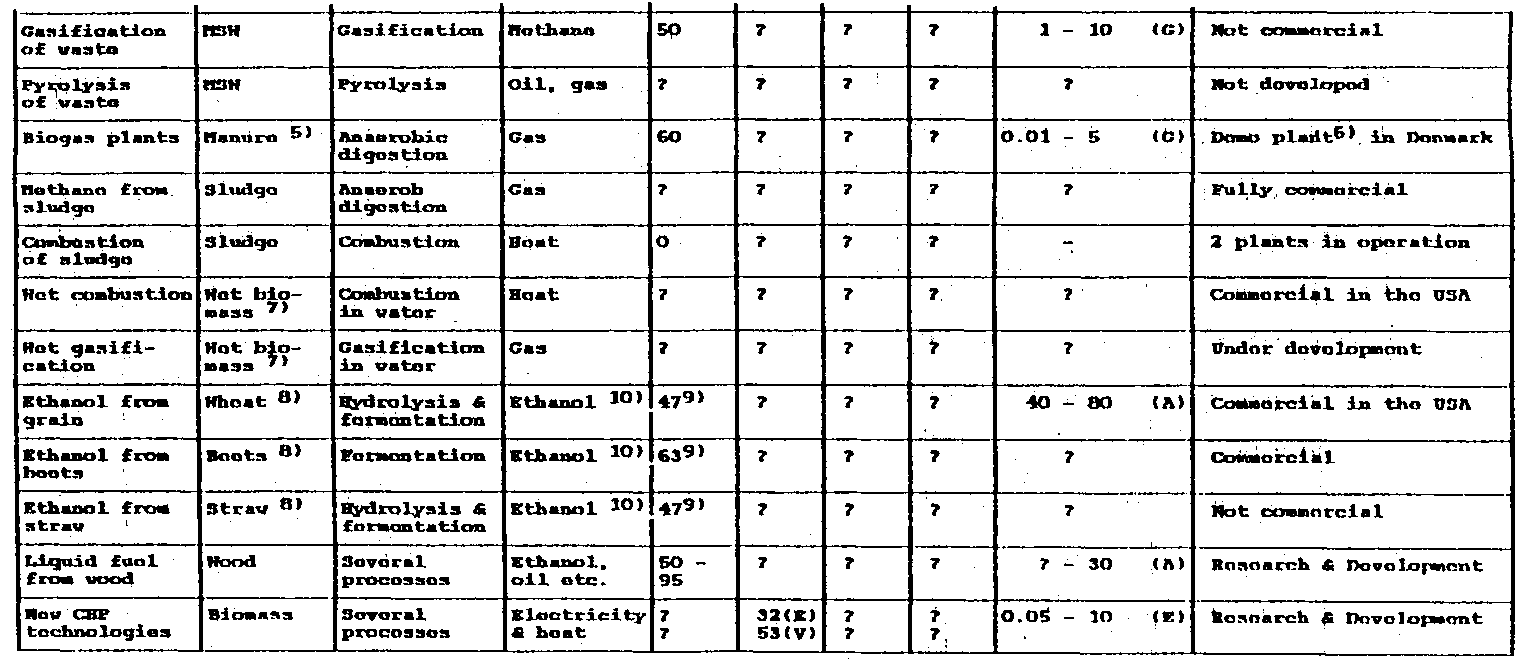
Table 13: Summary of Biomass Technologies
Source: WEC (1992) quoting Danish Energy Agency (1990)
Table 13: Summary of Biomass Technologies (cont).
Table 14: Electricity generating plants burning biomass fuels in the United States as of 1989*
|
State |
Number of facilities |
Installed capacity Mwe |
|||
|
Stand-alone |
Cogeneration |
Stand-alone |
Cogeneration |
Total |
|
|
Alabama |
0 |
15 |
0 |
375 |
375 |
|
Arizona |
2 |
0 |
45 |
0 |
45 |
|
Arkansas |
1 |
4 |
2.4 |
10 |
12 |
|
California |
64 |
30 |
736 |
255 |
991 |
|
Connecticut |
4 |
3 |
155 |
14 |
169 |
|
Delaware |
1 |
0 |
13 |
0 |
13 |
|
Florida |
12 |
15 |
314 |
474 |
788 |
|
Georgia |
0 |
5 |
0 |
36 |
36 |
|
Hawaii |
2 |
13 |
70 |
129 |
199 |
|
Idaho |
1 |
6 |
0.2 |
116 |
116 |
|
Illinois |
0 |
1 |
0 |
2 |
2 |
|
Indiana |
0 |
7 |
0 |
36 |
36 |
|
Iowa |
2 |
1 |
11 |
2.2 |
13 |
|
Kentucky |
1 |
1 |
1 |
1 |
2 |
|
Louisiana |
1 |
12 |
11 |
300 |
311 |
|
Maine |
4 |
22 |
88 |
704 |
792 |
|
Maryland |
2 |
2 |
214 |
94 |
308 |
|
Massachusetts |
2 |
9 |
38 |
252 |
290 |
|
Michigan |
3 |
13 |
78 |
247 |
325 |
|
Minnesota |
3 |
23 |
63 |
161 |
224 |
|
Mississippi |
0 |
10 |
0 |
230 |
230 |
|
Missouri |
0 |
2 |
0 |
60 |
60 |
|
Montana |
2 |
17 |
18 |
340 |
358 |
|
New Hampshire |
3 |
5 |
15 |
65 |
80 |
|
New Jersey |
2 |
0 |
14 |
0 |
14 |
|
New York |
11 |
17 |
154 |
425 |
579 |
|
North Carolina |
3 |
27 |
60 |
351 |
411 |
|
Ohio |
1 |
6 |
17 |
90 |
107 |
|
Oklahoma |
2 |
1 |
8 |
17 |
25 |
|
Oregon |
3 |
24 |
69 |
185 |
254 |
|
Pennsylvania |
0 |
9 |
0 |
144 |
144 |
|
South Carolina |
1 |
13 |
49 |
46 |
95 |
|
Tennessee |
2 |
12 |
6 |
43 |
49 |
|
Texas |
1 |
9 |
2 |
146 |
148 |
|
Utah |
0 |
1 |
0 |
20 |
20 |
|
Vermont |
5 |
3 |
80 |
218 |
298 |
|
Virginia |
0 |
9 |
0 |
136 |
136 |
|
Washington |
3 |
11 |
72 |
120 |
192 |
|
Wisconsin |
5 |
9 |
55 |
117 |
172 |
|
U.S. TOTAL |
149 |
367 |
2.459 |
5, 962 |
8.421 |
a. Williams & Larson (1992)
Table 15 Hosahalli (S. India). Wood Gasifier Based Electricity Generation.
|
|
Capital cost of 5 kW wood gas-based and diesel system (Indian Rupeesa) |
|
|
Woodgas System |
Diesel-only System |
|
|
Gasifier b |
16,000 |
- |
|
Engine + Genset c |
28,600 |
28,600 |
|
Voltage Stabiliser + Accessories |
6,000 |
6,000 |
|
Wood Cutter |
3,000 |
- |
|
Building |
5,000 |
5,000 |
|
Energy Forest |
5,000 |
- |
|
Total |
63,600 |
39,600 |
Source: Ravindrinath (1993).a The 1992 exchange rate is assumed to be Rs. 25 = US$ 1.b Life of gasifier is taken to be 50,000 hours and maintenance cost is taken as 5% for an operation level of 20 hours a day.
c Life of the engine is taken to be 20,000 hours and the annual maintenance cost is taken as 10% for 20 hours of operation a day.
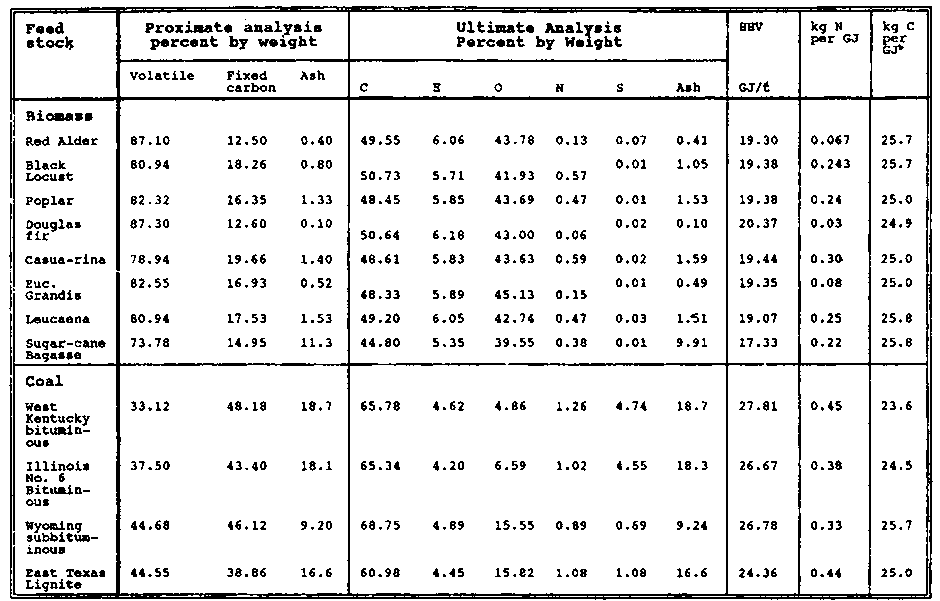
Table 16: Compositional data and heating values for biomass and coal (dry basis).a
a. Williams & Larson (1993)
b. calculated from data in table.
Table 17: Large Scale Danish Biogas Plants
|
|
Realized |
Budget |
Breakeven |
|||
|
1989 or 1988/89 |
1990 or 1989/90 |
1991 or 1990/91 |
Budget Plant |
Budget Plant |
Income (1992 |
|
|
(Published figures) |
(Published figures) |
(Published figures) |
1992 or 1991/92 |
1993 or 1992/93 |
prices) 1 |
|
|
V. Hjermitslev |
||||||
|
Sales |
1.020 |
1.567 |
1.975 |
2.502 |
2.775 |
|
|
Expenditure |
1.300 |
1.394 |
1.487 |
1.808 |
2.108 |
|
|
Income |
-280 |
173 |
488 |
694 |
6671+2 |
5 |
|
Vegger |
||||||
|
Sales |
1.106 |
1.450 |
2.069 |
2,635 |
2.925 |
|
|
Expenditure |
822 |
1.343 |
2.200 |
1.510 |
1.725 |
|
|
Income |
284 |
107 |
-131 |
1,125 |
1.2001+2 |
5 |
|
Skovsgård |
||||||
|
Sales |
1.793 |
2.036 |
2.302 |
2.776 |
3.425 |
|
|
Expenditure |
1.675 |
1.220 |
1.239 |
1.338 |
1.380 |
|
|
Income |
118 |
816 |
1.063 |
1.438 |
2.045 |
2.000 |
|
Davinde |
||||||
|
Sales |
569 |
543 |
534 |
615 |
615 |
|
|
Expenditure |
264 |
304 |
361 |
293 |
293 |
|
|
Income |
305 |
239 |
173 |
322 |
322 |
350 |
|
Sinding |
||||||
|
Sales |
1.027 |
2.668 |
3.488 |
5.120 |
5.325 |
|
|
Expenditure |
1.842 |
2.047 |
2.159 |
1,865 |
1.940 |
|
|
Income |
-815 |
621 |
1.329 |
3.255 |
3.385 |
2.300 |
|
Fangel |
||||||
|
Sales |
1.977 |
3.318 |
3.755 |
4.863 |
5.058 |
|
|
Expenditure |
863 |
1.785 |
2.530 |
2.252 |
2.343 |
|
|
Income |
1.114 |
1.533 |
1.221 |
2.610 |
2.715 |
2.403 |
|
Revninge |
||||||
|
Sales |
|
562 |
930 |
1.048 |
1.091 |
|
|
Expenditure |
|
436 |
895 |
570 |
593 |
|
|
Income |
|
126 |
35 |
478 |
498 |
470 |
|
Lintrup |
||||||
|
Sales |
|
2.088 |
5.850 |
6.950 |
7.228 |
|
|
Expenditure |
|
1.759 |
3.088 |
3.600 |
3.744 |
|
|
Income |
|
329 |
2.762 |
3.360 |
3.484 |
2.700 |
|
Ribe |
||||||
|
Sales |
|
680 |
4.378 |
7.604 |
7.908 |
|
|
Expenditure |
|
1.822 |
3.906. |
4.050 |
4.212 |
|
|
Income |
|
- 1.142 |
472 |
3.554 |
3.696 |
2.600 |
Table III. Company finances for the nine centralized biogas plants.1. The oldest plants, Vesler Hjermitslev and Vegger have received about DKK 145 m in the form of temporarily interest-free loans from the County of North Jutland with no repayment required until further notice. As a consequence, interest and repayment are less significant than for the other plains, and corresponding to this the required income is lower.
2. Vesler Hjermitslev. Vegger, Skovsgaard and Fangel have all had new engine/generator units installed. Sales are therefore expected to be considerably improved in future years.
3. Sinding, Revninge, Lintrup and Ribe anticipate increased sales of gas, primarily because teething troubles are expected to have been overcome.
4. Calculated annual average of capitalised servicing obligations, including operational credits and estimated re-investment (1992 prices). This calculation is primarily bound up with the actual debt, which in its turn depends on the construction subsidies received, and the financial performance up 10 dale.
5. The situation of frozen construction debts is special for the plants at Vester Hjermitslev and Vegger. Therefore the annual average of capitalised servicing obligations has not been calculated for these plants.
Source: OEA, Denmark, 1992
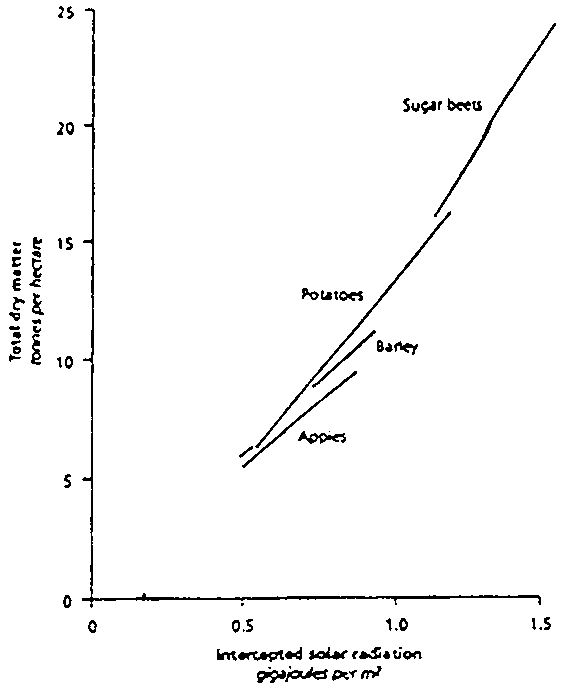
Figure 1: Relation between total plant matter at harvest and radiation intercepted by foliage throughout the growing season, for selected C3 plants grown under conditions such that the crops are well fertilized and the supply of water is adequate for good growth.
Source: Hall et al. (1992)
Figure 2 (a): Annual moisture index (P/PET)
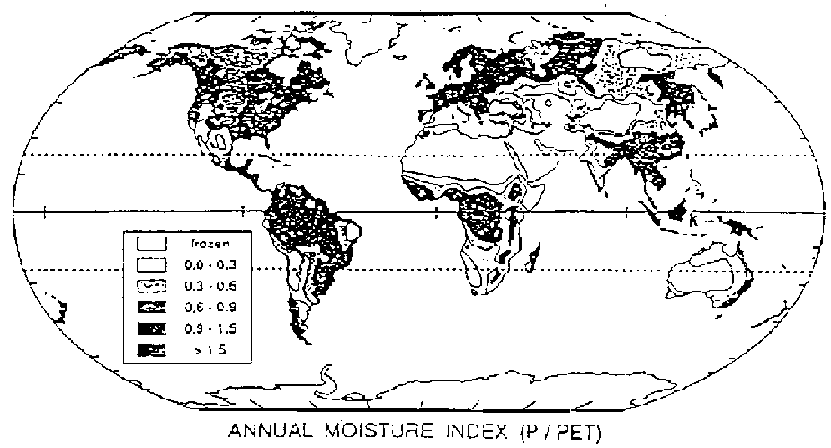
World map of the annual moisture index the ratio of the annual precipitation (P) to potential evapotranspiration (PET)], a measure of moisture availability for plant growth [81]. An annual moisture index of less than one implies a water deficit, which will limit plant growth, while a ratio greater than one implies that there is excess water, so that runoff might occur.
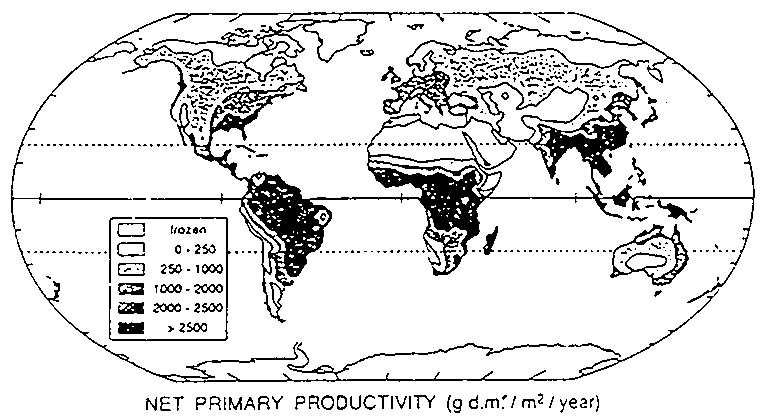
Figure 2 (b): Net primary productivity (g d.m/m2/year)
World map of net primary productivity in grams of dry plant matter per square meter per year. (Note that one gram per square meter per year = 0.01 tonnes per hectare per year). The net primary productivity values shown here were obtained by averaging values obtained from two models - the so-called 'Miami' and 'actual evapotranspiration-based sigmoid' modelsSource: Box & Meentemyer (1991)
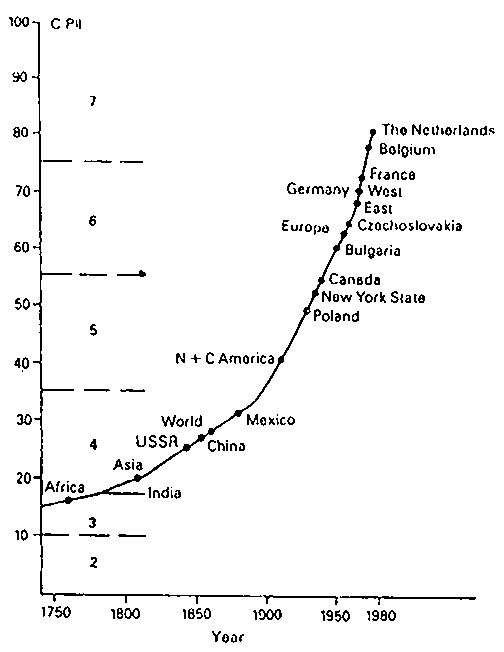
Figure 3 (a): The wheat crop production index (CPI) trend for the Netherlands from 1750 to the present. The wheat CPI for other countries in about 1970-75 is also shown for comparison.
Source: Buringh (1987)
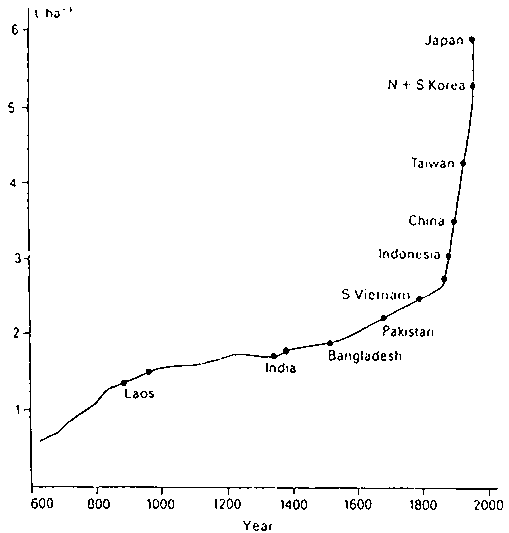
Figure 3 (b): Average rice yield in Japan, year 600 to present. The modern average yields of other nations are located on the yield curve for Japan.
Source: Hopper (1976)
Figure 4: Plantation Rotation Length and Standing Stock at 3, 6 & 12 tC/ha/yr.
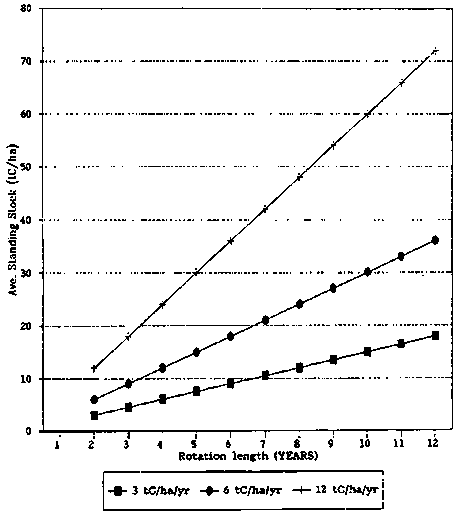
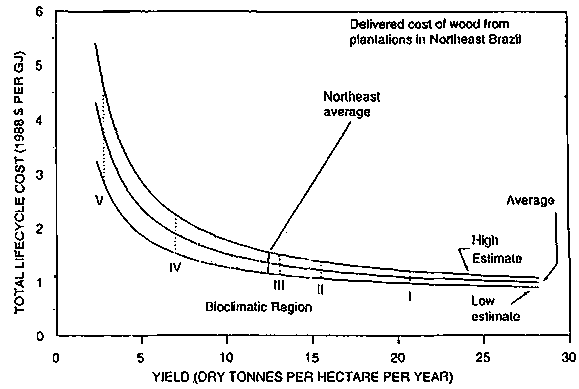
Figure 5a: Estimated high, low, and average costs of plantation grown wood versus plantation yield. Average costs by bioclimatic region are shown, as are the average costs in the Northeast.
Source: Carpentieri et al (1993)
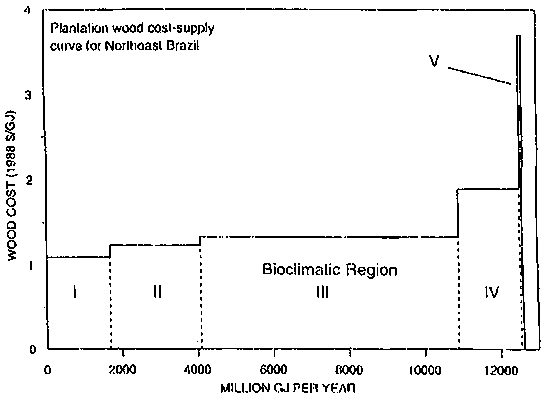
Figure 5b: Plantation wood cost-supply curve for Northeast Brazil. The average cost and the estimated total volume of wood that can be produced in each of the five bioclimatic regions are shown.
Source: Carpentieri et al (1993)
Figure 6: Purchasing power of sugar (1975 = 100%)
|
Year |
1973 (Jan) |
1973 (Dec) |
1975 (Average) |
1982 (July) |
1984 (Dec) |
1989 (July) |
1990 (July) |
1990 (Dec) |
|
Barrels of oil per tonne sugar |
76.6 |
43.8 |
41.9 |
5.1 |
2.8 |
19.4 |
16.8 |
9.5 |
|
Compared with 1975 (%) |
183 |
105 |
100 |
12 |
7 |
46 |
40 |
23 |
|
Sugar price ($ per tonne) |
230 |
224 |
401 |
115 |
80 |
301 |
269 |
218 |
|
Compared with 1975 (%) |
57 |
56 |
100 |
29 |
20 |
75 |
67 |
54 |
Source: Hall and de Groot. 1986. Updated from commodity price statistics, International Sugar Association and Institute of Petroleum, London.
Figure 7: Operating principles and temperature profiles for fixed bed (top) and bubbling fluidized-bed (center) gasifiers, and the operating principle for a circulating fluidized-bed gasifier (bottom).
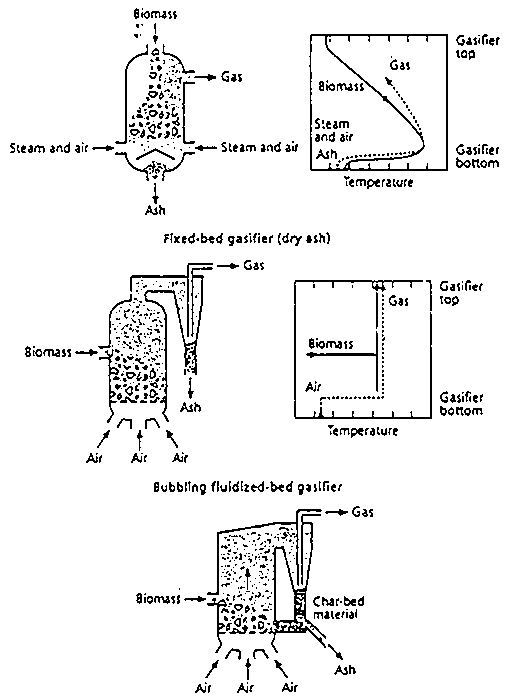
Source: Williams & Larson (1992)
Source: Williams & Larson (1992)
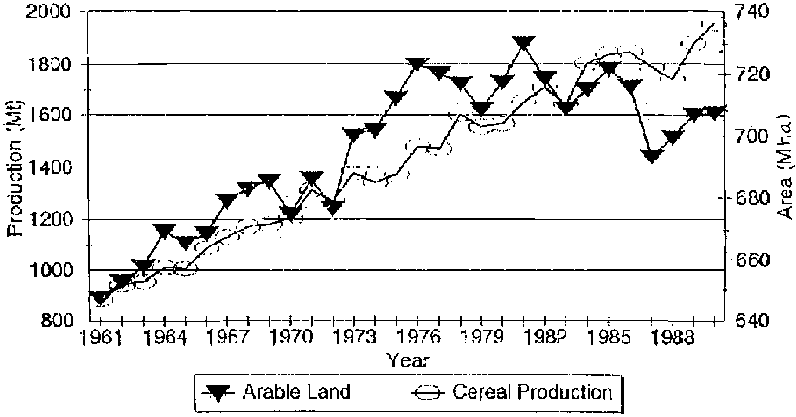
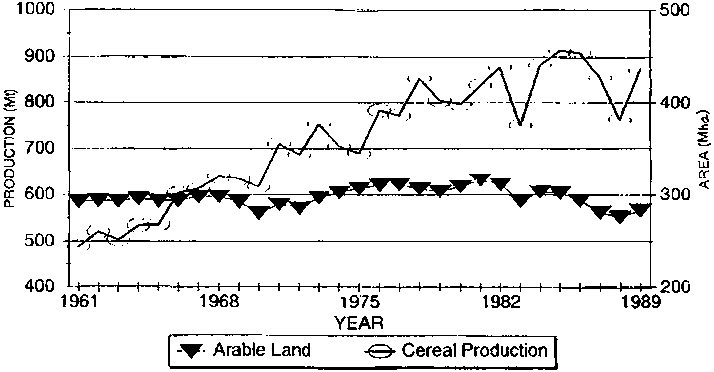
Figure 9a: Global Trends in Areas and Production of Cereals (1961-1990)
Source: FAO AGROSTAT Database (1990)
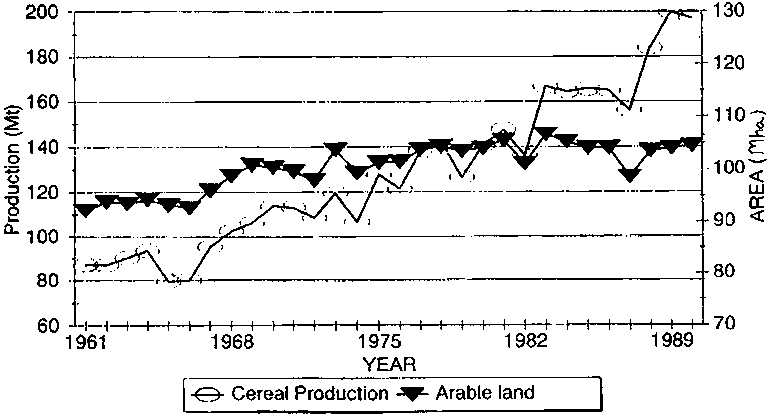
Figure 9b: Indian land Use and Food Production 1960 to 1990
Source: FAO AGROSTAT Database (1990)
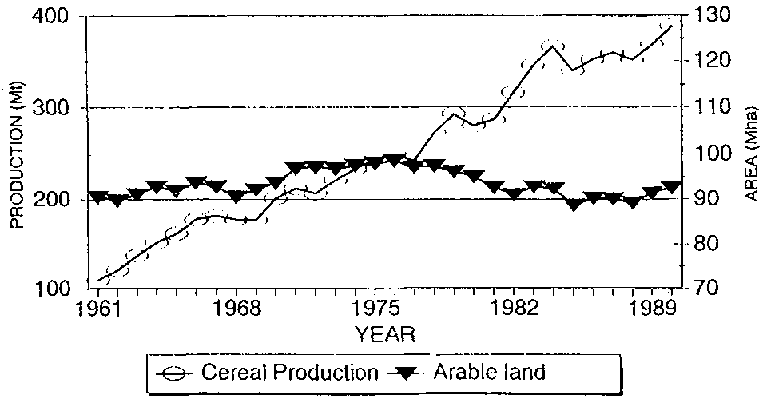
Figure 9c: Chinese Land Use and Food Production 1960 to 1990
Source: FAO AGROSTAT DATABASE (1990)
Figure 9d: Areas and production of cereals - Industrialised Region (1961 - 1990)
Source: FAO AGROSTAT DATABASE (1990)
FAO TECHNICAL PAPERS
FAO ENVIRONMENT AND ENERGY PAPERS
|
1 |
Natural resources and the human environment for food and agriculture, 1980 (E F S) |
|
2 |
Environmental impact assessment and agricultural development, 1982 (E F S) |
|
3 |
Management and utilization of mangroves in Asia and the Pacific, 1982 (E) |
|
4 |
Mangrove management in Thailand, Malaysia and Indonesia, 1985 (E F S) |
|
5 |
Rural energy planning in China and other developing countries of Asia, 1985 (E) |
|
6 |
Natural resources and the human environment for food and agriculture in Africa, 1986 (E F) |
|
7 |
Report on natural resources for food and agriculture in the Asia and Pacific Region, 1986 (E) |
|
8 |
Report on natural resources for food and agriculture in Latin America and the Caribbean, 1986 (E S) |
|
9 |
Environmental guidelines for resettlement projects in the humid tropics, 1988 (E F S) |
|
10 |
Solar drying of fish and paddy, 1989 (E) |
|
11 |
The briquetting of agricultural wastes for fuel, 1990 (E) |
|
12 |
A new approach to energy planning for sustainable rural development, 1990 (E) |
|
13 |
Bioenergy for development - Technical and environmental dimensions, 1994 (E) |
Availability: January 1994
|
Ar |
- |
Arabic |
Multil |
Multilingual |
|
C |
- |
Chinese |
* |
Out of print |
|
E |
- |
English |
** |
In preparation |
|
F |
- |
French |
|
|
|
P |
- |
Portuguese |
|
|
|
S |
- |
Spanish |
|
|
The FAO Technical Papers are available through the authorized FAO Sales Agents or directly from Distribution and Sales Section, FAO, Viale delle Terme di Caracalla, 00100 Rome, Italy.
Biomass is a flexible feedstock capable of conversion into solid, liquid and gaseous fuels which can substitute for fossil-based fuels with relatively small-scale investment. Global expansion of bioenergy systems could be influential in bettering both the socio-economic conditions and the environment of countries, and sustainable bioenergy production and commercialization could open new opportunities for improving the quality of life of rural people.
During the last few years new technologies, new perceptions on natural resource management and an enhanced concern about the environment have created a new context for bioenergy. This study examines the present role of biomass in the world's energy supply and calculates the potential for future biomass energy provision into the next century. It looks at examples of present biomass production and conversion to both modern and traditional fuels. Environmental effects of biomass use are examined on the global scale, considering health and sustainable production practices. Policy issues at the local and international level are discussed. It is hoped that this publication, prepared by two of the most eminent researchers on the topic, may interest and help others pursuing efforts in the bioenergy field.
ISBN 92-5-103449-4
ISSN 1011-5374
M-08
T1804E/2/2.95/500
![]()
![]()
![Variation of water-use (WUE) with increasing concentration of atmospheric CO2 for selected plant species [80]. The WUE is measured in milligrams of CO2 (net) fixed in photosynthesis per gram of water transpired. The atmospheric concentration of CO2 was 635 mg m-3 (353 ppm) in 1990."](t1804e0d.gif)