![]()
![]()
![]()
Gérard DE WISPELAERE
Abstract: Geographic Information Systems (GIS) serving to facilitate decisions regarding the ways to combat animal trypanosomiasis are constructed by mapping a certain number of variables including vegetation classes and land use in general. Digital images from satellites with high spatial resolution (LANDSAT TM and SPOT HRV) provide a source of information which is both accurate and synoptic for producing these maps on the basis of brief yet specific field surveys.
The case presented, that of the Adamawa plateau in Cameroon, illustrates the type of results obtained by processing SPOT satellite data for the mapping of vegetation classes and land use in the region infested with Glossina morsitans sub-morsitans.
The results are analysed as is their integration in a GIS adapted to a programme of combating Glossina infestation.
1. GEOGRAPHICAL FRAMEWORK OF THE STUDY
The objective of this study is to test, at the request and on behalf of the Special Mission for the Eradication of Glossina (SMEG) of the Ministry of Livestock, Fisheries and Animal Industries, the capabilities of high resolution satellite imagery for the mapping of potential Glossina habitats in a test area on the Adamawa plateau in Cameroon.
The study area is located on the Adamawa plateau in Cameroon, to the North East of Tignere (Fig. 1). The climate is classified as high-altitude subhumid, with an average annual rainfall of 1 400 mm.
The altitude of the plateau itself is 1 100 metres and its vegetation tree and bush savannah. There are also clearly-defined mountains with summits of over 1 800 m, the most elevated being occupied by the grassland vegetation Sporobolus africanus much grazed by the herds of the Mbororo. The plateau is bounded on the Western side by a steep slope falling to the lower Koutine plain (average altitude 700 m).
The land is little used for agriculture, but there are many bush fires, mainly on the plateau and in the Koutine plain.
2. METHODOLOGY
According to the experts, the savannahs occupied by Monotes kerstingii and Uapaca togoensis are even greater potential biotopes for G. Mortisans submortisans than the already recognized savannah woodlands occupied by Isoberlinia doka. In the study area there would recognized savannah woodlands occupied by Isoberlinia doka. In the study area there would also appear to be a high correlation between these savannah woodlands and the presence of G. morsitans submortisans (D. Cuisance, verbal communication).
Consequently, this completely new experimentation is aimed at identifying, localizing and mapping the various types of “glossina habitats” in the region by mapping the woody plant formations of the savannahs and, in particular, by distinguishing the formations with Monotes kerstingii and Uapaca togoensis.
This requires a physiognomic typology of woody vegetation adapted to satellite data.
In order for plant formations to be recognized and identified on a satellite image, several conditions relating to the image acquisition must be observed and numerous field surveys performed.
Satellite images must be taken when contrast between woody and herbaceous vegetation is maximum, when the area is free of clouds and dry mists and traces of fires are minimal.
Field surveys are essential to ensure that the actual ground situation and the image correspond as closely as possible. A further objective of field observation is to establish the typology of the various kinds of vegetation at the level of perception of the satellite's sensor which, in the case of SPOT, corresponds to whole landscapes and states of land surface.
Influence of the phenological stage of woody strata
The calendar of foliation varies according to the species and the reactions to the frequent fires. Most woody plants come into leaf in March-April. This is true for the Isoberlinia, the Lophira and the Terminalia whose crowns are bright green in colour, contrasting sharply with the environment. On the other hand, the Monotes and the Uapaca are still almost bare at this time although they do not completely shed their leaves. Conversely, in November and December, they still have dense foliage whereas most of the other woody plants have lost theirs.
Thus the landscapes are different in November than they are in March. Consequently images taken in November and December portray a situation in which the stage of foliation contrasts with that observed during the field missions (February-March).
Considering that satellite images, especially SPOT images, are particularly sensitive to the degree of chlorophyllic activity in vegetation and if, as has been observed, the Monotes and Uapaca come into leaf some time later than the other woody species, it would then be possible to discriminate these two groups of vegetation.
It would nevertheless be desirable to be able to invert the process and have images taken in February/March in order to compare the situations.
Fig. 1
LOCALISATION DES SCENES SPOT
(acquises en décembre 1990)
3. FIELD SURVEYS
3.1 Vegetation surveys
Field surveys were performed at the end of the dry season (March 1991 and February 1992) whereas the images were taken in November and December 1990 at the start of the dry season, representing a considerable time-lag as regards the phenology of the vegetation.
Over 40 surveys were made during these missions.
The sites for the surveys were selected in the field by reasoned choice, aided by enlargement of SPOT colour composites to 1/100 000, according to the possibilities of access and the colour characteristics of the images, the latter being, as a rule, related to a type of landscape.
Each of the sites was localized in terms of geographical coordinates by using a “Global Positioning System (GPS)”. These coordinates, recorded in the geodesic system of reference of the satellites of the GPS network were subsequently transformed into MTU cartographic coordinates by the geodesic department of the French National Geographic Institute at Saint-Mandé.
Since the observations were made at the end of the dry season, the vegetation surveys only concerned the tree and woody shrub strata of the savannahs and did not investigate the gallery forests.
As estimates of global cover were made by direct observation of the proportion of sky visible through the canopy they are influenced by the degree of foliage present at the time of observation. Consequently they vary according to the phenological stage and, above all, these evaluations are very sensitive to the observer's interpretation. One single site was subjected to exhaustive counting for training purposes using the circular counting technique over 1 ha. It would be advisable to re-use this unfortunately very time-consuming technique during the two main seasons of vegetation, on the same sites, in order to standardize the observations as regards definition of woody cover.
In this respect, by counting on enlarged vertical aerial photographs, at a scale of close to 1/10 000, much greater precision could be obtained for less work.
Physiognomic typology of vegetation in the study area
Open forest
Plant formation where the tree stratum remains open even though greater than 60 percent.
Wooded savannah
Plant formation comprising a continuous herbaceous stratum and a woody stratum where
trees outnumber shrubs with a total woody cover of between 35 and 60 percent.
Tree and bush savannah
Plant formation with a total woody cover of less than 35 percent and where the tree stratum
is greater than the shrub stratum.
At under 15 percent, the tree savannah is “open”.
A tree and bush savannah may be called orchard savannah or park savannah when its trees
are isolated but of a fair size.
Shrub savannah
These are savannah where the woody stratum comprises mainly shrubs with a cover of
between 5 and 40 percent.
When cover is between 5 and 10 percent the shrub savannah is referred to as “open” and,
when cover is 30 to 40 percent, “dense”.
Grass savannah
A grass savannah has a woody cover less than a few percent.
Grassland
Grassy formation at high altitude.
3.2. Cartographic surveys
Since no accurate, recent topographic maps were available, it was necessary to “obtain” in the field, during the February 1992 mission, the geographical coordinates (x, y and z) of a certain number of points known as “observation points” that were clearly identifiable on the images. These are characteristic topographic details such as the crossing of tracks, bridges, etc. In addition to these landmarks, all villages encountered were identified and localized. Some tracks which were not visible on the images were also drawn.
4. REMOTE SENSING
4.1 Data used
Since no previous image of this region was available in the SPOT IMAGE company catalogue, two SPOT scenes were acquired specifically for the project (Fig. 1) by making a programming request in September 1990.
The scene references are as follows:
KJ 84/334 recorded on 28 December 1990 for the KONTCHA region;
KJ 85/334 recorded on 2 December 1990 for the TIGNERE region.
The quality of these scenes in multispectral mode at a resolution of 20 m is excellent despite traces of frequent extensive fires on the landscape. They were given by SPOT IMAGE to CIRAD-EMVT at the end of January 1991.
The topographic mapping data, from 1955, on the other hand had become totally outdated. Moreover, since it was produced from a “hasty” photogrammetric preparation, it could not be used for the correction of SPOT images.
4.2 Geometrical preprocessing
This basically concerns the geometrical correction of digital images, that is to say transformation from the preprocessing level 1B, a raw level in which the images were bought, into the cartographic level, or level 2, in order to position the field survey sites and the superimposing of the map, produced from the processings, on a regular cartographic background. Since this type of document was not available, the NGI was asked to make a MTU coordinate correction grid to recalculate the geographical coordinates of all the points located by the GPS in the field.
When corrected in this way, the image is of a much higher quality than the old topographical map of 1955, despite lacking some of the geometrical characteristics of a regular map because the distortions deriving from the terrain and the viewing angles remain uncorrected since a digital model of the land was not available.
4.3. Thematic classification
The objective of a classification, in remote sensing, is to produce a cartographic representation corresponding as closely as possible to the actual ground situation, derived from spectral values of pixels composing the “source” digital image (raw or derived channels) according to a specific nomenclature (legend).
The methods of classification used in this survey fall under the category of “supervised” as they depend on the assistance and decisions of an expert.
This assistance is both taxonomic, through the definition of categories of landscapes (or taxons), and geographical since the decisions are based on the knowledge of the nature and spatial distribution of the objects to be mapped.
On the basis of observations made in the field, an initial legend was compiled for the study of the spectral characteristics of the themes.
The principle of the classification consists in calculating the covariance matrix and the vector of the coordinates from the centre of a cluster of points, for each basic unit of the areas explored which are the groups of pixels, constituting the representative samples of the themes researched, identified during the field study.
Examination of the two-dimensional histogram of channels XS3 and XS2 (Fig. 2) shows how little difference there is between the themes which one is attempting to identify. The greater the variance of the class, the more the ellipses overlap and consequently the greater the ambiguities become.
Fig 2: Histogramme bidimensionnel des thèmes
Scène de TIGNERE
(Après étalement de dynamique)
The main problem, however, lies in the spectral variability of the same theme according to its geographical location. A wooded savannah with Monotes, on the Tignere plateau, for example, does not have the same “spectral signature” on the equally wooded neighbouring terrain because of illuminance and slope.
Each plant formation can therefore differ considerably in “radiometric response” according to its topographical position, independently of its phenological stage as previously mentioned.
Plant formations on hilly ground which are not significantly different from those of the plateau or Koutine plain, have much higher spectral responses than the others. The slopes in the shade, which have identical vegetation, are extremely different from those which were exposed to the sun at the time of image acquisition.
In general, the spectral responses of the formations on the Koutine plain also differ greatly from that of the Tignere plateau.
One notes in particular that it is not possible to reliably distinguish shrub savannah from tree and bush savannah, at least no more than it is possible to differentiate dense shrub savannah and wooded savannah. Vegetation structures can only be significantly discriminated when they are directly related to crown foliage density at the time of the viewing.
Since the classifications are based on radiometric separation of the objects, it is out of the question to discriminate, by radiometric procedure alone, types of vegetation whose spectral values are locally confused. Thus it was necessary to use other processes to eliminate a certain number of ambiguities.
In particular, the images were cut, using Computer Assisted Photointerpretation (CAPI), into three sets for the Tignere region (mountain area, Koutine plain, Tignere plateau) and in two sets for the Kontcha region.
Each set was then analysed individually and the results combined at the end.
5. MAPPING OF VEGETATION TYPES
5.1 Legend of cartographic units
SETTLED LAND
| V | : Inhabited area, town, village |
| CJ | : Crops and fallow or degraded shrub savannah (old fallow) |
| F | : Fires |
There are a large number of these on the landscape. More are found on the image of Kontcha than on that of Tignere where they are mainly grouped on the plateau itself.
The fires totally mask the type of vegetation, but the more herbaceous formations would appear to be also the most frequently burnt by the stock-raisers for regrowth in the dry season. They could therefore usually be likened to the clearest shrub or tree and bush savannahs.
NATURAL VEGETATION
G : High grassland occupied by Sporobolus africanus
This formation which is much frequented by the cattle raisers is located on the plateaux at an altitude of over 1 200 m. It is heavily grazed showing many signs of degradation. The woody stratum is only present in the form of riparian bands along the axes of the thalwegs.
oG : Overgrazed or sparse grassland, facies of the preceding formation, occupies the highest areas of the plateaux but can vary according to the season (R. 22).
gSh : Grass or open shrub savannah on highlands
Vegetation of the slopes of the Tchabals and the cliff of Sadek. The woody stratum is open but the riparian bands may be masked by the shadow of the slopes (R. 23).
hstbS : Highland shrub or tree and bush savannah
These are usually fairly dense shrub formations, often occupied by Monotes and Uapaca and always on hilly ground under 1 200 m in altitude. Almost all of the slopes in the shade have been assigned to this class since it was impossible to discern another formation.
Their discrimination is based on a topographical criterion and not on their spectral response, the latter being very close to that of the tree and bush savannahs on the plain.
sSw : Dense shrub savannah, or tree and bush or wooded savannah
This formation is always densely woody and often dominated by Monotes and Uapaca (R. 9, 11, 18, 29, etc.). Isoberlina sp. formations are, however, also found although they cannot be separated on the images of this season (R. 32). Gallery forests, often localized at the head of thalwegs, are also grouped under this cartographic category, since they cannot be individualized reliably due to their lack of radiometric contrast.
stbS : Shrub to tree and bush savannah
Rarely abundant, this formation is a transition between wooded savannah and the more or less settled shrub savannah of the plains and plateaux (R. 31, 32, 15).
sotbS : Shrub or open tree and bush savannah
The most frequently occurring formation by far. Woody cover is generally open, the pastoral lands are regularly burnt and the network of riparian bands, not visible on the SPOT images, is relatively loose.
vosS : Very open shrub savannah
This formation is clearly an evolved form of the savannah. There are frequent signs of degradation and they too are regularly burnt.
gSmb : Grass savannah along major beds
This type of formation which is clearly hydromorphic in nature, is the most difficult to map. It can only be distinguished from shrub or open tree and bush savannahs of the plains and plateaux by its network configuration, along the water courses.
fgS : Floodplain grass savannah
This characteristic formation has only been found in the mayo Mba Kana. Its vegetation which is still green in December appears very clearly on the image of the Tignere region.
6. ASSESSMENT OF THE USE OF REMOTE SENSING
High resolution satellite data have real potential for the mapping of the physiognomy of tropical vegetation. Differentiation of the groups of species was not possible. The cartographical units retained correspond to a physiognomic typology produced by classification of woody formation according to cover density. The spectral response of a plant formation varies in relation to the position of this formation in the toposequence. Therefore, in order to obtain reliable mapping, it is necessary to use other information than the satellite data, such as the terrain, to stratify the land into homogeneous sections within which relations between objects and images are constant. These methods are however complex and difficult to automate. Processing was a long and delicate process and the lack of field data had to be supplemented by the use of aerial photographs at 1/50 000 which, despite being a little old, were precious in eliminating certain ambiguities.
At the thematic level, we can see that bush fires obscure a large part of the land (on the image of Tignere, they account for over 10 percent of the area examined). The most densely wooded formations are without doubt also the ones which burn the least, so the resulting map is not too inaccurate.
The simplified map in Figure 4 shows the distribution of the various types of woody formation in the Tignere region.
Fig. 3
REPUBLIQUE DU CAMEROUN
Région de Tignère
Extrait de la Carte des types de végétation
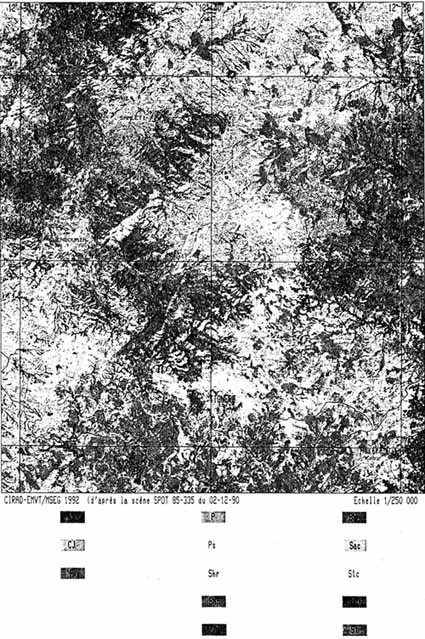
Fig. 4
REPUBLIQUE DU CAMEROUN
Région de Tignère
Localisation des formations ligneuses denses
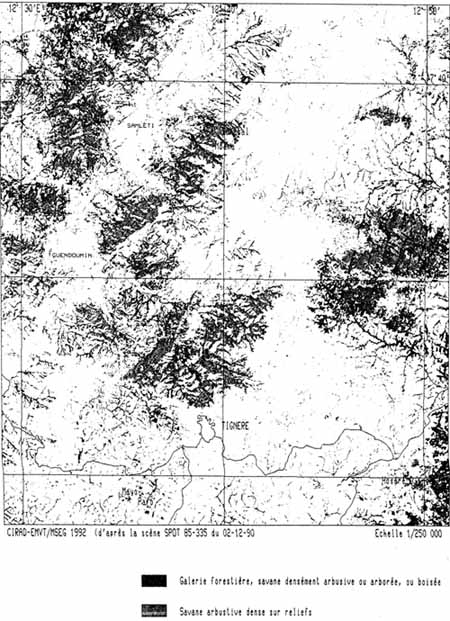
The densest woody formations, comprising mainly Monotes kerstingii and Uapaca togoensis, are found on both sides of a median line formed by the Tchabals Gandaba and Mbana. Connections are possible between the densely wooded regions of the Koutine plain to the West and the Adamawa plateau to the East, via narrow gallery forests which cross the Tchabals cols.
It is probably only possible to discriminate the formations dominated by M. kerstingii and U. togoensis from those with Isoberlina sp. by using, simultaneously, images from November-December and from March-April.
7. GIS POTENTIAL
It would appear that possible habitats of Glossina morsistans submorsitans in savannah regions cannot be detected by mapping the woody formations with the assistance of satellite data alone, even by using high resolution data.
Complementary data extracted from sources other than remote sensing (hypsometry, hydrography, etc.) must be used in order to eliminate some of the classification ambiguities. Monitoring the extension brushwood and the colonization of new areas is also important when studying the distribution of the tsetse fly. Furthermore, land use categories (stockraising, wildlife, agriculture) are other important factors which should be mapped and introduced into a GIS in order to compare then with the Glossina surveys and determine high-priority intervention areas.
Nevertheless the relevance and coherence of the variables are more important than their number. The GIS should not become an objective in themselves, but should be a real help in decision-making.
8. CURRENT RESEARCH AT CIRAD-EMVT ON GIS APPLIED TO LIVESTOCK DEVELOPMENT
Several teams are working on GIS development in the department's scientific programmes.
These programmes, confined mainly to Africa, are directed essentially toward land management.
In Senegal, an EMVT team, in association with the ISRA Dakar, is working in Casamance on the utilization of agropastoral land area, at the field level, by monitoring herd displacement in relation to the environmental resources.
In Zimbabwe, another team is establishing a GIS for ARDA (Agricultural and Rural Development Authority) on the constraints of animal production in a traditional environment. Upon completion, this should make it possible to extend and adapt the notion of ecopathology to traditional production systems in the South. A wildlife/livestock comparative ecology component is trying to assess the environmental impact of ruminant grazing habits.
At the department headquarters, in collaboration with our partners, Burkinabé and other departments of the CIRAD, a pilot study is planned on the use of a GIS in mapping the agropastoral zone in the west of Burkina Faso. The procedure studied should permit a dynamic approach to land use and easy updating of rapidly changing variables.
BIBLIOGRAPHY
Achard F. 1989
Etude des rythmes saisonniers de la végétation en Afrique de l'Quest par télédétection
spatiale.
Thèse doctorale Univ. Paul Sabatier, Toulouse, 243 p.
Boudet G. 1977
Contribution au contrôle continu des pâturages tropicaux en Afrique occidentale.
Rev. Elev. Méd. vét. Pays trop., 30, 4, 387–406.
Boudet G. 1984
Manuel sur les pâturages tropicaux et les cultures fourragères.
Paris, Min. Rel. ext. Coop. Dév., (Coll. Manuel et précis d'élevage), 4e ed. IEMVT,
266 p.
Boutrais J. 1974
Les conditions naturelles de l'élevage sur le plateau de l'Adamaoua (Cameroun).
Paris, ORSTOM, Cah., sér. Sc. hum., vol. XI, No2, 145–198.
Boutrais J. 1983
Elevage soudanien (Cameroun-Nigéria). Des parcours de savane aux ranches.
Paris, ORSTOM, coll. Travaux et documents No 160, 148 p., photos et cartes.
Boutrais J. 1991
Les populations pastorales et les glossines en Adamaoua.
Maisons Alfort, IEMVT/MSEG/Banque Mondiale, 64 p.
Buxton P.A. 1955
The natural history of Tsetse flies.
London, Lewis H.K. & Co. Ltd, London School Hyg. Trop.
Med. mem. No10, 816 p.
César J. 1990
Etude de la valeur pastorale et production biologique des savanes de Côte d'Ivoire et
son utilisation par l'homme.
Thèse doctorale Univ. Paris VI, 642 p.
CIEH, ASECNA, ORSTOM 1990
Précipitations journalières de 1973 à 1980.
Paris, Dir. Météo. nationl. Cameroun, ASECNA, ORSTOM, 497 p.
Cuisance D.
La lutte contre les glossines dans l'Adamaoua (Cameroun). Compte rendu de situation
en février 1989 et propositions de programme.
Banque mondiale, B.D.PA, IEMVT, Maisons-Alfort, 1989, 33 p. avec annexes.
Cuisance D., Tacher, G., Clair, M., Ndoki, N., Muller, P.
Lutte contre les glossines. Bilan et perspectives. Banque mondiale, B.D.P.A.,
I.E.M.V.T. Maisons-Alfort, Mars 1987, 289 p.
Cuisance D. 1991
Lutte contre les glossines en Adamaoua (Cameroun). Bilan de la situation et
recommandations.
Maisons-Alfort, IEMVT/MSEG/Banque mondiale, 53 p.
Geerling C. 1982
Guide de terrain des ligneux sahéliens et soudano-guinéens.
Wageningen, Meded. Landbouwhogeschool, 340 p.
Morel P. 1983
Guide pour la détermination des arbres et des arbustes dans les savanes ouest-africaines.
Maisons-Alfort, IEMVT, Manuel pour l'école de lutte anti-tsé-tsé, 162 p.
Piot J. 1969
Végétation ligneuse et pâturages des savanes de l'Adamaoua.
Rev. Elev. Méd. vét. Pays trop. XXII, No 4, 541–549.
Rippstein G. 1986
Etude de la végétation de l'Adamaoua; Evolution, conservation, régénération et
amélioration d'un écosystème pâturé au Cameroun.
Maisons-Alfort, IEMVT/IRZ, Col. Etudes et synthèses, IEMVT No 14, 366 p.,
photos.
![]()
![]()
![]()