![]()
![]()
![]()
L. Lönnstedt
Lars Lönnstedt is with the Department of Forestry-Industry-Market Studies at the Swedish University of Agricultural Sciences, Uppsala, Sweden. This article has been adapted, with permission, from an original version published in the Scandinavian Journal of Forest Research, (1993) 8: 134-143.
This article analyses the implications of the Swedish forest policy with respect to the sustainable production of high-value goods from private non-industrial forests. The study constitutes a good example of the potential of policy analysis in the formulation, implementation and modification of forest policy.
The purpose of this article is to demonstrate that the opportunity costs of the management strategies recommended by the Swedish forest policy are economically significant. To this end, the yield and economic returns of four non-industrial management strategies were calculated and compared using a simulation model based on data from a recent management plan.
The principle of sustainable yield has long been part of the Swedish forest policy. Although not strictly formulated until the Forestry Act of 1948, the principle that today's harvested volume must not exceed the available volume of tomorrow can be traced back to the Forestry Act of 1903 (Stridsberg and Mattsson, 1980). In addition, the forest policy aims at achieving high quality and an even age distribution.
The Swedish Forestry Act of 1989 recommends a management strategy for sustained high yields of valuable timber, referred to here as the Balance Strategy. The Act allows for a range of variations on this strategy, although it establishes both a minimum cutting volume for a ten-year period and a maximum final cut area, which are referred to in this article as the Minimum and Maximum Strategies, respectively.
The National Board of Forestry stipulates that, if more than 30 percent of the forest area is older than the minimum clear-cut age minus ten years, then a certain portion of the oldest forests should be clear-cut over a ten-year period. The share to be cut is defined by a calculated normal annual clear-cut area for the region, adjusted by the portion of mature forest of the estate. If the estate produces more than 1 000 m³ per year in annual increment, and stands older than the minimum clear-cutting age are available, clear-cuts should made during every ten-year period.
Two rules define the maximum cutting volume:
· the stand must have attained a minimum age before clear-cutting is allowed. The average minimum age for a clear-cut is approximately 90 years but it varies between stands because of differences in growth potential;· no more than 50 percent of the estate's forest land may be in the age class between zero and 20 years.
The three strategies foreseen under the Forestry Act were compared with a management plan known as the Economic Strategy, under which, if return on the forest capital for a stand falls below the opportunity cost for the forest owner, the stand is cut. Capital is defined as the stumpage value of the stand plus the land value. Return is calculated as the increase of the stumpage value between two years in relation to the total value of the stand in the first year.
An important tool for achieving the goals of the Swedish forest policy is the national forest management plan which has been compulsory since 1983. The plan consists of two parts: the first describes the state of the forest while the second, building on the principles of the forest policy, outlines when and what sylvicultural activities should be performed in different stands.
POLICY ANALYSIS
In a simulation model (detailed in the next section), the four strategies were applied to an estate situated about 100 km north of Stockholm, similar in its characteristics to a "typical" forest holding (Tables 1a and 1b). The biological and economic consequences of employing each strategy for 100 years were calculated and compared by the simulation model. Clear-cuttings and thinnings were assumed to be carried out in the middle of each ten-year period for Balance, Maximum and Minimum Strategies. Clear-cuttings followed the rules of the Forestry Act. However, for the Economic Strategy, stands were clear-cut on the basis of the specified opportunity cost.
TABLE 1a. Basic characteristics of sample forest holding
|
Holding |
Total area (ha) |
Average standing volume/ha |
Average site class (m³ sk/ha) |
Percentage of mature stands (m³ sk/year) |
|
Sample forest |
76.2 |
123 |
6.25 |
30 |
|
Average forest |
60.0 |
136 |
5.9 |
26 |
Note: 1 m³sk = 0.83 m³.
TABLE 1b. Species distribution in sample forest holding
|
Holding |
Scotts pine |
Norway spruce |
Non coniferous |
|
Sample forest |
57 |
39 |
4 |
|
Average forest |
44 |
41 |
15 |
Thinnings were done according to the general practice - approximately 30 percent of the stand in question. Three thinnings per rotation period are normal at 30, 50 and 70 years.
When applying the Balance Strategy in accordance with the forest policy, the harvested volume for the ten years must not exceed the available volume of any ten-year period in the future. No fellings were made in stands that were below a certain age, depending on different features of the stand, such as species and soil.
The average standing volume was slightly increased because of the large proportion of trees in young age classes. When applying the Minimum Strategy, necessary thinnings were made to preserve the forest for the future. In compliance with the Act, clear-cuttings on 6.8 ha were necessary among the oldest stands. When applying the Maximum Strategy, 18.2 ha were cut without coming into conflict with the Act. Necessary thinnings were performed. The rotation period for each stand met the minimum requirement of the Act. Application of the Economic Strategy, however, was unrestricted, i.e. no maximum harvesting rate was applied.
The economic values of the strategies are expressed as the net present value. Expected future revenues and costs are discounted by the rate of return. The rate of return is often called the opportunity cost because it is the return forgone by investing in the project rather than in securities.
Two different interest rates were used: 2 percent and 4 percent. It is noteworthy that these are real interest rates with the effects of inflation removed. Södersten (1987) has shown that the real interest on capital invested in Swedish industry was 2 to 4 percent over the period 1965-1985.
Calculation
The biological and economic consequences of the applied forest management strategy were calculated with the help of a decision support system developed for non-industrial private forest owners (Hansson, Lönnstedt and Svensson, 1990). This system consists of six modules: growth, forest economy, economy of other sectors (e.g. agriculture), wages, total economic result, budget and tax calculations. For this study, the growth and forest economy modules were employed. These two modules are written in the DYNAMO computer simulation package and use the Professional DYNAMO Plus commercial software package designed for personal computers.
Growth and yield module. This module calculates growth and the development of the standing volume for each stand and for every year. Data on the initial state of the forest were obtained for a forest management plan. The harvested volume was divided into different species and qualities, i.e. sawtimber and pulpwood. Two different qualities of timber were distinguished.
The Chapman-Richards model (Richards, 1959; Chapman, 1961) was used for estimating the volume development for a stand when the state of the forest was known. A numerical equation for this yield function as fitted to data by Nilsson (1982) is as follows:
Tot = 164.16 (1 - 6.3582-Rel/100) 2.8967
where:
Tot is the relative total production in m³sk/ha at a certain age;1 andRel is the relative age, i.e. absolute age related to the age when the mean annual increment culminates.
1 sk = Swedish.
1 m³sk = 0.83 m³.
Growth during a specified period was calculated as the difference of total production between the two end-points of a defined period.
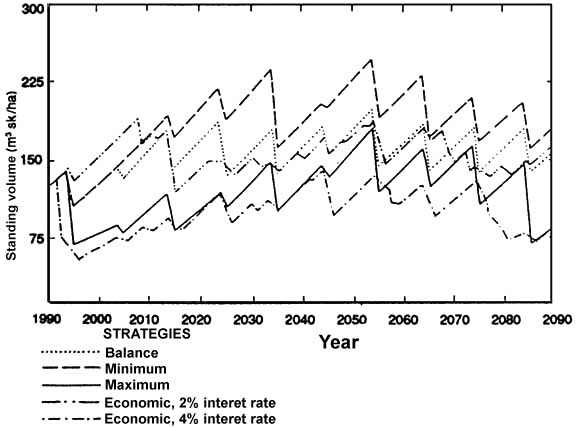
Development of the standing volume per hectare as a consequence of different management strategies
The parameters for the growth function for Swedish conditions were based on data from the Swedish National Forest Inventory, an annual inventory covering all of Sweden. The growth function was adjusted to each individual stand of the forest land studied with the help of data about its age, site class, standing volume and mixture of species (Hägglund, 1972). The yield was estimated from the basal area's weighted mean diameter. The diameter development was calculated from a function derived by Ollas (1980):
log(MD) = a1*log(AGE) + a2*log(SI) + a3
where:
MD is the basal area's weighted mean diameter (cm);AGE is the stand's age (year);
SI is the site class index (1); and
ai are constants.
Forest economy module. Given the volume from thinnings and final felling, the net income was calculated as volume x income cutting costs. In Sweden, income per cubic metre depends on quality and diameter class. The price list was given to the module as input data. It was assumed that prices and costs remain unchanged in real terms for 100 years, with 1990 taken as the base year. However, the sensitivity of the results to price changes is discussed later.
In the module, cutting costs depend on the logging system and the diameter of the trees cut. The costs cover variable as well as fixed costs. It was assumed that logging, hauling, planting and clearing would be carried out by a contractor using modern equipment.
The cutting programmes
When the Balance Strategy was applied, the average annual cut was 340 m³sk (282 m³). Application of the Minimum Strategy resulted in a somewhat lower cutting volume, 320 m³sk (266 m³) per year. With the Maximum Strategy, the cutting volume increased considerably to almost 390 m³sk (324 m³) per year (Table 2).
To contrast the Balance Strategy recommended by the Forestry Act and the Minimum and Maximum Strategies reflecting the range defined by the Act, an Economic Strategy with varying interest rates was applied. When the interest rates were 2 and 4 percent, the total cut during the entire period was almost the same about 370 m³sk (307 m³) per year.
State of the forest
When the Balance Strategy was applied, the average standing volume increased by 57 m³sk (47 m³) per ha during the period (See Figure and Table 2). The increment increased slightly from that found in 1990. The age class distribution for the year 2090 was normal.
Application of the Minimum Strategy resulted in a somewhat higher standing volume than when the Balance Strategy was applied (Figure and Table 2). Average standing volume per hectare was 182 m³sk (151 m³) compared with 160 m³sk (133 m³) under the Balance Strategy. One-quarter of the forest area was covered by forest that was more than 100 years old.
With the Maximum Strategy, the standing volume decreased. In 2090, the standing volume per hectare was only 83 m³sk (69 m³). No forest older than 100 years was found, while more than 40 percent belonged to age classes of less than 20 years.
TABLE 2. Standing volume, increment and average annual cut, 1990-2090, as a consequence of different management strategies
|
Strategy |
Standing volume |
Increment |
Average annual cut |
||
|
2090 |
1990-2090 |
2090 |
1990-2090 |
1990-2090 (m³sk) |
|
|
(m³sk/year) |
(m³sk/ha) |
||||
|
Minimum |
182 |
+59 |
4.5 |
+0.1 |
321 |
|
Balance |
160 |
+57 |
4.8 |
+0.4 |
339 |
|
Maximum |
83 |
-40 |
3.9 |
-0.5 |
387 |
|
Economic |
|||||
|
2% interest rate |
162 |
+39 |
5.1 |
+0.7 |
371 |
|
4% interest rate |
91 |
-31 |
4.2 |
-0.1 |
372 |
Note: 1 m³sk = 0.83 m³.
TABLE 3. Net present value of net income and stumpage value (1990 SKr) when different forest management strategies are applied for 100 years
|
Interest rate |
Strategy |
Net income from cuttings |
Stumpage value (Million SKr) |
Total net present value (Million SKr) |
|
|
Average (SKr/m³sk) |
Total (Million SKr) |
||||
|
2 percent |
Minimum |
82 |
2.65 |
0.43 |
3.08 |
|
Balance |
82 |
2.96 |
0.36 |
3.32 |
|
|
Maximum |
87 |
3.36 |
0.17 |
3.53 |
|
|
Economic |
83 |
3.07 |
0.36 |
3.43 |
|
|
4 percent |
Minimum |
40 |
1.29 |
0.06 |
1.35 |
|
Balance |
55 |
1.55 |
0.05 |
1.60 |
|
|
Maximum |
53 |
2.04 |
0.02 |
2.06 |
|
|
Economic |
60 |
2.22 |
0.02 |
2.22 |
|
Note: Two different interest rates have been used - 2 and 4 percent. US$1 = SKr 7.25.
When the Economic Strategy with varying interest rates was applied, two different forests developed. The 2 percent alternative resulted in a standing volume similar to that of the Balance Strategy. However, at the end of the period, the increment was somewhat higher. The age class distribution was more irregular.
At first glance, the Maximum Strategy and the Economic Strategy at the 4 percent level seem to be similar. However, when the Economic Strategy at the 4 percent level was applied, no stands were in age classes of more than 80 years in 2090 while almost 10 percent of the stands fell into those classes under the Maximum Strategy. High interest rates resulted in volume production (pulpwood) with short rotation periods.
Economic result
Discounting was made at two different rates: 2 percent and 4 percent (Table 3). At a discounting rate of 2 percent, the Maximum Strategy showed the highest net present value. However, the Economic and Balance Strategies gave almost the same result. One reason why the Maximum Strategy was superior to the Economic Strategy might be that the chosen economic criteria were based on a single-period projection. This carries a risk of suboptimization because older timber has value premiums.
At a discounting rate of 4 percent, the Economic Strategy gave the highest net present value while the Maximum Strategy came close to the same value. The higher the interest rate, the more unfavourable later incomes were.
Economic value
Table 4 compares the results of the four forest management strategies at two different interest rates, using the Economic Strategy as a reference point. An index below 100 indicates a higher value for the Economic Strategy. An index above 100 indicates a higher value for the strategy under study than for the Economic Strategy. An intensive cutting strategy, e.g. the Economic or Maximum Strategy, yields high returns and satisfies a forest owner's economic criteria.
How sensitive are the results to price changes? To answer this question, different price scenarios were applied to the comparison between the results of the Economic Strategy and the other strategies. The analysis was simplified by changing the price by 0.5 percent per year for one timber quality at a time. If the price increased, the price after 100 years would be 65 percent higher than in the first year; if the price decreased it would be 40 percent lower after 100 years.
As anticipated, the economic result improved when the price increased. The total net present value increased at an opportunity rate of 4 percent, with 6 to 7 percent for both sawtimber and pulpwood. A price decrease only slightly affected (by 2 percent) the total net present value at an
TABLE 4. Comparisons of different forest management strategies, using the Economic Strategy as the reference point (in percentages)
|
Interest rate |
Strategy |
Total net present value |
Standing volume |
Age class distribution |
|
|
£ 19 years |
80 years |
||||
|
2 percent |
Minimum |
90 |
112 |
84 |
137 |
|
Balance |
97 |
99 |
74 |
111 |
|
|
Maximum |
103 |
51 |
160 |
34 |
|
|
4 percent |
Minimum |
61 |
200 |
58 |
- |
|
Balance |
87 |
176 |
51 |
- |
|
|
Maximum |
93 |
91 |
111 |
- |
|
TABLE 5. Economic advantages or disadvantages of recommended strategies 1 related to the results of the Economic Strategy
|
Interest rate |
Strategy |
||
|
Minimum (SKr/ha) |
Balance (SKr/ha) |
Maximum (SKr/ha) |
|
|
2 percept |
-20 300 |
-1 400 |
-8 100 |
|
4 percent |
-28 700 |
-1 300 |
-2 100 |
1 The Minimum, Balance and Maximum strategies recommended by the Swedish Forestry Act (Government of Sweden 1989)
Note: US$ 1 = SKr 7.25 in May 1993.
Opportunity rate of 4 percent, primarily because price cuts lead to increased cutting to compensate for the lower returns. The increased volume more or less offset the effect of the falling prices.
Other goals
From empirical studies of non-industrial private forest owners' goals, it is known that economic goals are not the only ones forest owners strive to attain (Kurtz and Lewis, 1981; Young and Reichenback, 1987; Lönnstedt, 1989; Lönnstedt and Törnqvist, 1990). Thus, Table 4 also includes indicators of the state of the forest. Other goals concern maintaining family ownership, a way of life and the state of the forest. Among the economic goals, sustainable cash flow from the forest is usually more important than maximum return on capital. In fact, this is one reason for applying the Balance Strategy.
In Sweden, a forest is owned for an average of about 20 years. Thus, calculations spanning 100 years may involve four to six owners whose decisions will not be based on exactly the same criteria. However, it may be valuable for succeeding generations to apply the same basic principle. If economic gain is stressed, the Economic Strategy may be a sound principle. If a mixture of biological and economic values is sought, the Balance Strategy might be a good compromise. One generation may have strong reasons for diverging from the Balance Strategy for some years; however, they should be aware of the consequences for coming generations.
Cost of the Balance Strategy: making decisions
It is important for forest owners and society to be aware of the cost of the Balance Strategy. With this knowledge they can decide whether they are willing to pay the price or not.
What, then, is the "price" for applying a forest management plan other than the Economic Strategy? Table 5 calculates this price for each strategy. At an interest rate of 4 percent, the net present value for an estate managed under the Balance Strategy for the next 100 years totals SKr 620 000 (US$85 517, since US$1 = SKr 7.25 in May 1993). This is SKr 8 100 (US$1 117) per ha less than when the Economic Strategy is applied. Hultkrantz (1983; 1987) argues that the Swedish forest policy causes a costly and unnecessary misallocation of resources.
However, the value of a forest is not just a matter of the wood that can be extracted from it. The management strategy chosen will affect the future type of forest. Mattsson and Chuan-Zhong (1991) point out that no one questions the importance of the forest sector to the Swedish economy but that this does not mean that use of the forest exclusively for wood production is good economy. Forest areas can contribute to society's greater interests when managed according to the multiple use concept inherent in the Forestry Act's recommendations.
Hultkrantz (1991) has tried to put a value on non-market forest products in Sweden. He estimates the values of fuelwood, berries, mushrooms and game meat at SKr 3 000 million ($414 million) in 1987. The value added for harvested sawtimber and pulpwood was SKr 13 750 million ($1 890 million) in 1987.
The strategy chosen also affects the recreational value of the forest as well as its biodiversity and capacity to absorb carbon dioxide. The forest is of recreational value to people, who also derive pleasure from the knowledge that nature is being conserved. Growing trees bind carbon dioxide which may otherwise contribute to global warming. Thus, a greater volume of standing timber is positive from an environmental perspective.
Unfortunately, it is still difficult to measure or assign economic values to social and environmental aspects of forest management. One reason for choosing the Balance Strategy instead of the more extreme Minimum and Maximum Strategies is that it gives freedom of choice in an uncertain future. In ten or 20 years, for example, knowledge about preferred qualities and species and their market values will have increased.
Policy recommendations
Important to appropriate forest management decisions is information about local circumstances, for example the economic status of the owner and estate, the state of the forest and biological and environmental conditions. The owner usually has a good knowledge of these conditions. Information about the costs for different strategies is indispensable to a well-considered decision. Furthermore, it is important that the owner be directly responsible for the choices made.
It is therefore arguable that greater flexibility should be introduced into the Forestry Act. Although the Forestry Act needs to maintain clear requirements for minimum forest management, relaxing regulations and making more options available to non-industrial private forest owners would have several advantages. Administration and supervision costs would decrease. A likely consequence of less rigid regulation would be a wider variety of forest conditions on individual holdings. This variety would not only be an advantage from a biological viewpoint but also in terms of potential for meeting the demands, as yet unknown, that future generations will place on forests.
The analysis contained in this article shows the importance of clear goals in forest policy and evidences the impacts of forest policy on forestry practice. In this respect, it is a good example of how logical analysis can be used to lobby for changes in policy. Although the analysis described in this article was done after the formulation of the policy, it nevertheless provides a good indication of the value of policy analysis as part of the formulation process itself. It evidences how analysis based on modelling can reveal the potential implications of policy and can contribute to informed and appropriate decision-making.
Chapman, D.G. 1961. Statistical problems in population dynamics. In Proceedings of the Fourth Berkeley Symposium on Mathematical Statistics and Probability. Berkeley, California, University of California Press.
Government of Sweden. 1989. The Forestry Act 1989. Jönköping, Sweden, National Board of Forestry.
Hägglund, B. 1972. Om övre höjdens utveckling för gran i norra Sverige. Rapport No. 21. Stockholm, Sweden, Department of Forestry Yield Research, College of Forestry (English summary).
Hansson, K., Lönnstedt, L. & Svensson, J. 1990. Beslutsstödjande system för privata skogsägare. Rapport No. 12. Uppsala, Suède, SIMS, Swedish University of Agricultural Sciences.
Hultkrants, L. 1983. Skogsvårdspolitiken. Ekonomisk Debatt, 3: 173-181.
Hultkrantz, L. 1986. Optimal timber-harvesting programmes in a modal with adjustment costs. Can. J. Forest Res., 16: 836-840.
Hultkrantz, L. 1987. Resurshushållning i skogsbruket. Publicerad i Långtidsutredningen, bilaga 6. Stockholm, Sweden, Allmänna förlaget.
Hultkrantz, L. 1991. National account of timber and forest environmental resources in Sweden. Working paper No. 130. Umeå, Sweden, Department of Forestry Economics, Swedish University of Agricultural Sciences.
Kurtz, W.R. & Lewis, B.J. 1981. Decision making framework for non-industrial private forest owners: an application in Missouri Ozarks. J. Forest, 5: 285-288.
Lönnstedt, L. 1989. Goals and cutting decisions of private small forest owners. Stand. J. Forest Res., 4: 259-265.
Lönnstedt, L. & Törnqvist, T. 1990. Ägaren, fastigheten och omvärlden. Den skogliga beslutssituationen inom privat, enskilt skogsbruk. Rapport No. 14. Uppsala, Sweden, SIMS, Swedish University of Agricultural Sciences.
Mattsson, L. & Chuan-Zhong, L. 1991. Hur bör skogen användas? Ett samhällsekonomiskt problem. Skog Forskning, 1: 43-53.
Nilsson, N.E. 1982. An alley modal for forest resources planning. In B. Ranneby, ed. Statistics in theory and practice. Essays in honour of Bertil Matérn. Umeå, Sweden, Section of Forestry Biometry, Swedish University of Agricultural Sciences.
Ollas, R. 1990. Nya utbytesfunktioner ör träd och bestånd. No. 5, Stockholm, Sweden, The Forest Operations Institute.
Richards, F.J. 1959. A flexible growth function for empirical use. J. Exp. Bot., 10: 290-300.
Södersten, L. 1987. Lönsamheten i svensk industri. Skandinaviska Enskilda Banken Kvartalsskrift, 2: 40-44.
Stridsberg, E. & Mattsson, L. 1980. Skogen genom tiderna - dess roll för lantbruket fran forntid till nutid. Stockholm, Sweden, LTs förlag.
Young, R.A., & Reichenback, M.R. 1987. Factors influencing the timber harvest intentions of non-industrial private forest owners. Forest Sci., 33: 381-393.
![]()
![]()
![]()