| by | ||
| Yousef HALIM(*) | Selim A. MORCOS(**) | |
| Samir RIZKALLA(***) | and | Mahmoud Kh. EL-SAYED(*) |
1. WATER MASSES AND CIRCULATION IN THE LEVANTINE BASIN OF THE MEDITERRANEAN SEA
The Mediterranean Sea is a concentration basin in an arid zone, where evaporation exceeds precipitation and runoff. To compensate for the negative water balance, Atlantic Water (AW) enters the Mediterranean through the Gibraltar Strait where two distinct layers separated at about 150 m are recognized. The Atlantic Water (AW) upper inflow of low temperature and low salinity exceeds the outflowing more saline subsurface Mediterranean Water which originates mainly in the eastern Mediterranean as the Intermediate Levantine Water (LIW).
Water masses and their sources. The southern Levantine basin is occupied by four main water masses: the Mediterranean Surface Water (MSW), the Atlantic Water (AW), the Levantine Intermediate Water (LIW) and the Eastern Mediterranean Deep Water (EMDW). Understanding the formation and circulation of these water masses requires a broader knowledge of oceanographic events and phenomena outside the area of our immediate interest.
The Atlantic Water (AW) moves eastward as a surface flow along the North African coast with salinities between 36.15 and 37.15 from Gibraltar to the Strait of Sicily where it enters the Ionian Basin of the eastern Mediterranean. It continues eastward to reach the Levantine basin through the Strait of Crete (Figure 1). Along the Egyptian coast, it is overtopped by the Mediterranean Surface Water (SW) of higher temperature and salinity, so that its signature is a subsurface minimum salinity (Morcos, 1972). In summer and autumn, the depth of the salinity minimum exists between 20 and 100 m, and generally decreases from east to west. In winter, the subsurface minimum disappears as a result of vertical convective processes.
(*) Department of Oceanography, Faculty of Science, Alexandria
(**) Consultant, Science Sector, Unesco, 75700 Paris, France
(***) Alexandria Institute of Oceanography and Fisheries, Alexandria, Egypt
Other factors contribute to the disappearance of the salinity minimum in winter, mainly the reduction in the Atlantic flow into the Levantine basin as a result of its deflection towards Crete away from the North African coast by the Sirocco winds, and the northward transport by the cyclonic gyres which get stronger in winter (Hopkins, 1978). The Atlantic Water is finally entrapped in the large Mersa Matrouh anticyclonic gyre (Figure 2), where the AW occupies a depth of 200 m with salinity 38.5, below a thick mixed layer in early winter (Özsoy et al., 1989).
The increase of the Atlantic Water (AW) in the Levant coincides with the increase of its inflow in summer in the Gibraltar as well as Sicily Straits. The T-S diagram for an area west of Alexandria (Figure 3) illustrates the seasonal change of the vertical distribution of salinity off the Egyptian coast. (Morcos, 1972; Morcos and Hassan, 1976).
The presence of the subsurface minimum salinity layer along the Israeli and Lebanese coasts has been noted by several authors (e.g. Oren, 1971; Rosentraub et al., 1985). The data obtained off the Egyptian and Israeli coasts are generally consistent, but differ in details such as the depth of convective mixing, which may be as much as 300 m along the Egyptian coast in February 1966 (Morcos and Hassan, 1976), compared to 100-160 m off Israel in February 1983 (Rosentraub et al., 1985).
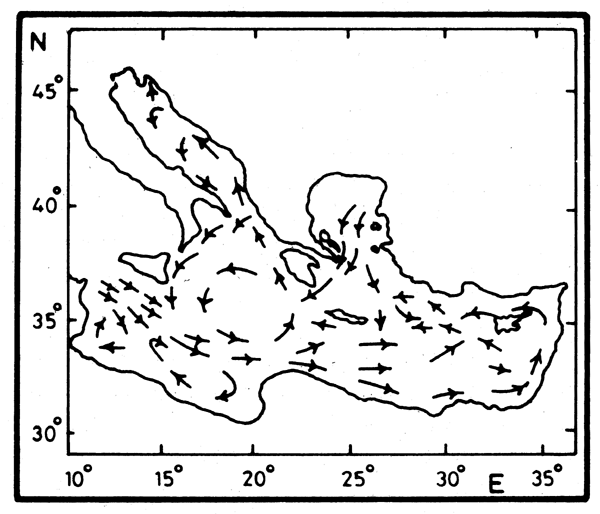
Figure 1. General circulation in the Mediterranean Sea according to Nielsen (1912)
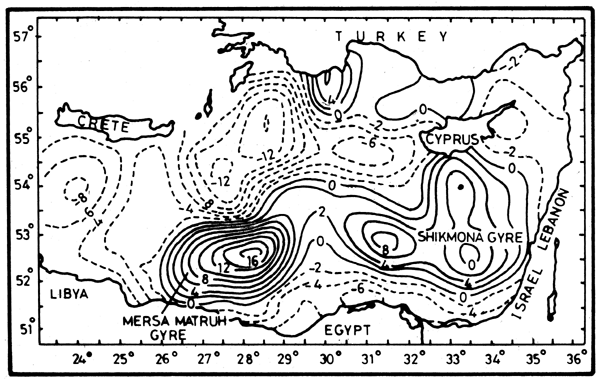
Figure 2. Topography of the surface geopotential anomaly relative to the 880 m decibar (Oct.-Nov. 1985) (Ozsoy et al., 1989)
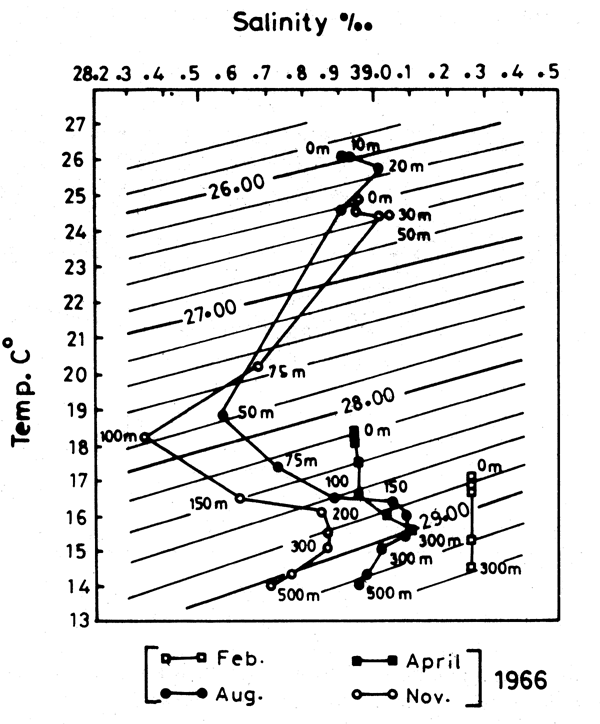
Figure 3. T-S of “Ichthyolog” stations in the Southern Levant (Morcos, 1977)
The Levantine Intermediate Water (LIW) mass is a predominant feature in the entire Mediterranean. Its signature is a subsurface salinity maximum which lies at about 50 to 200 m depth in the Levantine basin, and at greater depths, down to 400 m, in the wester basin. There is general agreement that the northern Levant Sea is the main source of formation of the LIW, primarily along the southern coast of Turkey and to the east of Rhodes in February and March under the influence of the cold and dry continental winds. A secondary source of the LIW has been detected along the Egyptian coast by Morcos (1967, 1972). In the region where it is formed, the LIW has a salinity signature of 39.1 and a temperature of 15.5°C. While spreading westward, it mixes with lower salinity water from above and below, resulting in a decrease in salinity and also in temperature, with an associated increase in depth (from 50 to 100 m to 250 m and finally to 300 to 400 m). By the time it reaches the Alboran Sea it attains a salinity of 38.4 and a temperature of 13°C, before it exits via Gibraltar Strait to enter the Atlantic Ocean as the Mediterranean Intermediate Water (Nielsen, 1912: Wüst, 1961; Morcos, 1972).
The considerable scatter in the values of the LIM on the T-S diagrams in the Mediterranean suggests the existence of more than one source (Morcos, 1972). Greater homogenity in the T-S properties is found to the west, as a result of the smoothing out by mixing the waters from different sources in the Levantine.
Examination of the T-S diagrams in the four seasons off the Egyptian coast (Morcos, 1972; Morcos and Hassan, 1976) indicates a process of formation of the intermediate maximum salinity water (LIW) similar to that suggested by Lacombe and Tchernia (1960) for the Rhodes-Cyprus region (Figures 3 and 4). (Station locations are shown in Figure 5).
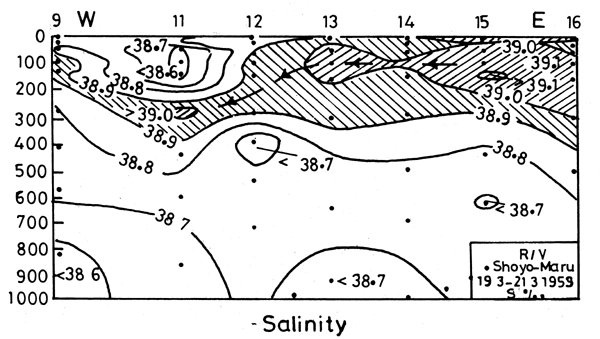
Figure 4. Salinity section along the Egyptian coast, March 1959, R/V Shoyo Maru (Morcos, 1977). (Station locations are shown in Figure 5).
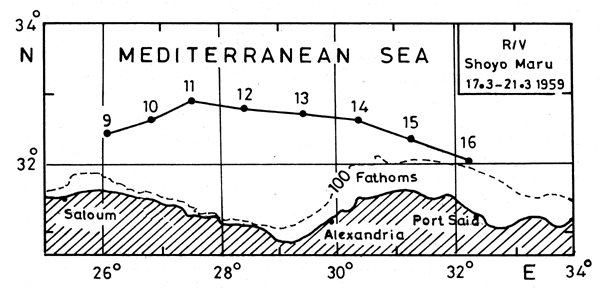
Figure 5. Position of stations in Figure 4
Because of the shallow sill in the Strait of Sicily that divides the Mediterranean into eastern and western basins (Figure 6), the exchange between the basins is limited to the upper Atlantic Water (AW) and the Levantine Intermediate Water (LIW). The Eastern Mediterranean Deep Water (EMDW) is formed independently from the deep dense water of the Adriatic with contributions from the Aegean Sea. EMDW has a uniform salinity of 38.7 and potential temperature of 13.6°C, with little variations at depths below 1 500 m. The oxygen content of 3.5 ml.l-1, which is slightly lower in the Levantine basin than in the Ionian basin, indicates that these waters are not stagnant.
Levantine circulation and its variability. The classic general circulation in the Mediterranean Sea as described by Nielsen (1912) is shown in Figure 1. Since then our knowledge has evolved considerably. In the eastern Mediterranean, details of the circulation (Figure 2) started to emerge following the launching in 1984 of the Unesco/IOC Programme “Physical Oceanography of the Eastern Mediterranean” (POEM) (Unesco, 1984).
Thus, the classical description of circulation of the eastern Levantine basin depicts a large cyclonic gyre between Cyprus and the Egyptian coast with a smooth flow of the order of 5-10 cm s-1 between the surface and 500 m in all seasons. A more detailed picture emerges from the POEM Programme, showing sub-basin scale gyres interconnected by intense jets and meandering currents, which redistribute the water masses of the basin (Hecht et al., 1988).
Based on the POEM 1985-86 cruises, Özsoy et al., (1989) gave a detailed account of the circulation in two different seasons. Figure 2 illustrating the topography of the surface geopotential anomaly relative to 800 debar in October–November 1985, shows the following main features of the circulation:
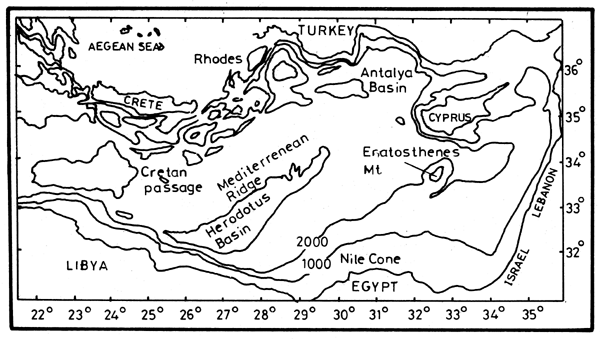
Figure 6. The Eastern Mediterranean bottom topography
A cyclonic eddy in the Cretan Passage;
The Rhodes Gyre, a large-scale cyclonic eddy southeast of Rhodes;
The Mersa Matrouh Gyre: a major anticyclonic gyre north of Mersa Matrouh on the Egyptian coast, in the southwestern Levantine basin;
An intense jet with current velocities of 40 cm-1 s-1 between the Rhodes and Mersa Matrouh gyres. This jet bifurcates into a northward branch around the Rhodes gyre and an eastward branch towards Cyprus. The jet extension to the west is not well defined and requires further investigations along the Libyan coast, and
The Shikmona Gyre: a large anticyclonic gyre with three small anticyclonic eddies in the eastern Levantine, south of Cyprus and west of Haifa. This gyre directs the flow southward along the Israeli coast, and then westward along the Egyptian coast. However further investigations are still required.
2. THE COASTAL ZONE OF EGYPT AND THE IMPACTS OF THE NILE (1962–1986)
The marine environment of the East Mediterranean Sea has been considerably impacted in modern times by two man-induced changes, the creation of a waterway between the Red Sea and the Mediterranean basins in 1869, and one century later, the almost complete diversion of the Nile freshwater input.
2.1 Pre-dam conditions
The volume of fresh water periodically released to the Mediterranean Sea in the past during the Nile flood season has always been subject to considerable interannual fluctuations, depending upon fluctuations in the rainfall over the East African highlands. The average for the five years 1959–1963 amounted to 43 km3 but in 1964 it was higher, 52.89 km3
As soon as it was released from both Rosetta and Damietta outlets (Figure 7) in August, the flood water progressed rapidly eastward as a turbid coastal current, the “Nile Stream”, along the coast of Egypt and then northward along Asia Minor.
The “Nile Stream” was bounded to seaward by a density front along which a sudden discontinuity in salinity, density, turbidity and nutrient salts occurred (Halim, 1960). The seaward width of the stream, its eastward and northward extension in the Levant basin and the total area covered depended upon the height and the duration of the flood wave. In 1964 the stream showed considerable horizontal spreading over the continental shelf off the Egyptian coast. Its boundary front, along the isopycnal of 26, was detectable about 90 km north from Rosetta. It then narrowed eastward to a strip about 25–30 km in width over depths of 100 m. The effect of the Nile Stream usually extended far beyond Beyrouth (Halim, 1960; Halim et al., 1967).
The immense importance of the Nile waters in fertilizing the oligotrophic Levantine basin derived from their load of dissolved and silt-adsorbed nutrients. Considerable amounts of nutrient salts in both forms were brought down and spread by the stream over its area of extension during the flood season, thus enhancing the food chain at all levels. It has been estimated (Halim, 1991) that about 8.2 × 10³ t of dissolved phosphate and 410 × 103t of silicate were injected into the South East Levant basin during the flood season of 1964. The phosphate fraction adsorbed on suspended particles was reported to be at least five times the dissolved fraction (Halim, 1991). Gradual desorption from the finer silt load carried by the stream eventually liberated more nutrient ions, while the current travelled away from its outlets. The suspended load of fine particles acted as a reservoir of “potential” nutrients, regulating the concentration of phosphate and presumably of other nutrients (Halim and Morcos, 1966). It is estimated that the suspended matter carried down to the sea amounted to about 57×106 t-1 per year (Shukry, 1950).
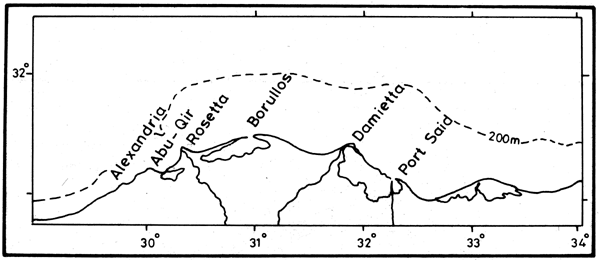
Figure7. The Mediterranean coast of Egypt and the Delta lakes
A massive phytoplankton bloom was immediately triggered by the freshwater outflow of the Nile Stream. The standing crop increased by two hundred fold from 50–150 × 103 cell 1-1 to 2–20 × 106 cell 1-1 in the circumlittoral belt within a few days, (Figure 8). The continued supply of nutrients sustained the bloom during several months in spite of heavy grazing by zooplankton and planktivorous fish for the duration of the flood season.
2.2 The post-dam conditions
Man's intervention in the flow of the Nile river dates back to Pharaonic times. Modern alterations of the river hydrological cycle began in 1861 with the construction of the “Delta Barrage”, just north of Cairo (Figure9). The barrage sluices were opened during the flood season to let the waters flow, but made possible the beginning of perennial irrigation instead of basin flooding (Halim, 1991). The practice was developed with the “Low Aswan Dam”, built in three stages (1902, 1912 and 1933). The Low Aswan Dam was also provided with sluices. It was intended to extend the flood duration downstream without carrying over any water storage from year to year, and accordingly without retaining any significant amount of silt. The river at this point carried approximately 84 km3 of water in an average year, as calculated for the period 1900 to 1959 (White, 1988). The “High Aswan Dam” is therefore the second dam to be built south from Aswan in the vicinity of the Nile first cataract.
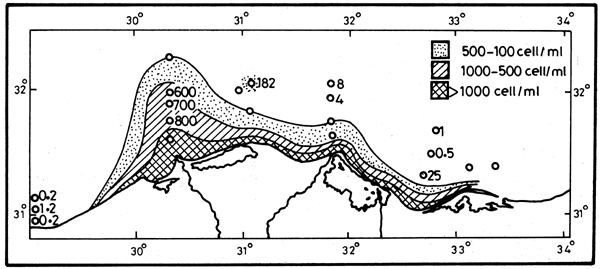
Figure 8. The phytoplankton bloom density in 1964
Its construction began in 1960. The river was closed around a temporary structure in 1965 and the dam was completed in 1967. The new reservoir behind the dam (Lake Nasser), is designed to serve as a detention reservoir. It absorbs the flood wave (about 84 km3) to maintain a regular flow downstream regardless of the upstream level and assures that no excess water is released beyond the actual needs of 55.5 km3 as permitted under the Nile waters agreements of 1929 and 1959.
By 1969, with the filling of the reservoir, the river became almost completely controlled and the fresh water overflow reaching the coastal zone dropped to its present day level of 2.5 to 4 km3 (Figure 10).
Damming the Nile River has practically eliminated the destructive effects of abnormally high spring floods on the lower reaches of the river valley. Moreover, it has protected Egypt from the disastrous effects of drought in Africa for the past decade (Halim, 1991). However, the almost complete diversion of the fresh water outflow and the total absence of sediment input have given rise to serious problems in the coastal zone (Figure 11).
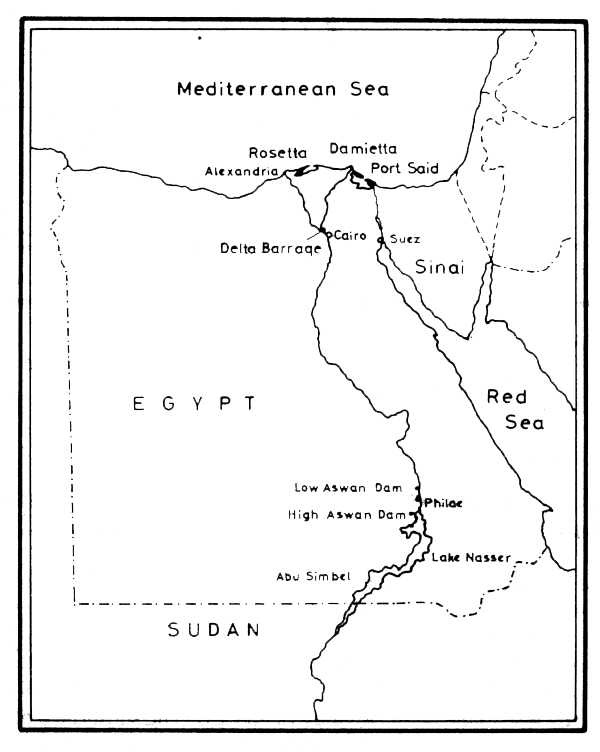
Figure 9. The River Nile Basin
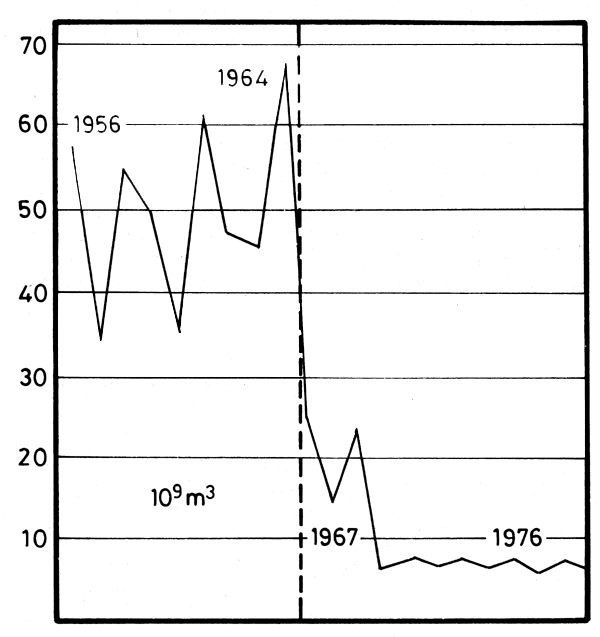
Figure 10. Water intake of the two Nile branches at the level of Cairo (Halim, 1990)
2.2.1 Nutrient salts, biomass and primary productivity in the Egyptian waters and the SE Levantine basin
Surveys of the continental shelf waters (Emara et al., 1973; Al-Kholy and El-Wakeel, 1975; Mostafa, 1985) subsequent to the completion of the High Aswan Dam showed the postdam conditions to be in sharp contrast with the pre-dam conditions. Already in autumn 1966, formerly the season of the Nile flood, a typical Levantine high salinity water mass extended in front of the delta. This is shown by the course of the isohalines of 38.5–39.0, in November running parallel and close to the coast (Figures 12 and 13). The subsurface phosphate content in this water mass is also typical of the Levantine waters (0.04–0.10 μM), (Emara et al., 1973). The sudden decrease in photic zone nutrient concentrations immediately after closing of the High Aswan Dam, and the later upward trends are illustrated in Table 1.
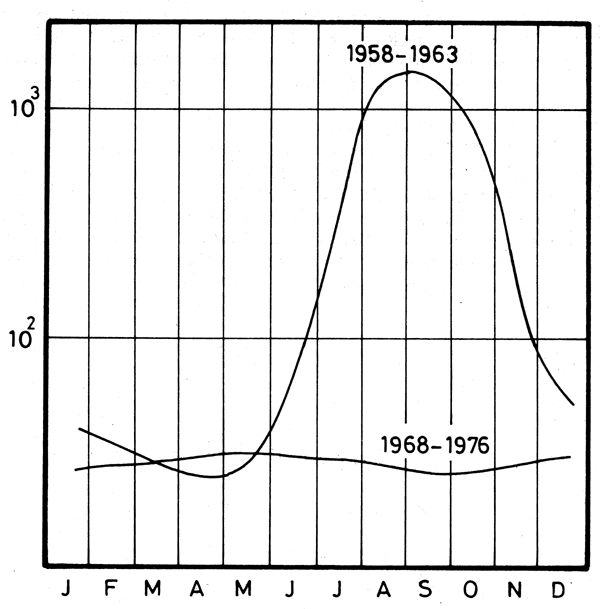
Figure 11. Suspended sediments in the Nile water. Monthly average. 1958–63 and 1968–76 (Halim, 1990)
| Date | Phosphate | Nitrate | Reference |
|---|---|---|---|
| 1948 | 0.07 | 1 | |
| 1966 | 0.00–0.15 | 0.5–0.8 | 2 |
| 1969–70 | 0.00–0.30 | 0.00–2.5 | 3 |
| 1970–71 | 0.03–0.20 | - | 4 |
| 1982 | 0.07–0.11 | 1.69–2.43 | 5 |
(1) Bulletin Hydrographique, (1948);
(2) Emara et al., (1973);
(3) Morcos and El Rayiss, (1973);
(4) Al-Kholy and El-Wakeel (1975);
(5) Mostafa, (1985).
The coastal belt however is still supplied with freshwater and biogenic substances from several land-based sources, which pre-dated the dam, but the main discharge season has shifted to mid-winter instead of autumn. It is estimated that the volume of agricultural drainage water discharged through the four lagoon outlets (Maryut, Edku, Borollos and Manzalah) together with the domestic effluents of Alexandria and of Port-Said amounts to about 10 km-3 y-1. The nutrient content of the lagoon waters ranges from 0.9 to 1.1 μ M phosphate, 150 to 400 μM silicate and 6 to 11 μM nitrate (Al-Kholy and El-Wakeel, 1975).
The total flux of nutrient salts therefore, including the overflow from the Rosetta outlet, approximates 73 ×103 ton y-1 silicate, 0.330 x 10³ ton y-1 phosphate and 1.2 × 10³ ton y-1 nitrate. This represents but a small fraction of the pre-damming supply throughout the flood season, about 4 percent of the phosphate and 18 percent of the silicate. Although dramatically reduced, this nutrient flux still maintains a comparatively elevated level of productivity on the continental shelf of Egypt, beyond which the oligotrophic conditions of the southern Levantine basin predominate.
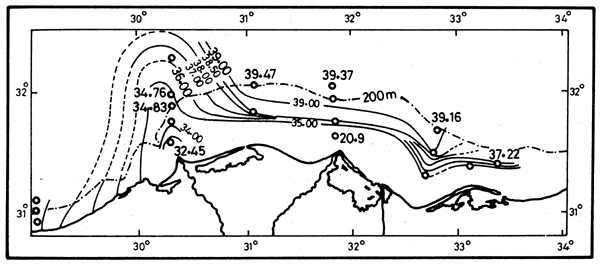
Figure 12. Isohalines in October 1982 (Halim et al., 1986)
It is only at the depth of 500 m that the nutrient concentration begins to increase very slowly, reaching 0.29 μ M phosphate and 2.16 μ M nitrate (Morcos and El-Rayiss, 1973). In 1971 (Al-Kholy and El-Wakeel, 1975) nitrate content reached 5 to 6 μ at 600–800 m and phosphate content ranged from 0.06 to 0.54 μ at 1 200 m. Such concentrations are extremely low compared to the open ocean concentrations at similar depths. The disappearance of the haline stratification in Autumm, after control of the freshwater release in 1965–1969, and the consequent increase in surface density was thought to create favourable conditions for deeper winter convection. Mixing with the aphotic layer would then compensate in the long run for consequent increase in surface density was thought to create favourable conditions for deeper winter convection. Mixing with the aphotic layer would then compensate in the long run for part of the lost river flux. Table 2, showing the vertical gradient of phosphate at an interval of more than ten years does not support this view. The exceedingly low nutrient content down to several hundred meters below the trophogenic layer precludes the possibility of any replenishment of this layer through convection.
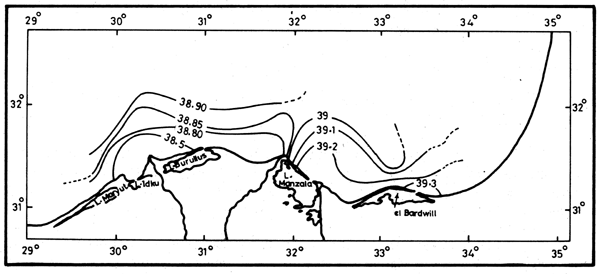
Figure 13. Isohalines in November 1982 (Mostafa, 1986)
| 1970–1971 (1) | 1982 (2) | |||||
|---|---|---|---|---|---|---|
| Depth | Winter | Summer | Depth | Winter | Depth | Summer |
| 0 | 0.0–0.05 | 0.0–0.10 | 0 | 0.15 | 0 | 0.1 |
| 50 | 0.10 | 0.05 | 50 | 0.05 | 80 | 0.02 |
| 100 | 0.15 | 0.10 | 100 | 0.10 | 100 | 0.02 |
| 150 | 0.30 | 0.10 | 150 | 0.05 | 200 | 0.02 |
| 200 | 0.20 | 0.10 | 180 | 0.05 | 250 | |
| 400 | 0.15 | 1.10 | ||||
| 800 | 0.15 | 0.20 | ||||
(1) Data computed from the figures of Al-Kholy and El-Wakeel (1975);
(2) Mostafa (1985).
This is certainly one of the main factors that contribute to the oligotrophy of the Levantine basin.
Exceedingly low nutrient concentrations in the photic zone and a similar imperceptible vertical gradient are also met within the northeast Levantine basin off Turkey (Basturk et al., 1988) and south of Cyprus (Krom et al., 1988).
Chlorophyll concentration
The available data from the southeastern Levantine basin compiled in Table 3 point to several features.
The chlorophyll concentration of the “oceanic” waters beyond the continental edge is extremely low and ranges from 0.02 to 0.10–0.16 mg Chl.m-3. The “neritic” waters sustain a much higher biomass, four times greater, and the concentration increases with decreasing distance from the coast. The highest biomass in this basin occurs off the Nile Delta.
A consistent seasonal trend is observed with the maximum biomass occurring in the colder season (December to March) and the minimal in summer-autumn. On the other hand size-fractionation has shown that for most of the year biomass is associated with organisms smaller than 3 μ, while microplankton (above 20 μ) may dominate for short periods. However, there is no apparent trend to a greater proportion of picoplankton with depth (Berman et al., 1984).
All observations have shown a deep chlorophyll maximum at depths from 50 to 150 m. This subsurface maximum usually occurs at the depth of 10 to 1 percent of the surface incident light, and represents a general feature. It is also observed in the northeastern Levant basin (Yilmaz et al., 1988) as well as in the western Mediterranean (Jacques, 1989) and indeed in most oligotrophic tropical seas. It is not yet clear whether the deep chlorophyll maxima are in anyway seasonal phenomena.
| Area | Neritic | Pelagic | Time of max. and of min. | Remarks | References |
|---|---|---|---|---|---|
| Off Nile delta. Coastal belt to continental slope over 400 m (1982) | 0.49–2.8 | 0.09–0.79 | Max.: Winter Min.: Summer-Autumn | -Deep chlorophyll maxima -Importance of nano- and pico-plankton | (1) and (2) |
| Eastern most Southern Levantine basin. Over 200 to 1000 m depth | 0.03–0.24 | 0.02–0.10 | Max.: Dec.Feb. Min.: July | -Deep chlorophyll maxima -Importance of pico-plankton | (3) |
| Off Haifa, edge of continental shelf | 0.13–1.46 | 0.03–0.5 | Max.: Feb.- March Min.: May-July | Surface measurements | (4) |
| Off eastern Libyan coast over 400 m depth | 0.02–0.16 | Max.: Winter Min.: Summer | Deep chlorophyll maxima | (5) | |
| Off South Crete | 0.1 | measured in January | Uniform vertical distribution. Importance of pico-plankton | (6) |
References: (1) Dowidar (1984);
(2) Mostafa (1985);
(3) Berman et al. (1984);
(4) Azov (1987);
(5)Bologa,
(1986);
(6) Weikert (1988)
Primary productivity
The Carbon-14 primary productivity in the southeastern Levantine basin has been measured by different authors according to different procedures and reported in different units (Table 4). Some used on-deck simulation with incubations of four to six-and-a-half hours, others used laboratory incubation for two hours under constant temperature and light conditions. The units used are not interconvertible. The rates are reported either as values per unit volume (m-3) per hour or per day or as areal rates (m-2), again either per hour or per day. This disparity greatly limits the comparability of the results. General trends however can still be recognized. The “pelagic” zones off the Egyptian coast and off Haifa yielded comparable rates (0.16–0.18 mg C m-3 h-1), but the “neritic” Egyptian waters yielded double the rate of the latter area. The areal productivity (in mgC m-2 d-1) in the “pelagic” Egyptian waters, off the shelf slope (Dowidar, 1984) are about triple the “oceanic” rates measured over the deep SE Levantine basin (Berman et al., 1984). The latter values compare rather to the waters south of Cyprus (Weikert, 1988). Berman et al., (1984) estimated the annual net production in the “oceanic” Levantine waters to be of about 10–20 g.C m-2 y-1 while Dowidar reports an average annual production of 55.5 g.C m-2y-1 for the Egyptian continental shelf waters. Sournia (1973) in his review on primary productivity in the Mediterranean Sea, classifies the data into “oceanic”, “semi-oceanic”, “neritic” and “lagoons and harbours”. The average annual production corresponds respectively to 78 g.C m-2, 65– 90 g.C m-2, 70 to 120 g.C m-2 and 100 to 300 g.C m-2.
| Area | Productivity | References |
|---|---|---|
| Off Nile delta (1982) | neritic: 1.9 mg Cm-3 h-1 pelagic: 0.18 neritic: 176.39 mg cm-2 d-1 pelagic: 152.6 Annual production: 55.5 g.C m-2 y-1 | (1) and (2) |
| Eastern most Southern Levantine basin | Range: 1.62 to 10.2 mg Cm-2 h-1 40–50 mg Cm-2 d-1 Annual net production about 10–20 g Cm-2 y-1 | (3) |
| Off Haifa, edge of continental shelf | neritic: 0.92 mg Cm-3 h-1 pelagic: 0.16 | (4) |
| Off Eastern Libyan coast | 0.12 to 9.6 mg Cm-3 d-1 (rough estimation) | (5) |
| Off Southern Cyprus | 17.4 to 79.5 mg Cm-2 d-1 | (6) |
References (1) to (6), as in Table 3
Viewed in this perspective, it is apparent that the southeastern Levantine basin is the most oligotrophic area of the Mediterranean Sea. It is also obvious that the continental shelf of Egypt is still the most productive zone in this basin.
2.2.2 Impact on the continental shelf. Changes in the bottom configuration
The continental shelf of the Nile Delta is the widest in the eastern Mediterranean. It begins as a narrow strip in the west (15–25 km) and becomes wider eastward (48–65 km) between Rosetta and Port-Said.
It is made up of a series of terraces separated by low slopes that are cut by drowned channels and by one major submarine canyon (Misdorp and Sestini, 1976). The conspicuous break at 121 m is at the same depth as the average for all continental shelves. It may represent the lowest sea level during the Wurm glaciation. Mud and sandy mud cover the shore face around the two river mouths. Sands cover much of the floor of Abu-Qir Bay, as well as the upper terrace off Damietta. A major boundary separates the sediments off the Delta from the carbonate sands and muds that occur off Alexandria and west from it.
The total suspended load of the River Nile was estimated to exceed 111.109 kg y-1 at the level of Aswan before 1964 although it was highly variable. Since the High Dam at Aswan became functional the Nile transports virtually no sediment to the sea. The effect of the sediment influx has been difficult to quantify. One problem is the erosion of the delta coastline since 1900 after more than a 100 years of standing progradation, before the river was dammed. Still, the erosion of the Rosetta branch between 1909 and 1945 was only of a few hundred metres, while between 1945 and 1972 (presumably occurring mostly after 1965), it was more than 1.5 km (Sestini, 1976).
The diminished Nile flow and sediment entrapment by the High Aswan Dam coupled with the effects of the intensified irrigation, channelization, and land reclamation projects in the northern delta during the past three decades, has markedly reduced fine sediment supply from the coast to the continental margin seaward from the inner shelf (Stanley, 1988). The coupling of erosion by bottom currents and reduced sediment input from the river have induced depositional changes on the shelf which could be monitored.
Examination of long-term changes of mapped distribution patterns of shelf sediments as well as bathymetric charts indicates areas of erosion and accretion (Toma and Salama, 1980; Frihy, 1988; Frihy, 1992; Smith and Abdel Kader, 1988).
Analysis of a series of aerial photographs (Frihy, 1988) taken in 1955 and 1983 revealed severe erosion of both Nile promontories. The highest erosion rates in this period were 114 m y-1 and 31 m y-1 in Rosetta and Damietta respectively.
Analysis of Landsat images of the Nile delta (Smith and Abdel Kader, 1988) show that the Rosetta promontory retreated at a rate of 275 m y-1 between 1978 and 1984. The total retreat of this area between 1934 and 1984 was 3700 m y-1. The Damietta promontory does not show regular patterns of changes. Erosion at a rate of 35–50 m/y was found to have occurred between 1978 and 1988.
Erosion of the bottom dominates the inner continental shelf with accretion at sinks such as embayments and the downslope of the inner shelf. The Rosetta Canyon plays a significant role as a sink for the eroded sediments transported offshore from Abu Qir Bay and the Rosetta fan. Bottoms of fine material tend to be erosional, while bottoms of coarse material tend to be accretional (Toma and Salama, 1980). The volumetric changes within different depth zones (0–5, 5–10, 15–20, 20–25 m) vary along the shore. Maximum net erosion of 400 million m3 and 50 million m3 (Figure 14) occurred at the Rosetta and Damietta promontories respectively (Frihy, 1992).
3. THE MEDITERRANEAN FISHERIES OF EGYPT, PRE- AND POST-HIGH DAM (1958–1986)
Seen in prespective, the Mediterranean waters adjacent to Egypt appear to contribute a substantial proportion to the total fisheries production of the Levantine basin. The total catch from this Basin accounted for 3.4 to 4.6 percent of the total Mediterranean catch (not including the Black Sea) in the period 1970 to 1984. About one to almost two-thirds of the Levantine catch in this period were contributed by the continental shelf of Egypt (FAO, 1987). The catch from the Egyptian waters therefore accounted for about 1.5 percent of the total Mediterranean production. Its proportion was highest in 1980 and 1981, but no clear trend can be reliably inferred given the quality of the data provided to FAO by some of the member countries (FAO, 1987).
More than 200 fish species are known to occur in Egyptian waters, of which 50 contribute to the commercial catch, including several Red Sea immigrant species (see below). Nine cephalopod species are recorded from the coastal waters. Three are commercial and all are of Mediterranean occurrence. The commercial crustacea comprise one crab and seven penaeid shrimps of which six are of Red Sea origin (Appendix 1 and 2).
Statistical records for the Egyptian Mediterranean fisheries are available for the years 1958 to 1986. Estimates are also available for an earlier period, 1928 to 1932, during which the catch is reported to have ranged from 5.00 to y-1 to 13.700 t y-1.
During the last three decades the total catch and the yield per fishing trip displayed drastic fluctuations leading to an almost complete collapse of the fisheries, followed by a slow recovery (Figure 15).
It has been widely assumed (Halim, 1967; Thomas and Wadie 1989; Wadie, 1982) that the collapse of the Egyptian fisheries was solely caused by the environmental changes which followed the damming of the River Nile. This interpretation however, does not fit with the sequence of events. The downward trend began several years before the High Aswan Dam and was determined by a combination of factors acting either simultaneously or successively, at different times. The control of the river became one of the major factors after 1965.
Three phases should be considered:
The pre-dam phase, 1958 to 1965;
The post-dam phase, 1966 to 1976; and
The recent trends
3.1 The pre-dam phase
The records show a rapid increase in the catch for the three years 1958–1960 with an outstanding peak in 1960 (no records are available for 1961). A sustained decline follows from 1960 to 1965, before the HAD became functional. By 1965 the total catch had dropped to 65 percent and the Sardinella catch to 42 percent of their respective values in 1962 (Figure 16).
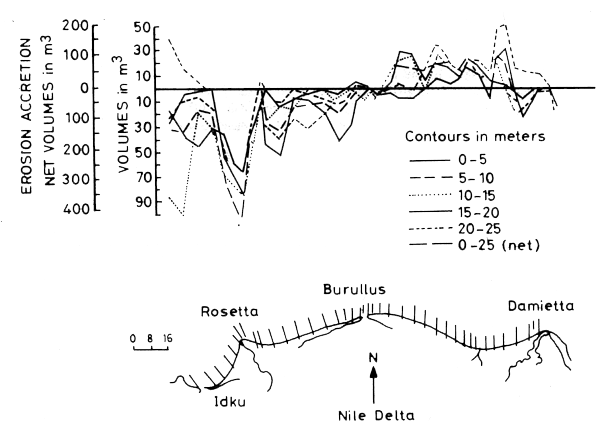
Figure 14. Volume changes at the 5 m contour intervals along the Nile Delta from 1919/22 to 1964 (Frihy et al., 1992)
Both the unusually high catches of 1958–1960 and the following pre-dam decline have the same causes. They are to be looked for in the effects of the governmental policy initiated in the late fifties and the resulting intensification of fishing activities. This policy aimed at creating and supporting fishermen cooperatives, promoting the mechanization of the fishing fleet and subsidizing the acquisition of fishing gear. As a result, the number of motorized fishing boats increased from 30 in the late 1930s to 428 in 1958 and to 622 in 1961 (El-Zarka and Koura, 1965; Wadie, 1982). The pressure on the fish stocks intensified considerably and both landings and yield per effort began to slope down after the peak of 1960.
3.2 The post-dam phase
The downward trend which began after 1960 continued until a period of quasiequilibrium around a minimal value was reached from 1969 to 1977. From 1965 onward, due to the impoverishment of the coastal zone caused by the control of the River Nile adding to overfishing, the trend accelerates (Figure 15). Furthermore, after the events of mid-1967, military and security constraints on the movements of the fishing boats resulted in the shrinking of the available fishing grounds. Fishing activities were only permitted in the inshore waters of the central and western zones (Port-Said to Alexandria). The eastern zone (east from Port-Said) became out of bounds to Egyptian fishing boats since mid-1967 and remained so until 1980. In the meantime 46 percent of the Israeli trawl boat effort was directed to the area west from El-Arish, North Sinai (Pisanty, pers. comm.). From 1968 to 1977 their catch from the area Gaza to El-Arish ranged from 3 600 to 4 586 t y-1. The catch was mainly composed of sardines, grey mullets and gilt-headed bream (Grofit, 1991).
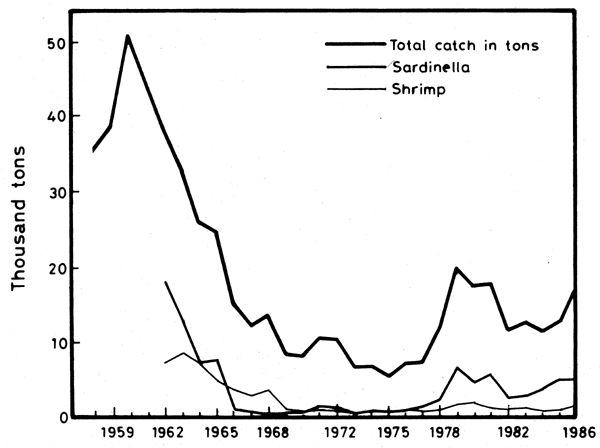
Figure 15. Total catch 1(1958–86); Sardinella and shrimp catch (1962–86). (Fishery Statistics, Inst. of Oceanography and Fisheries, Alexandria)
The drastic reduction in the fishing grounds and the decreased fertility of the coastal zone caused a sudden drop in the yield per fishing trip within one year, from 1965 to 1966: 680 kg/trip to 380 kg/trip respectively. By 1973–1975 it had fallen to an average of 250 kg/trip (Figure 17). The total catch remained at very low levels during the following decade ending in 1977, fluctuating in the range of 13 percent to 26 percent of its 1962 value (5.4×10³ t to 10.5×10³ t respectively). Judging from the yield/trip, the stocks in the available fishing grounds appear to have decreased to about 31 percent relative to 1967.
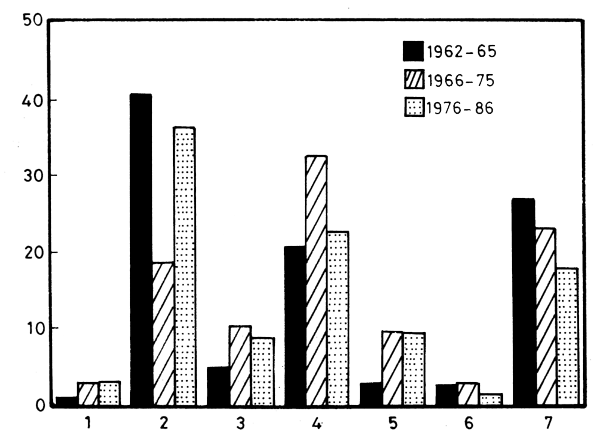
Figure 16. Percentage of the main catch components (1962–65, 1966–75 and 1976–86) (See Table 5)
All fish stock components were impacted in the period following the peak of 1960, but some were more vulnerable than others (Table 5, Figure 16). The pelagic stocks were more severely affected, while the demersal fish and the shrimp stocks were slower to respond.
The pelagic to demersal ratio (bony fish only) provides a sensitive index of the impact of river control on the ecosystem in an oligotrophic environment (Figure 18). The index decreased abruptly from 2.2:1 in 1962 to 0.5:1 in 1966. It remained more or less stable until 1978, the year the pelagic fisheries started to improve.
Again not all pelagic fish were affected to the same extent. The relative contribution of the pelagic carnivores, Sphyraena spp., Eutinnus spp., Trachurus spp., Lichia spp., Temnodom spp., appears to be on the increase (Figure 16). Their actual catch is decreasing but at a much slower rate. It is the planktivorous filter-feeders, Sardinella spp., and Boops boops, that suffered most both from intensive fishing pressure and from the thinning down of the phytoplankton crop. The Sardinella fisheries were formerly restricted to the Nile flood season and provided about 40 percent of the total marine catch in 1962–63 (13 to 18 × 103 t).
In 1968–1970 the catch fell to 3–7 percent (800 to 400 t). It appears however from trials made during the Soviet-Egyptian fishing cruises in 1970 that the Sardinella stocks were represented by a dispersed population in more offshore waters (Al-Kholy and El-Wakeel, 1975). The trammel nets traditionally used by fishermen to deal with the dense Sardinella shoals attracted to the Nile bloom in near-shore waters, lost their efficiency.
| Period | 1962–65 | 1966–75 | 1976–86 | |||
|---|---|---|---|---|---|---|
| Catch Component | Mean | % | Mean | % | Mean | % |
| Pelagic | ||||||
| 1. Carnivores | 333 | 1.0 | 286 | 3.0 | 420 | 3.0 |
| 2. Planktivores | 12240 | 40.3 | 1825 | 19.0 | 4810 | 36.0 |
| Demersal | ||||||
| 3. Omnivores | 1550 | 5.0 | 1010 | 10.5 | 1190 | 9.0 |
| 4. Carnivores | 6330 | 21.0 | 3145 | 32.5 | 3040 | 23.0 |
| 5. Other bony fishes | 875 | 3.0 | 930 | 9.5 | 1260 | 9.5 |
| 6. Cartilagenous fishes | 830 | 3.0 | 275 | 3.0 | 200 | 1.5 |
| 7. Invertebrates | 8215 | 27.5 | 2265 | 23.5 | 2415 | 18.0 |
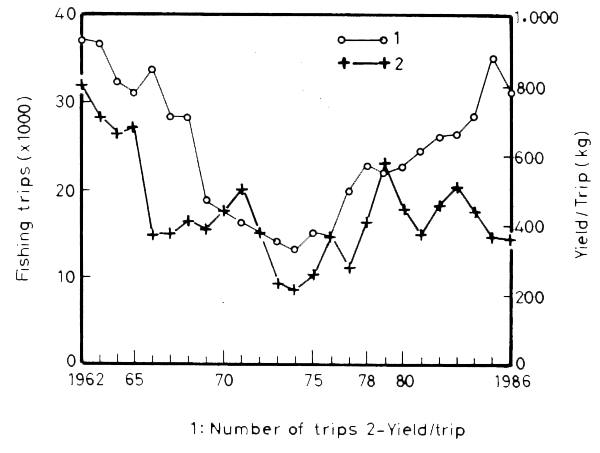
Figure 17. Annual mean yield for mechanized boats. Number of trips and yield per trips
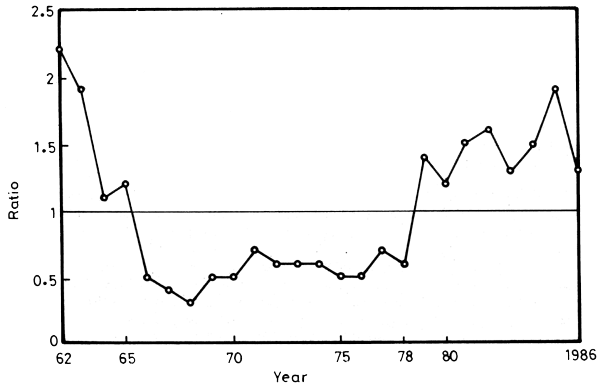
Figure 18. Pelagic to demersal ratio from 1962 to 1986
The shrimp fishery was next in importance to the Sardinella in the predamming phase. A catch of 7.1 to 8.4 x 10³ ty–1 was landed in 1962–64. It was also impacted, but owing to the more complex life-cycle of shrimps, the decline of this fishery was more gradual. In 1968 it yielded 40 percent of the pre-damming catch, but by 1972–75 it had dropped to 10 percent.
On the other hand, the species richness is on the increase. The Soviet-Egyptian expedition of 1970–71 recorded a more varied shelf population compared to that of 1966. While 81 species were recorded in 1966, the catch by side trawl and conical trap nets was represented by 118 species in 1970–71. This “enrichment” in fish species consisted of neritic mixed with deep-sea species and some Red Sea migrants. The rise in salinity allowed a shifting of the neritic habitat closer to the coast and created more favourable conditions for the Red Sea “Trans-isthmic” species. Species such as Scomberomorus commerson and Sphyraena chrysotaenia and Leiognathus klunzingericould extend nearer to the coast and hence began to appear in the catch (Al-Kholy and El-Wakeel, 1975).
3.3 The recent trends
The consistent trend that prevaled since 1962 (Figure 19) was abruptly reversed in 1978–79 (Figure 20). A phase of recovery begins and the total catch rises to 52 percent of its pre-damming (1962) level by 1981. The upward trend is maintained in spite of significant fluctuations in the following years (Figure 15). The Sardinella catch follows a parallel course, but the shrimp catch is slower to increase.
The trend reversal is not related to any environmental changes. Data on the level of nutrient salts, phytoplankton biomass and productivity in the trophogenic layer provide no evidence for any improvement since the River Nile was dammed (see previous chapter).
The sudden catch increase is to be interpreted as the result of a combination of factors: a) the restoration of normal conditions regarding fishing activities, and b) the steady increase in fishing effort and the use of improved fishing techniques.
Following the peace treaty of 1978, the security constraints on the movements of fishing boats were lifted. As a result, large areas of fishing grounds that had been unavailable since 1967 became available, and fishing operations could extend further offshore. Fish populations that had not been subjected to fishing stress for years could now be exploited. Moreover, the eastern zone (east from Port-Said), out of bounds also since 1967, became open to Egyptian fishing boats after 1980. The fishing grounds therefore expanded considerably in a short time.
The increase in total catch is also due to a rapid increase in fishing effort. The number of fishing trips increased steadily from 15 thousand in 1975 to 35 thousand in 1985, but the yield per trip did not grow in parallel. Figure 17 shows periodic fluctuations with peaks in the yield per trip separated by intervals of three to four years, a characteristic pattern of overfishing.
The increased use of the purse-seine gear coupled with light at night, the “Shansholla”, also played a decisive role in reversing the trend. Purse-seining was introduced in Egyptian waters in 1969, but on a small scale and remained restricted to the western zone (Rosetta to Alexandria). With the lifting of restrictions on fishing activities, purse-seining intensified considerably. During 1977, eleven purse-seiners made 42 trips landing 800 t of fish, while in 1978 there were 25 in the western zone which made 109 night trips landing 1 600 t (Faltas, 1983). The catch included both planktivorous and carnivorous pelagic fish, but the Sardinella catch alone accounted for 68–78 percent of the total catch (Table 6). The purse-seining practice extended rapidly, and, in parallel, the sardine catch jumped from 700 t in 1976 to 6500 t in 1979 (Figure 15).
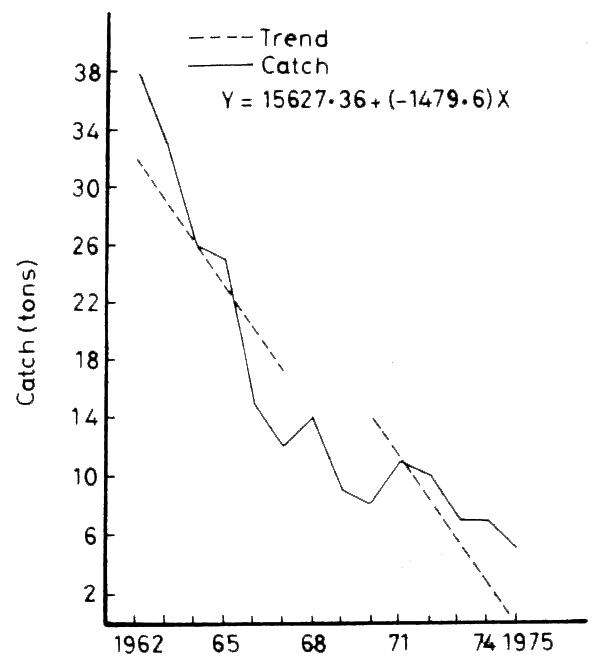
Figure 19. Trend of the total catch (1962–1977)
4. THE RED SEA IMMIGRANTS IN THE MEDITERRANEAN SEA
As a waterway, the Suez Canal is insignificant in volume compared to the two adjoining seas, a mere capillary tube connecting two large basins (Gruvel, 1936). Its effects on the water and salt budgets of both basins is of no consequence but its biological role is incomparably more effective. Since its opening in 1869, the canal became the site of an almost unique biogeographic experiment. The role of the canal as a pathway for migratory organisms does not entirely depend on its suitability as a habitat. Its physicochemical characteristics remained inhospitable for marine organisms from both seas for a long time.
Being a narrow and shallow navigational water course, its turbidity and its temperature are higher than those of the adjacent seas. The hypersalinity of the Bitter Lakes, south, and the periodical Nile dilution, north, acted for a long time as two opposite salinity barriers. Both barriers however became gradually eroded and have now almost disappeared. The circulation pattern is practically unchanged since the opening of the canal but the salinity level shows a drastic decrease throughout (Morcos, 1967 and 1980). The residual current tends to flow from the Red Sea to the Mediterranean Sea for ten months, reversing in August - September. This pattern has favoured the northward migration of Red Sea organisms into the Mediterranean rather than the opposite trend. It is now known that more than 200 invertebrate and fish species have succeeded in crossing the canal and establishing themselves in the East Mediterranean, where the salinity and temperature conditions are nearest to their original environment.
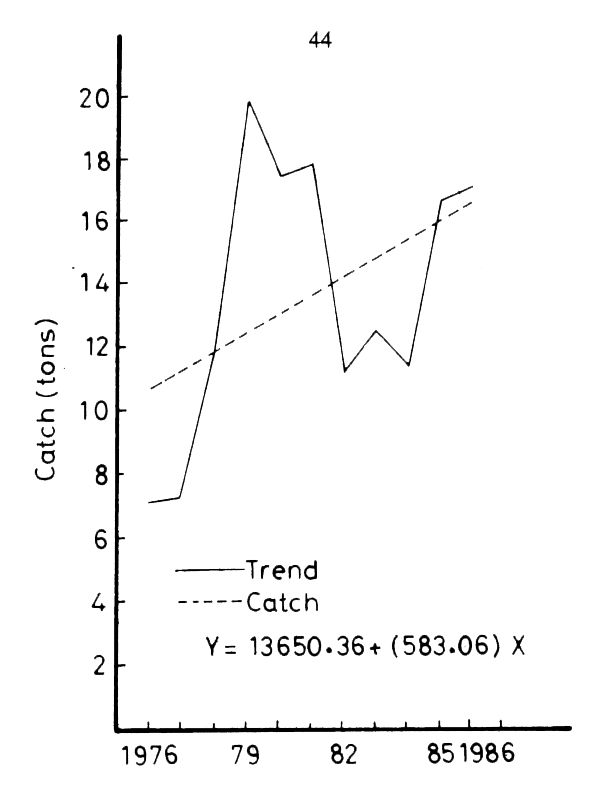
Figure 20. Trend of the total catch (1978–1986)
They include active organisms such as fish and macro-crustaceans, as well as passive ones such as microplankton forms, microcrustaceans, bivalves, ascidians and macroalgae. The rate of immigration seems to be accelerating. New records of migrants are increasing in number and their area of extension is also increasing (Halim, 1990b).
The flux of Indo-Pacific immigrants has enriched the East Mediterranean with several commercially valuable species (Halim, 1990). Macrocrustacea provide examples of early colonization of the East Mediterranean by Indo-Pacific species. According to Gruvel (1936) the edible crab Neptunus (Portunus) pelagicus appeared on the markets of Syria and Palestine in 1897. It soon became the most common commercial crab all round the East Mediterranean. Fifteen brachyuran immigrants are known from this basin (Almaça, 1985). Five Indo-Pacific and Red Sea penaeid shrimps were recorded from the Levantine basin around 1924 (Balss, 1927): Metapenaeus stebbingi (endemic to the Red Sea), M. monoceros, Penaeus japonicus, P. semisulcatus and Trachypenaeus curvirostris. The five species together with the Mediterranean P. kerathurus contribute several thousand tons to the commercial catch of Egyptian waters. The catch is composed mainly of P. semisulcatus and P. japonicus, the other species being minor contributors. In the spring of 1971 several specimens of an Indo-Pacific shrimp, Solenocera indica Nataraj, a new immigrant species, were caught from Abu-Qir Bay (Abdel-Razek, 1981).
| Species | 1977 | 1978 | ||
|---|---|---|---|---|
| Catch (kg) | % | Catch (kg) | % | |
| Sardinella aurita | 304181 | 38.0 | 588854 | 37.5 |
| Sardinella maderensis | 27226 | 3.4 | 58311 | 3.7 |
| Sardina pilchardus | 284379 | 35.5 | 414836 | 26.4 |
| Dussumieria acuta | 10050 | 1.2 | 14998 | 1.0 |
| Total sardine catch | 725836 | 78.1 | 1076999 | 68.6 |
| Engraulis encrasicholus | 59286 | 7.4 | 201632 | 12.8 |
| Boops boops | 44469 | 5.6 | 129909 | 8.3 |
| Trachurus mediterraneus | 21302 | 2.7 | 66552 | 4.2 |
| Scomber japonicus | 11536 | 1.4 | 40271 | 2.6 |
| Temnodon saltator | 17054 | 2.1 | 20164 | 1.3 |
| Sphyraena spp. | 7827 | 1.0 | 6436 | 0.4 |
| Trachynotus ovatus | 7741 | 1.0 | 17346 | 1.1 |
| Euthynnus alletteratus | 3888 | 0.5 | 9102 | 0.6 |
| Other fish | 1740 | 0.2 | 1573 | 0.1 |
| Total catch (kg) | 800679 | 1571285 | ||
Ben-Tuvia (1985) and others listed 41 Indo-Pacific fish species that reached the Mediterranean via the Suez Canal or via earlier historical connections between the two seas (Appendix 3). Among them 13 species at least are of commercial importance in Egyptian waters and in the southeastern Levantine Sea (Table 7).
| Dussumieria acuta | Stephanolepis diaspros |
| Saurida undosquamis | Atule djeddaba |
| Hemiramphus far | Upeneus asymmetricus |
| Apogonichthyoides nigripinnis | U. moluccensis |
| Leiognathus klunzingeri | Sphyraena chrysotaenia |
| Siganus rivulatus | Scomberomorus commerson |
There is no evidence of a drastic change in abundance of Mediterranean commercial species or of ecological displacement that could be attributed to the newcomers, although the information on ecological relationships is too meagre. The presence of two Indo-Pacific goatfishes Upeneus moluccensis and U. asymmetricus does not seem to influence the abundance of the corresponding Mediterranean species Mullus barbatus and M. Surmuletus:
No case has been recorded as yet of a native fish displaced by an immigrant (Ben-Tuvia, 1985). According to Ben-Tuvia (1985) the contribution of the trans-isthmic migrant fish species to the fishery of Israel in the year 1980–1982 was estimated to amount to about 16 percent of the Mediterranean catch. The immigrants are most abundant among demersal fishes on sandy and muddy bottoms.
The causes which led to the success of Indo-Pacific crabs and shrimps in crossing the Canal and settling in the East Mediteranean have been discussed by Almaça (1985). They also hold for fish. They are ascribed to: 1) their greater ability to withstand the higher salinity of the Canal; and 2) the paucity in species of the East Mediterranean relative to the Red Sea biota. This latter factor is conceived as a high pressure-low pressure competitive gradient between a highly diversified Indo-Pacific fauna and an impoverished eastern Mediterranean fauna.
The immigration of Red Sea fauna to the East Mediterranean or “Lessepsian migration” has been reviewed by Por (1978).
5. ACKNOWLEDGMENT
We are thankful to Dr Samy Fayek, Institute of Oceanography and Fisheries, Alexandria for his kind cooperation. The authors are grateful to Dr S.F.Hosny, Department of Oceanography, Faculty of Science, Alexandria, for compiling the list of fish species recorded from Egyptian waters. We are indebted to S. Pisanty, Chief of the Fisheries Technical Unit, Department of Fisheries, Ministry of Agriculture, Israel, for communicating information on Israeli fishing activities in Egyptian waters off the Sinai coast from 1967 to 1978.
6. REFERENCES
Abdel-Razek, F.A., M.M. Al-Hawary, Y. Halim and S.S. Drobisheva, 1981. A new Indo-Pacific Penaeid in the Mediterranean, Solenocera indica Nataraj. Bull. Inst. Oceanogr. Fish., ARE, 7(3):575–7
Al-Kholy, A. A. and S. K. El-Wakeel (Ed.), 1975. Fisheries of the South-Eastern Mediterranean Sea along the Egyptian coast. Bull. Inst. Oceanogr. Fish., ARE, 5:279 p.
Almaca, C., 1985. Evolutionary and zoogeographical remarks on the Mediterranean Fauna of Brachyuran Crabs. In Mediterranean Marine Ecosystems, edited by Maria Moraitou-Apostolopoulou and Vassili Kiortsis, Plenum Press, New York, pp. 347–66
Azov, Y., 1986. Seasonal patterns of phytoplankton productivity and abundance in nearshore oligotrophic waters of the Levant Basin (Mediterranean). J. Plank. Res., 8(1):41–53
Balss, H., 1927. “XIV Berichte” uber die Crustacea Decapoda Natantia und Anomura. “The Zoological Results of the Cambridge Expedition to the Suez Canal, 1924” Trans. Zool. Soc., London, 22(2):7 p.
Basturk, O., A.C. Saydam, A. Yilmaz and I. Salihoglou, 1988. Distributions of nutrient elements in the Northeastern Mediterranean: physical factors affecting the distribution. Rapp. Comm. Int. Mer. Medit., 31:(2):43 p.
Ben-Tuvia, A., 1985. The Impact of the Lessepsian (Suez Canal) fish migration on the Eastern Mediterranean ecosystem. In Mediterranean Marine Ecosystems, edited by Maria Moraitou-Apostolopoúlou and Vassili Kiortsis, Plenum Press, New York, pp. 367–75
Berman, T., J. Azov and D. Townsend, 1984. Understanding oligotrophic oceans: Can the Eastern Mediterranen be a useful Model? In Lecture Notes on Coastal and Estuarine Studies. Edited by O. Holm-Hansen, L. Bolis and R. Gilles, Springer-Verlag, Berlin, pp. 101–12
Bologa, A.S., 1986. Seasonal data on planktonic primary production in south-eastern Mediterranean waters. Rapp. Comm. Int. Mer Medit., 30(2):189
Bulletin Hydrographique, 1948. Service Hydrographique, Bureau du Conseil Permanent International pour l'Exploration de la Mer. Charlottenlund Slot, Denmark, 1952.
Dowidar, N. M., 1984. Phytoplankton biomass and primary productivity of the south-eastern Mediterranean. In Marine Science of the North-Western Indian Ocean and Adjacent Waters. Deep-Sea Research, 31(6-8 A): 983–1000
El-Zarka, S. and R. Koura, 1965. Seasonal fluctuations in the production of the important food fishes of the UAR waters of the Mediterranean Sea. Alex. Inst. Hydrobiol. Fish., Notes and Mem. 74:69 p.
Emara, H., Y. Halim and S. A. Morcos, 1973. Oxygen, phosphate and oxidizable organic matter in the Mediterranean waters along the Egyptian coast. Rapp. Comm. Int. Mer Medit., 21(7):345–7
Faltas, S.N., 1983. Study of purse-seine fisheries in Egyptian Mediterranean waters with special reference to the biology of Sardine in the catch. M.Sc. thesis, Faculty of Science, Alexandria. (Manuscript), 194 p.
FAO, 1987. Review of the State of World Fishery Resources. FAO Fish. Circ., (710)Rev.5:64 p.
Frihy, O.E., 1988. Nile delta shoreline changes: Aerial photographic study of a 28-year period. J. Coast. Res., 4:597–606
Frihy, O.E., S. M. Nasr, M. H. Ahmed and M. El Raey, 1992. Temporal shoreline and bottom changes of the inner continental shelf off the Nile Delta, Egypt. J. Coast. Res., 7:465–75
Goi Ami, D. and A. Ben-Tuvia, 1986. New records of fishes from the Mediterranean coast of Israel including Red Sea immigrants. Cybium, 10(3):285–91
Grofit, E. (Ed.), 1991. The fisheries of Israel in figures. Ministry of Agriculture, Department of Fisheries, Tel Aviv.
Gruvel, A., 1936. Contribution à l'exploitation de la faune du Canal de Suez. Mémoires, Institut d'Egypte, 29:255 p.
Halim, Y., 1960. Observations on the Nile bloom of phytoplankton in the Mediterranean. J. Cons., 26(1):57–67
Halim, Y., 1990. On the potential migration of Indo-Pacific plankton through the Suez Canal. Bulletin de l'Institut Oceanographique, Monaco, no special, 7:11–27
Halim, Y., 1991. The impact of human alterations of the hydrological cycle on ocean margins. In Ocean Margin Processes in Global Change. Edited by R.F.C. Mantoura, J.-M. Martin and R. Wollast. John Wiley and Sons Ltd., pp. 301–27
Halim, Y., S.K. Guergues and H.H. Saleh, 1967. Hydrographic conditions and plankton in the South East Mediterranean during the last normal Nile flood (1964). Int. Rev. Ges. Hydrobiol., 52(3):401–25
Halim, Y. and S.A. Morcos, 1965. Le role des particules en suspension dans l'eau du Nil en crue dans la repartition des sels nutritifs au large de ses embouchures. Rapp. Proc. verb. Reun. Comm. int. Explor. scient. Mer Medit., 18(3):733–6
Halim, Y., R. Riad and A.R. Hassan, 1991. The Cephalopoda (Mollusca) of the Mediterranean Sea around Alexandria. Bull.Fac.Sci.Alex.Univ., 31(A):264–84
Hecht, A., N. Pinardi and A. Robinson, 1988. Currents, water masses, eddies and jets in the Mediterranean Levantine basin. J.Phys.Oceanogr., 18:1320–50
Hopkins, T.S., 1978. Physical processes in the Mediterranean basins. In Estuarine Transport Processes, B. Kjerfve (Ed.), W. BellBaruch Library in Marine Science, Pergamon Press, 7: 269–310
Jacques, G., 1989. L'oligotrophie du milieu pélagique de la Méditerranée occidentale: un paradigme qui s'est trompé? Bylletin de la Société zoologique de France, 114(3):17–29
Krom, M.D., 1988. Dissolved nutrients in the Levantine basin of the Eastern Mediterranean Sea. Rapp. Comm. int. Mer. Medit., 31(2):42
Lacombe, H., 1975. Aperçus sur l'apport à l'océanographie physique des recherches récentes en Méditerranée. Bulletin Etude en commun de la Méditerranée, N° spécial, Monaco, 7:25 p.
Lacombe, H. and P. Tchernia, 1960. Quelques traits généraux de l'hydrologie méditerranéenne. Cah. Océanogr., 12:527–47
Misdorp, R. and G. Sestini, 1976. The Nile Delta: main features of the continental shelf topography. Proceedings of the Seminar on the Nile Delta Sedimentology. UNDP/Unesco Project on Coastal Protection Studies, Alexandria, pp. 145–61
Morcos, S.A., 1967. On the origin of the Mediterranean intermediate water. IUGG-International Association of Physical Oceanography, No. 126. Berne, September 1967.
Morcos, S.A., 1972. Sources of Mediterranean intermediate water in the Levantine Sea. In Studies in Physical Oceanography, a Tribute to Georg Wüst on his 80th Birthday, Edited by Arnold A. Gordon, Gordon and Breach, New-York, 2:185–206
Morcos, S.A., 1980. Seasonal changes in the Suez Canal following its opening in 1869: Newly discovered hydrographic records of 1870–1872. In Oceanography: The Past, M. Sears and D. Merriman (Eds), Springer-Verlag, pp. 290–305
Morcos, S.A. and O. El-Rayis, 1973. The Levantine intermediate water, oxygen and nutrients off Alexandria. Thalassia Yugoslavica, 9(1–2):13–18
Morcos, S.A. and H.M. Hassan, 1976. The water masses and circulation in the South-eastern Mediterranean. Acta Adriatica, 18:195–218
Mostafa, H.M.M., 1985. Phytoplankton production and biomass in the South-east Mediterranean waters off the Egyptian coast. M.Sc. Thesis, Faculty of Science, Alexandria, 215 p. (manuscript)
Mouneimne, N., 1977. Liste des poissons de la côte du Liban (Méditerranée orientale). Cybium, 1:37–66
Nielsen, J.N., 1912. Hydrography of the Mediterranean and adjacent waters. In Report of the Danish Oceanographic Expedition 1908–1910 to the Mediterranean and adjacent waters. Copenhagen, 1:72–191
Oren, O.H., 1970. Seasonal changes in the physical and chemical characteristics and the production in the low trophic level of the Mediterranean waters off Israel. Sea Fish.Res., Haifa. Spec. publ., 23 p.
Ovchinnikov, I.M., 1966. Circulation in the surface and intermediate layers of the Mediterranean. Oceanology, 6:48–57
Özsoy, E., 1989. A review of the Levantine Basin circulation and its variability during 1985–1988. In Dynamics of Atmosphere and Oceans, 15:421–56
Por, F.D., 1978. Lessepsian Migration. Ecological Studies, 23. Springer, 228 p.
Rosentraub, Z., J.Bishop and A. Hecht, 1985. State of the Sea. Physical Aspects. In Multidisciplinary Studies of the Eastern Mediterranean, 1984–1985. An annual Report on Physical, Chemical and Biological Investigations, Israel Oceanographic Limnological Research Ltd., pp. 23–47
Shukry, N.M., 1950. The mineralogy of some Nile sediments. Q. jl.Geol.Soc.Lond., 105:511–34, 106:466–7
Sestini, G., 1976. Geomorphology of the Nile delta. UNDP/Unesco Proc. Seminar on Nile Delta Sedimentology, October 1975, Alexandria, pp. 12–24
Smith, S.E. and A. Abdel-Kader, 1988. Coastal erosion along the Egyptian delta. J.Coast.Res., 4:245–55
Sournia, A., 1973. La production primaire planctonique en Méditerranée. Essai de mise á jour. Bulletin Etude en commun de la Méditerranée. N° spécial 5, Monaco., 128 p.
Stanley, D.J., 1988. Low sediment accumulation rates and erosion on the middle and outer Nile delta shelf of Egypt. Mar.Geol., 84:111–7
Thomas, G.H. and W.F. Wadie, 1989. Trends of fish catch and factors responsible for its fluctuations in the Egyptian Mediterranean sea waters. Bull.High Inst.Pub.Health, XIX (4):883–908
Toma, S. and M.S. Salama, 1980. Changes in bottom topography of the western shelf of the Nile Delta since 1922. Mar.Geol., 36:325–39
Unesco, 1984. Physical Oceanography of the Eastern Mediterranean: An overview and research plan. Unesco Reports in Marine Science, 30:36 p.
Wadie, W.F., 1982. Observations on the catch of the most important fishes along the Egyptian continental shelf in the South Eastern part of the Mediterranean Sea. Bull.Inst.Oceanogr.Fis., ARE, 8(2):212–27
Weikert, H., 1988. New information on the productivity of the deep Eastern Mediterranean and Red Seas. Rapp.Comm.int.Mer Medit., 31(2):30
White, G.F., 1988. The environmental effects of the High Dam at Aswan. Environment, 30:5–40
Wüst, G., 1961. On the vertical circulation of the Mediterranean Sea. J.Geophys.Res., 66:3261–71
Yilmaz A., 1988. Deep chlorophyll a maximum in the Northeastern Mediterranean. Rapp.Comm.int.Mer Medit., 31(2):44
APPENDIX I
FISHES OF THE MEDITERRANEAN SEA ADJACENT TO EGYPT
Compiled by
C.F.H. HOSNY
Oceanography Dept., Fac. Sci., Alex. Univ., Alexandria, Egypt.
A. Cartilagenous fishes
| Sharks | |
|---|---|
| F. Hexanchidae | Hexanchus griseus (Bonnaterre, 1788) |
| F. Heptranchidae | Heptranchias perlo (Bonnaterre, 1788) |
| F. Odontaspidae | Odontaspis taurus (Rafinesque, 1810) |
| F. Lamnidae | Carcharodon carcharias (Linnaeus, 1758) |
| Isurus oxyrinchus (Rafinesque, 1810) | |
| F. Scyliorhinidae | Scyliorhinus canicula (Linnaeus, 1758) |
| S. stellaris (Linnaeus, 1758) | |
| Galeus melastomus (Rafinesque, 1810) | |
| F. Sphyrnidae | Sphyrna zygaena (Linnaeus, 1758) |
| F. Carcharhinidae | Carcharhinus plumbeus (Nardo, 1827) |
| C. limbatus (Valenciennes, 1841) | |
| C. obscurus (Lesueur, 1818) | |
| Prionace glauca (Linnaeus, 1758) | |
| F. Triakidae | Mustelus mustelus (Linnaeus, 1758) |
| M. asterius (Cloquet, 1821) | |
| M. mediterraneus (Quignard & Capape, 1972) | |
| F. Squalidae | Squalus acanthias (Linnaeus, 1758) |
| S. blainvillei (Risso, 1826) | |
| Centrophorus granulosus (Schneider, 1801) | |
| F. Oxynotidae | Oxynotus centrina (Linnaeus, 1758) |
| F. Squatinidae | Squatina squatina (Linnaeus, 1758) |
| S. oculata (Bonaparte, 1840) | |
| Rays | |
| F. Rhinobatidae | Rhinobatos rhinobatos (Linnaeus, 1758) |
| Rhinobatos cemiculus (E. Geoffroy Saint-Hilaire, 1817) | |
| F. Rajidae | Raja alba (Lacepede, 1803) |
| R. batis (Linnaeus, 1758) | |
| R. rondeletti (Bougis, 1959) | |
| R. miraletus (Linnaeus, 1758) | |
| R. radula (Delaroche, 1809) | |
| R. naevus (Muller & Henle, 1841) | |
| R. microocellata (Montagu, 1818) | |
| R. clavata (Linnaeus, 1758) | |
| R. montagui (Fowler, 1910) | |
| R. brachyura (Lafont, 1873) | |
| R. asterias (Delaroche, 1809) | |
| R. radiata (Donovan, 1808) | |
| R. oxyrinchus (Linnaeus, 1758) | |
| Bathyraja spinicauda (Jensen, 1914) | |
| F. Dasyatidae | Dasyatis pastinaca (Linnaeus, 1758) |
| D. centrura (Mitchill, 1815) | |
| Gymnura altavela (Linnaeus, 1758) | |
| F. Myliobatidae | Myliobatis aquila (Linnaeus, 1758) |
| Pteromylaeus bovinus (E. Geoffroy Saint-Hilaire, 1817) | |
| F. Rhinopteridae | Rhinoptera marginata (E. Geoffroy Saint-Hilaire, 1817) |
| F. Torpedinidae | Torpedo torpedo (Linnaeus, 1758) |
| T. marmorata (Risso, 1810) |
B. Bony Fishes
| Teleosts | |
|---|---|
| F. Clupeidae | Sardinella aurita (Valenciennes, 1847) |
| S. maderensis (Lowe, 1839) | |
| Sardina pilchardus (Walbaum, 1792) | |
| Alosa fallax nilotica (Geoffroy Saint-Hilaire, 1808) | |
| F. Dussumieriidae | Dussumieria acuta (Valenciennes, 1847) |
| F. Engraulidae | Engraulis encrasicolus (Linnaeus, 1758) |
| F. Anguillidae | Anguilla anguilla (Linnaeus, 1758) |
| F. Muraenidae | Muraena helena (Linnaeus, 1758) |
| Gymnothorax unicolor (Delaroche, 1809) | |
| F. Congridae | Conger conger (Linnaeus, 1758) |
| F. Ophichthidae | Dalophis imberbis (Delaroche, 1809) |
| F. Synodidae | Synodus saurus (Linnaeus, 1758) |
| Saurida undosquamis (Richardson, 1848) | |
| F. Chlorophthalmidae | Chlorophthalmus agassizi (Bonaparte, 1840) |
| F. Lophidae | Lophius piscatorius (Linnaeus, 1758) |
| F. Gadidae | Merluccius merluccius (Linnaeus, 1758) |
| Micromesistus poutassou (Risso, 1826) | |
| Trisopterus minutus capelanus (Lacepede, 1800) | |
| Phycis blennioides (Brunnich, 1768) | |
| F. Eretmophoridae | Lepidion lepidion (Risso, 1810) |
| F. Gobiesocidae | Lepadogaster lepadogaster (Bonnaterre, 1788) |
| F. Platycephalidae | Platycephalus indicus (Linnaeus, 1758) |
| F. Belonidae | Belone belone (Linnaeus, 1761) |
| F. Hemiramphidae | Hemiramphus balao (Lesueur, 1838) |
| H. far (Forskal, 1775) | |
| F. Scombresocidae | Scombresox saurus (Walbaum, 1792) |
| F. Exocoetidae | Exocoetus volitans (Linnaeus, 1758) |
| Cheilopogon heterurus (Rafinesque, 1810) | |
| F. Cyprinodontidae | Aphanius fasciatus (Nardo, 1827) |
| F. Atherinidae | Atherina (Hepsetia) boyeri (Risso, 1810) |
| Atherina hepestus (Linnaeus, 1758) | |
| F. Zeidae | Zaeus faber (Linnaeus, 1758) |
| F. Lamprididae | Lampris guttatus (Brunnich, 1788) |
| F. Macroramphosidae | Macroramphosus scolopax (Linnaeus, 1758) |
| F. Syngnathidae | Hippocampus hippocampus (Linnaeus, 1758) |
| Syngnathus typhie (Linnaeus, 1758) | |
| S. acus (Linnaeus, 1758) | |
| Entelurus aequoreus (Linnaeus, 1758) | |
| F. Scorpaenidae | Sebastes viviparus (Kroyer, 1845) |
| Scorpaena scorfa (Linnaeus, 1758) | |
| S. porcus (Linnaeus, 1758) | |
| S. notata (Rafinesque, 1810) | |
| S. loppei (Cadenat, 1943) | |
| S. elongata (Cadenat, 1943) | |
| Helicolenus dactylopterus (Delaroche, 1809) | |
| F. Triglidae | Trigloporus lastoviza (Brunnich, 1768) |
| Aspitrigla cuculus (Linnaeus, 1758) | |
| Trigla lyra (Linnaeus, 1758) | |
| T. lucerna (Linnaeus, 1758) | |
| Lepidotrigla cavilone (Lacepede, 1801) | |
| F. Cephalacanthidae | Cephalacanthus volitans (Linnaeus, 1758) |
| F. Serranidae | Dicentrarchus labrax (Linnaeus, 1758) |
| D. punctata (Bloch, 1792) | |
| Epinephalus guaza (Linnaeus, 1758) | |
| E. alexandrinus (Valenciennes, 1828) | |
| E. aeneus (E. Geoffroy Saint-Hilaire, 1817) | |
| E. caninus (Linnaeus, 1758) | |
| Serranus cabrilla (Linnaeus, 1758) | |
| S. scriba (Linnaeus, 1758) | |
| F. Apogonidae | Apogon imberbis (Linnaeus, 1758) |
| F. Echeneidae | Echeneis naucratus (Linnaeus, 1758) |
| F. Pomatomidae | Pomatomus saltator (Linnaeus, 1758) |
| F. Carangidae | Caranx crysos (Mitchill, 1815) |
| Naucratus ductor (Linnaeus, 1758) | |
| Seriola dumreili (Risso, 1810) | |
| Trachynotus ovatus (Linnaeus, 1758) | |
| [=Lichia glauca (Linnaeus, 1758)] | |
| Trachurus trachurus (Linnaeus, 1758) | |
| T. saurus (Risso, after C. & V., 1833) | |
| T. mediterraneus (Steindachner, 1868) | |
| T. picturatus (T.E. Bowdich, 1825) | |
| F. Mullidae | Mullus barbatus (Linnaeus, 1758) |
| M. surmuletus (Linnaeus, 1758) | |
| Upeneus moluccensis (Bleeker, 1855) | |
| U. assymmetricus (Linnaeus, 1758) | |
| F. Siganidae | Siganus luridus (Rupell, 1828) |
| S. rivulatus (Forsskal, 1775) | |
| F.Sparidae | Dentex dentex (Linnaeus, 1758) |
| D. macrophthalmus (Bloch, 1791) | |
| D. gibbosus (Rafinesque, 1810) | |
| D. maroccanus (Valenciennes, 1830) | |
| Sarpa salpa (Linnaeus, 1758) | |
| Boops boops (Linnaeus, 1758) | |
| Oblada melanura (Linnaeus, 1758) | |
| Diplodus vulgaris (E. Geoffroy Saint-Hilaire, 1817) | |
| D.annularis (Linnaeus, 1758) | |
| D. Sargus (Linnaeus, 1758) | |
| D. puntazzo (Gmelin, 1789) | |
| Sargus fasciatus (Valenciennes, 1843) | |
| S. noct (Valenciennes, 1843) | |
| Pagrus spinifer (Cuv. & Val.) | |
| Sparus auriga (Valenciennes, 1843) | |
| S. pagrus (Linnaeus, 1758) | |
| S. ehrenbergi (Valenciennes, 1830) | |
| S.aurata (Linnaeus, 1758) | |
| Lithognathus mormyrus (Linnaeus, 1758) | |
| Pagellus erythrinus (Linnaeus, 1758) | |
| P. acarne (Risso, 1826) | |
| P. bogaraveo (Brunnich, 1768) | |
| Pagrus pagrus (Linnaeus, 1758) | |
| F.Sciaenidae | Argyrosomus regius (Asso, 1801) |
| [=Sciaena aquila (Lacepede, 1803) | |
| Sciaena umbra (Linnaeus, 1758) | |
| [=Corvina nigra (Bloch, 1792)] | |
| Umbrina cirrosa (Linnaeus, 1758) | |
| F. Pomacentridae | Chromis chromis (Linnaeus, 1758) |
| F. Mugilidae | Mugil cephalus (Linnaeus, 1758) |
| Chelon labrosus (Risso, 1826) | |
| Liza saliens (Risso, 1810) | |
| L. ramada (Risso, 1826) | |
| L. aurata (Risso, 1810) | |
| F. Sphyraenidae | Sphyraena sphyraena (Linnaeus, 1758) |
| S. viridensis (Cuvier, 1829) | |
| S. chrysataenia(?) | |
| F. Labridae | Labrus bimaculatus (Linnaeus, 1758) |
| L. viridis (Linnaeus, 1758) | |
| L. bergylta (Ascanius, 1767) | |
| L. merula (Linnaeus, 1758) | |
| Symphodus mediterraneus (Linnaeus, 1758) | |
| S. tinca (Linnaeus, 1758) | |
| Coris julis (Linnaeus, 1758) | |
| Thalassoma pavo (Linnaeus, 1758) | |
| Xyrichthys novacula (Linnaeus, 1758) | |
| F. Scaridae | Sapriosoma cretense (Linnaeus, 1758) |
| F. Uranoscopidae | Uranoscopus scaber (1.) |
| F. Trachinidae | Trachinus draco (Cuvier, 1829) |
| T. araneus (Cuvier, 1829) | |
| F. Blenniidae | Blennius ocellaris (Linnaeus, 1758) |
| B. pavo (Risso, 1810) | |
| F. Gobiidae | Gobius cobitis (Pallas, 1811) |
| G. auratus (Risso, 1810) | |
| G. niger (Linnaeus, 1758) | |
| [= G. jozo (Linnaeus, 1758)] | |
| F. Scombridae | Scomber scombrus (Linnaeus, 1758) |
| S. japonicus (Houttuyn, 1780) | |
| Scomberomorus commerson (Lacepede, 1800) | |
| Sarda sarda (Bloch, 1793) | |
| Orcynopsis unicolor (E. Geoffroy Saint-Hilaire, 1809) | |
| Thunnus alalunga (Bonnaterre, 1788) | |
| Euthynnus alleteratus (Rafinesque, 1810) | |
| E. (Katsuworus) pelamis (Linnaeus, 1758) | |
| Auxis rochei (Risso, 1810) | |
| [=A. thazard (Lacepede, 1801)] | |
| F. Istiophoridae | Tetrapturus belone (Rafinesque, 1810) |
| F. Xiphiidae | Xiphius gladius (Linnaeus, 1758) |
| F. Trichiuridae | Trichiurus lapturus (Linnaeus, 1758) |
| Lepidotus caudata (Euphrasen, 1788) | |
| F. Leiognathidae | Leiognathus klunzingeri (Steindachner, 1898) |
| F. Citharidae | Citharus macrolepidotus (Bloch, 1787) |
| [=C.Linguatula(Linnaeus, 1758)] | |
| F.Scphthalmidae | Lepidorhombus wiffiagonis(Walbaum 1792) |
| F.Bothidae | Bothus podus (Delaroche, 1809) |
| Arnoglossus rueppelli (Cocco, 1844) | |
| A. laterna (Walbaum, 1792) | |
| A. thori (Kyle, 1913) | |
| F. Soleidae | Solea vulgaris (Quensel, 1806) |
| S. impar (Bennett, 1831) | |
| S. lascaris (Risso, 1810) | |
| Pegusa laskaris (Risso, 1810)]? | |
| S. variegata (Donovan, 1808) | |
| Microchirus hispidus (Rafinesque, 1814) | |
| M. ocellatus (Linnaeus, 1758) | |
| Buglossidium luteum (Risso, 1810) | |
| [=Microchirus boscanion (Chabanaud, 1926)] | |
| F. Holocentridae | Holocentrus ruber (Rafinesque, 1814) |
| F. Balistidae | Balistes carolinensis (Gmelin, 1789) |
| F. Monacanthidae | Stephanolepis hispidus (Linnaeus, 1758) |
| F. Ostraciontidae | Acanthostracion notacanthus (Bleeker, 1863) |
| F. Molidae | Mola mola (Linnaeus, 1758) |
| Ranzania laevis (Pennant, 1776) |
APPENDIX II
INVERTEBRATES IN THE COMMERCIAL CATCH
| Cephalopoda (Halim et al., 1991) | Crustaceans (from various sources) |
|---|---|
| Sepia officinalis Linnaeus | Penaeus japonicus Bate |
| S. elegans Blainville | P. semisulcatus De Haan |
| Alloteuthis media Linnaeus | P. kerathurus Forskal |
| Loligo vulgaris Lamarck | Metapenaeus monoceros Fabricius |
| L. forbesi Stanstrip | M. stebbingi Nobili |
| Illex coindettii Verany | Trachypenaeus curvirostris Stimpson |
| Eledon moschata Lamarck | Solenocera indica Nataraj |
| Octopus vulgaris Cuvier | (Abdel-Razek et al., 1981) |
| O. macropus Risso | Neptunus (Portunus) pelagicus (Linn.) |
APPENDIX III
RED SEA FISHES IN THE LEVANT BASIN
(Mouneimne, 1977; Ben-Tuvia, 1985; Goi and Ben-Tuvia, 1986)
| Dasyatidae | 1. | Himantura uarnak (Forsskal, 1775) |
| Clupeidae | 2 | Dussumieria acuta (Valeniennes, 1847) |
| 3. | Etrumeus teres (Dekay, 1842) | |
| 4. | Herklotsichthys punctatus (Rüppell, 1837) | |
| 5. | Spratelloides delicatulus (Bennett, 1831) | |
| Myreanosicidea | 6. | Muraenesox cinereus (Forsskal, 1775) |
| Synodontidae | 7. | Saurida undosquamis (Richardson, 1848) |
| Ariidae | 8. | Arius thalassinus (Rüppell, 1835) |
| Exocoetidae | 9. | Paraexocoetus mento(Valencciennes, 1846) |
| Belonidae | 10. | Tylosurus choram (Rüppell, 1835) |
| Hemiramphidae | 11. | Hemiramphus far (Forsshal, 1775) |
| Cyprinodontidae | 12. | Aphanius dispar (Rüppell, 1828) |
| Atherinidae | 13. | Atherinops lacunosus (Eloch and Schneider, 1801) (syn. |
| Pranesus pinguis Lacepede) | ||
| Holocentridae | 14. | Sargocentron ruber (Forsskal, 1775) |
| Scorpaenidae | 15. | Sebastapistes nuchalis (Gunther, 1874) |
| Platycephalidae | 16. | Platycephalus indicus (Linnaeus, 1758) |
| Serranidae | 17. | Epinephelus malabaricus (Eloch and Schneider, 1801) (syn. |
| Epinephelus tauvina (nec Forsskal) | ||
| Theraponidae | 18. | Authistes puta (Cuvier, 1629) |
| 19. | Pelates quadrilineatus (Bloch, 1790) | |
| Apogonidae | 20. | Apogonichthyoides nigripinnis (Cuvier, 1828) |
| Sillaginidae | 21. | Sillago sihama (Forsskal, 1779) |
| Rachycentridae | 22. | Rachycentron canadum (Linnaeus, 1758) |
| Carangidae | 23. | Atule djeddaba (Forsskal, 1775) |
| Leiognathidae | 24. | Leiognathus klunzingeri (Steindachner, 1898) |
| Lutjanidae | 25. | Lutjanus argentimaculatus (Forsskal, 1775) |
| Mullidae | 26. | Upeneus asymmetricus (Lachner, 1954) |
| 27. | Upeneus moluccensis (Bleeker, 1855) | |
| Haemulidae | 28. | Pomadasys stridens (Forsskal, 1775) |
| Sparidae | 29. | Crenidens crenidens (Forsskal, 1975) |
| Pempheridae | 30. | Pempheris vanicolensis (Cuvier, 1931) |
| Mugilidae | 31. | Liza carinata (Ehrenbeig, in: Cuv. @ Val., 1936) |
| Sphyraenidae | 32. | Sphyraena chrysotaenia (Klunzinger, 1884) |
| Gobiidae | 33. | Oxyurichthys papuensis (Valenciennes, 1837) |
| Siganidae | 34. | Siganus luridus (Rüppell, 1828) |
| 35. | Siganus rivulatus (Forsskal, 1775) | |
| Scombridae | 36. | Rastrelliger kanagurta (Russell, 1803) |
| 37. | Scomberomorus commerson (Lacepede, 1800) | |
| Callionymidae | 38. | Callionymus (Calliurichthys) filamentosus (Linnaeus, 1758) |
| Cynoglossidae | 39. | Cynoglossus sinusarabici (Chabanaud, 1931) |
| Monacanthidae | 40. | Stephanolepis diaspros (Fraser-Erunner, 1940) |
| Tetraodontidae | 41. | Lagocephalus spadiceus (Richardson, 1944) |