In most cases, reservoirs or dams1 are constructed for domestic and agricultural water supplies or for electricity generation, but not for fish production. Fish production is usually an additional benefit.
Reservoirs, which are modified river systems, often have a poor or incomplete fish population. Species that are adequately adapted to the reservoir environment are often absent from the river system, while riverine species are not always able to fill all niches in the reservoirs. Besides this, the different species do not always enter the reservoirs. In seasonal rivers, fishes have to enter the reservoirs from sources upstream from the dam, or have to pass over the spillway from downstream. Not all species are adapted to these migrations.
Different management interventions can be used to increase the fish yield from reservoirs, and stocking is one such intervention. Increasing production, providing better sports fishing, or controlling weeds, snail or mosquito larvae are also common reasons for stocking fish.
In those cases where the desired fish species do not enter the reservoir naturally, they can be introduced. Reservoirs that dry up seasonally, or occasionally, can be restocked to ensure a fast re-establishment of a fish population.
Zimbabwe is a relatively dry country. The dry season is severe and few streams or rivers continue to flow throughout the year. The only perennial rivers are the large rivers along the borders of the country.
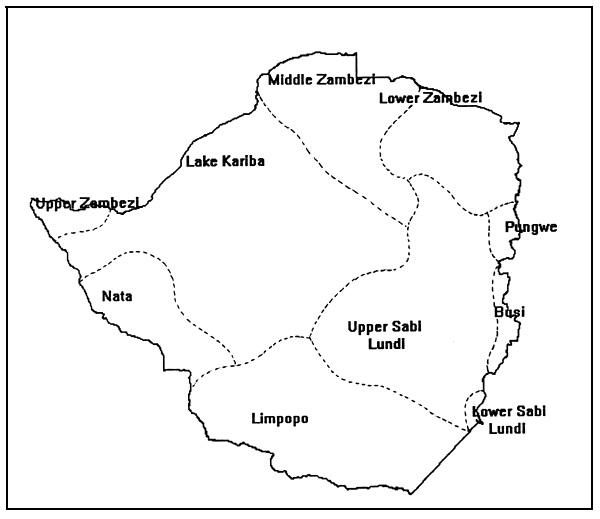
Freshwater systems are usually restricted and well defined in extent. Besides the physical limits of water bodies, there are other factors which govern the distribution of fish within the systems. Chief among these are physical barriers, physio-chemical tolerances, ecological barriers, and biological and behaviour factors (Skelton, 1993). Bell-Cross and Minshull (1988) divide the waters in Zimbabwe into ten river systems based on fish species distribution. Their catchments are shown in Figure 1.

Figure 1. River catchments determining fish distribution in Zimbabwe (after Bell-Cross and Minshull, 1988)
The total number of fish species identified in the country is 132. The number of species in the different river systems varies from 5 in the Nata system to 74 in the Upper Zambezi system.
Reservoirs have created new ecosystems by changing the environmental conditions for fish. There is a decrease in water current, water level fluctuations, temperature fluctuations, etc. The system is more stable, and non-riverine species can become established in the water body. As a result, species dominating in the reservoirs differ from those in the rivers. Labeo cylindricus and Clarias gariepinus are found in most reservoirs in Zimbabwe because they easily enter reservoirs by passing the spillways. Barbus spp. are also commonly found in the reservoirs. However these species are neither the most productive nor most preferred for consumption or as sports fish. The more desirable species do not always establish naturally in the reservoirs, and for that reason many reservoirs have been stocked with additional species.
Communal dams, where fish production for food is given priority, have been stocked with Oreochromis mossambicus, Oreochromis macrochir, and/or Tilapia rendalli. Private and recreational dams are also stocked with species preferred as sports fish, and have additionally been stocked with Cyprinus carpio, Micropterus salmoides, Serranochromis robustus and Oncorhynchus mykiss. More recently, private dams have also been stocked with Oreochromis niloticus.
O. mykiss, and to a lesser extent M. salmoides, are regularly restocked in private or recreational dams. Other fish species are only stocked once, after which natural reproduction ensures that populations are maintained.
As a result of such stocking activities, the natural distribution of fish species has changed in Zimbabwe. O. mossambicus and O. macrochir are now found throughout the country, although their natural presence was restricted to a few river systems. C. carpio, M. salmoides, O. mykiss and O. niloticus are “exotics”, but are now found in many areas.
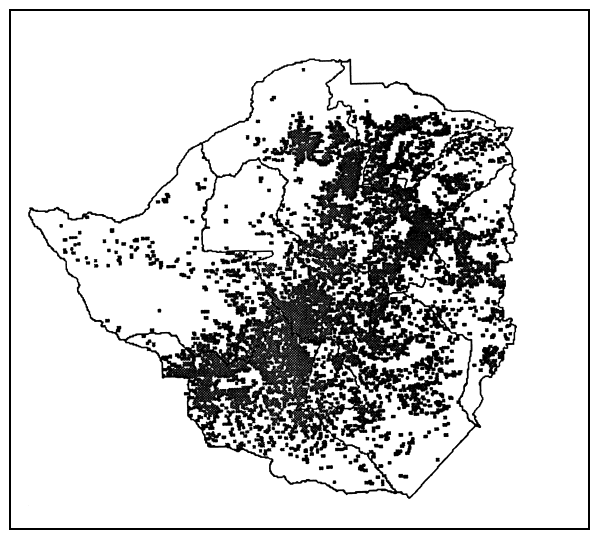
Many water conservation dams have been built over the years. The total number of dams in the country is estimated to be around 12 000. The dam database developed by the Department of Water Development contains entries on over 9 800 dams. This number includes a number of probable duplicates and omits some 600 dams without geographical references. The locations of these circa 9 800 dams are given in Figure 2. Although the locations of all the individual dams are not visible, because of the overlap of marks, the figure provides a good impression of the geographical concentration of dams.

Figure 2. Locations of 9 836 dams in Zimbabwe (Source: Fisheries Unit, Agritex, Zimbabwe)
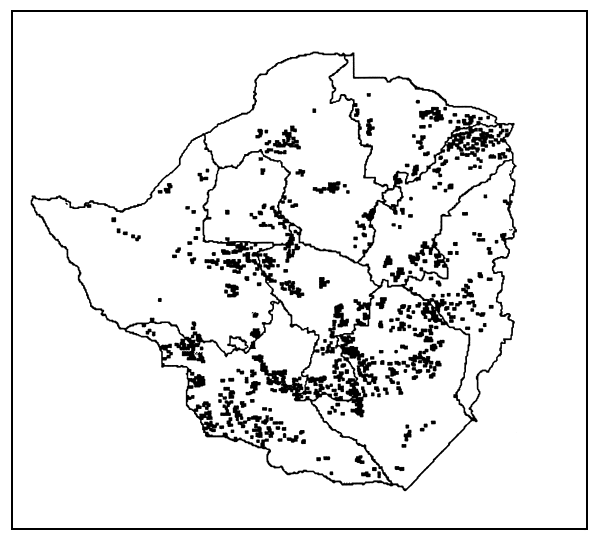
The distribution of dams in the communal areas is presented in Figure 3. The drier areas of the country — Matabeleland South and Masvingo Province — have a high concentration of communal dams. Table 1 gives the distribution of the dams in the different types of farming systems in the whole county. The dams in the resettlement areas are included in the category of large-scale commercial farming.

Figure 3. Locations of the 1 686 dams in the communal areas of Zimbabwe (Source: Fisheries Unit, Agritex, Zimbabwe)
Table 1. Numbers of dams by land classification
| Land classification | Number of dams |
|---|---|
| Communal | 1 686 |
| Large-scale commercial and resettlement | 7 575 |
| Small-scale commercial | 349 |
| Parks, forest, etc. | 87 |
| Urban | 113 |
| Large dams | 8 |
| TOTAL | 9 818 |
As the dams in Zimbabwe are mainly built for the purpose of storing water, size in most cases is recorded as a volume. The number of dams and the water storage capacity of the dams per Province is given in Table 2. The majority of the dams have a storage capacity of less than 100 000 m3, which corresponds to a surface area of less than 10 ha. Actual data on surface areas is only available for a few dams. This is unfortunate, as such information is more useful than volume when planning restocking programmes and other fisheries activities.
Table 2. Number of dams by water storage capacity
| Water storage capacity (m3) | No. of dams | Proportion of total |
|---|---|---|
| > 1 000 000 | 265 | 2.7% |
| 500 000 – 1 000 000 | 235 | 2.4% |
| 100 000 – 500 000 | 1 480 | 15.1% |
| < 100 000 | 7 838 | 79.8% |
| TOTAL | 9 818 | 100% |
As Figure 2 shows, dams are unevenly distributed in Zimbabwe. There is a much higher concentration of dams in the commercial farming areas than in other types of land occupation. Dams in the commercial farming areas are used for crop irrigation and livestock watering. In the communal areas the dams are used for domestic water supply and livestock watering. A small number of communal dams are used for irrigation.
All dams in the communal areas are intensively fished, mainly with rod and line. In 1991/92, the Fisheries Unit of the Department of Agriculture, Technical and Extension Services (Agritex) of the Ministry of Lands, Agriculture and Water Development (MLAWD) carried out a survey to estimate the importance of the rod-and-line fishery. A summary of the results of the survey is given in Table 3.
Table 3. Data on the rod-and-line fishery in Zimbabwe
| Area | Dam | Estimated size (ha) | No. of fishermen per day | Average length of fishing session (hours) | Average catch (g/h) | Annual yield (kg/ha) |
|---|---|---|---|---|---|---|
| Harare | Balantine | 6 | 19 | 5.0 | 57 | 329 |
| Cleveland | 30 | 10 | 4.8 | 66 | 39 | |
| Glen Norah | 15 | 23 | 5.4 | 89 | 269 | |
| Greengrove | 10 | 31 | 5.0 | 34 | 192 | |
| Henry Hallam | 15 | 21 | 6.6 | 88 | 297 | |
| Pr. Edward | 100 | 32 | 4.8 | 128 | 72 | |
| North | Borera | 15 | 8 | 4.2 | 75 | 61 |
| Chikono | 18 | 10 | 5.1 | 90 | 93 | |
| Chindunduma | 30 | 27 | 4.4 | 56 | 81 | |
| Mt. Darwin | 30 | 14 | 3.2 | 98 | 53 | |
| Murehwa | 15 | 12 | 4.9 | 134 | 192 | |
| Mutonde | 25 | 6 | 4.2 | 45 | 17 | |
| Nyakarowa | 25 | 28 | 4.5 | 94 | 173 | |
| Nyakasikana | 15 | 7 | 2.7 | 122 | 56 | |
| Nyamabadura | 12 | 11 | 4.8 | 118 | 190 | |
| Nyanjenje | 20 | 9 | 5.5 | 225 | 203 | |
| South | Chedosvo | 15 | 25 | 5.6 | 58 | 198 |
| Chirindi | 12 | 6 | 5.3 | 56 | 54 | |
| Chizimba | 15 | 15 | 4.0 | 99 | 145 | |
| Masosva | 30 | 24 | 4.8 | 206 | 189 | |
| Mlelezi | 30 | 37 | 3.8 | 56 | 96 | |
| Pambe | 18 | 25 | 4.2 | 53 | 113 | |
| AVERAGE | 23 | 18 | 4.7 | 93 | 146 |
The data show that, on average, a rod-and-line fisher catches around 400 g of fish per fishing day of 4.5 hours. All fish caught is for home consumption. On average, 20 people fish at a dam each day. The annual yield from the rod-and-line fishery at a 20 ha dam is around 3 000 kg. Thus, the importance of communal dams in supplying animal protein is obvious.
The rod-and-line fishery on communal dams is further characterized by the fact that only people from communities around the dam fish. The mean distance from their homes to the dam is less than 3 km. In Harare, town people travel further to fish. Half of the fisherfolk are women, and many young people fish — the average age is 28 years. The investments made are minimal: no fee is charged and rods are made from sticks, so that the only money spent is for buying hooks and line.
The main species caught by the rod-and-line fisherfolk are bream (Oreochromis spp. and Tilapia spp.), of which mainly the juveniles are caught. The average size is around 10 g. The most preferred species are the Oreochromis spp. and Tilapia spp., followed by the Labeo spp. C. gariepinus is mentioned as the most preferred species by only 4% of the fisherfolk in the northern part of the country, and by 15% in the southern part.
At some communal dams there is also a gill net fishery, which is controlled by the Department of National Parks and Wildlife Management (DNPWM). Fisherfolk wishing to use nets require a fishing permit. The procedure to acquire a fishing licence is cumbersome, demanding and time consuming. As a result, the number of fishing licences issued for communal and resettlement dams is limited — only 60 issued in 1992 — compared to the large number of dams in the country. Gill net fishing is often practised by a group of farmers on a part-time basis.
A normal catch from a gill net fishery is 10 kg/day. These fish are mainly sold — either fresh in the area close to the dam, or dried for selling to vendors who transport the fish up to 100 km. Through these sales the fisherfolk receive an important income. Although this might seem small, the income earned from fishing is regular and is therefore an important supplement for a farmer who normally receives a large amount of money only once a year, after harvest.
Apart from the rod-and-line and the legal gill net fishery, other fishing methods are used. The most common are trap fishing, seine netting, unlicensed gill-netting, and the use of double stick nets (Kamukore). The catches from these methods are unknown but the use of these methods is common, so that the total yield is believed to be significant.
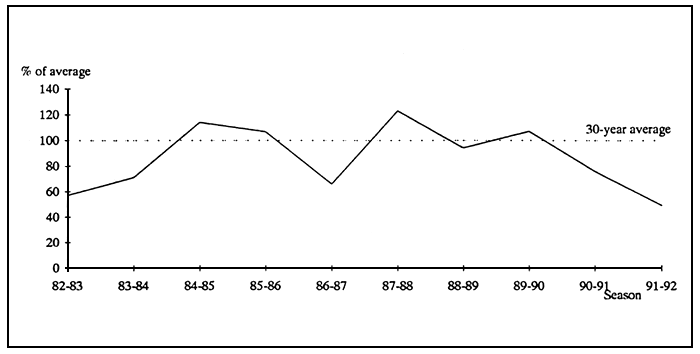
In 1991/92, Zimbabwe experienced its worst drought year on record. Average rainfall, weighted by province, was 49.3% of the norm, based on a 30-year average. This drought had followed a dry 1990/91 season (76.0% of normal), and a generally dry decade (78.5% of normal). Figure 4 shows the fluctuations in average rainfall over the period 1982–1992.

Figure 4. Average annual rainfall as a percentage of the 30-year average
The drought had a great impact on the country's economy. Harvests failed and many of the farm animals died. In some districts in the drier areas of the country, which are cattle ranching areas, up to 95% of the herds of communal farmers died. It will take a number of years before the herds will be back to the normal level again. During that time, money and animal protein will be extremely scarce in these areas.
Zimbabwe had to import most of its food during the year of the drought and had to assist a large part of the rural community with drought relief programmes. This put a great pressure on public resources.
Table 4 gives the rainfall figures for each Province by season for the last ten years, and averages for the last ten years and the last thirty years. Rainfall data for stations situated in the middle of each Province are used. In 1991/92, the normally drier areas in the south of the country (Masvingo and Matabeleland South) were badly affected, but even the usually higher rainfall areas of the Eastern Highlands (Nyanga) experienced extreme drought conditions. Water had become scarce in all areas, and many dams dried out.
Table 4. Annual rainfall per Province for 1982/92, and the 10- and 30-year averages
(Source: Meteorological Institute, Zimbabwe)
| Station | Province | 82/83 | 83/84 | 84/85 | 85/86 | 86/87 | 87/88 | 88/89 | 89/90 | 90/91 | 91/92 | '82–'92 | '61–'91 |
|---|---|---|---|---|---|---|---|---|---|---|---|---|---|
| Bindura | Mash. Centr. | 580 | 700 | 950 | 1143 | 644 | 1035 | 772 | 1047 | 707 | 509 | 735 | 847 |
| Marondera | Mash. East | 537 | 437 | 951 | 1121 | 657 | 971 | 863 | 931 | 435 | 408 | 664 | 648 |
| Chinoyi | Mash. West | 544 | 564 | 868 | 890 | 511 | 780 | 1090 | 670 | 769 | 530 | 656 | 800 |
| Gweru | Midlands | 410 | 470 | 751 | 626 | 385 | 771 | 506 | 751 | 554 | 348 | 506 | 661 |
| Masvingo | Masvingo | 175 | 415 | 781 | 583 | 271 | 771 | 501 | 599 | 281 | 96 | 407 | 614 |
| Mutare | Manicaland | 314 | 578 | 955 | 871 | 393 | 921 | 684 | 711 | 476 | 260 | 560 | 791 |
| Nyanga | Manicaland | 860 | 818 | 1312 | 1404 | 766 | 1534 | 986 | 1514 | 866 | 335 | 945 | 1237 |
| Gwanda | Mat. South | 321 | 271 | 512 | 305 | 313 | 661 | 347 | 441 | 446 | 176 | 345 | 478 |
| Lupane | Mat. North | 156 | 488 | 494 | 382 | 422 | 679 | 511 | 563 | 493 | 520 | 428 | 582 |
Although some of the smaller dams dry out regularly, river systems always hold water in other dams, weirs or pools in years with normal rainfall. This water is a source of fish when the dried-out dams fill during the rainy season. Most of the dams that dry out regularly are thus naturally restocked with fish. However, during the drought of 1991/92, many more dams than normal dried out, and all the weirs and pools were without water. Natural restocking would not have occurred as in previous years. Most of the sources of fish upstream dried up, and dried-up dams downstream meant another barrier to free fish migration. For many dams it would have taken several years before fish would enter the dams again.