![]()
![]()
![]()
The team leaders (Agritex AEWs) had all received formal training in aquaculture and fisheries, and had been working for several years in extension and stocking of fish ponds and dams. The fisheries assistants did not have formal training in fisheries, but had long experience with fish stock surveys, work on government fish farms and research stations, and with stocking of dams. The DNPWM driver had been working for a long period on fisheries research stations and had experience with fishing and stocking of reservoirs.
Local casual workers were recruited at each source dam to assist with the catching of the fish. Normally six workers were employed on a daily basis. These workers received on-the-job training.
The restocking teams needed to spend three weeks continuously in the field. This required camping equipment that would enable them to stay for such a period at the source dams. Good camping equipment is produced in Zimbabwe and all the required equipment could be purchased locally. The specifications and the cost of the camping equipment is given in Table 6.
Table 6. Camping equipment for a three-member restocking team
| Description | Units | Unit price ($Z) | Total cost ($Z) |
|---|---|---|---|
| Cottage tent (2 × 3 m) | 2 | 1855.39 | 3710.78 |
| Groundsheet | 2 | 240.00 | 480.00 |
| Folding chairs | 4 | 88.00 | 352.00 |
| Compact table | 1 | 225.30 | 225.30 |
| Gas cooker | 1 | 412.50 | 412.50 |
| Gas bottle (30 kg) | 1 | 180.00 | 180.00 |
| Stretcher bed | 3 | 185.50 | 556.50 |
| Hurricane lamp | 2 | 59.00 | 118.00 |
| Mosquito net | 3 | 72.25 | 216.75 |
| Sleeping bag | 3 | 198.50 | 595.50 |
| Metal bucket | 1 | 24.00 | 24.00 |
| Washing dish | 1 | 53.00 | 53.00 |
| Cooking pot | 2 | 27.95 | 55.90 |
| Teapot | 1 | 36.95 | 36.95 |
| Food container | 5 | 5.50 | 27.50 |
| Cup | 4 | 6.25 | 25.00 |
| Plate | 4 | 4.50 | 18.00 |
| Cutlery | 62.00 | ||
| Water jerrycan | 1 | 48.50 | 48.50 |
| TOTAL | 7196.60 |
(Exchange rate (January 1993): 1 $US = 5.38 $Z)
The most appropriate gears to use for catching fish alive in communal dams were beach seines. In order to catch both the larger and the smaller fishes, seine nets with meshes of 25 and 16 mm stretched mesh were used. The seine nets were set in the water from a small rowing boat and were pulled manually. This, and the fact that, in most dams, large clean stretches of beach are rare, limited the size of the nets. The seine nets were 150 meshes deep and 50 m and 20 m long respectively, when mounted.
The sides of the net (wings) were mounted at a hanging ratio of 0.70. The central part of the seine net had a hanging ratio of 0.40. This mounting ensured that the central part formed a pocket or bag when the net was pulled in. The hanging ratio is defined as the ratio between the length of the rope divided by the stretched length of netting attached to it. The total length of the netting material unmounted was 81 m. Details on the mounting of the 50 m net are given in Table 7.
Table 7. Mounting of the 50 m seine net, stretched mesh size 25 mm
| Mounted length (m) | Hanging ratio (%) | Stretched length (m) | Depth (meshes) | Depth (m) | |
|---|---|---|---|---|---|
| Wing | 19.6 | 0.70 | 28 | 150 | 2.66 |
| 10.0 | 0.40 | 25 | 150 | 3.45 | |
| Wing | 19.6 | 0.70 | 28 | 150 | 2.66 |
| TOTAL | 49.2 | 81 |
The 50 m net was mounted on nylon ropes (10 mm diameter) at top and bottom, and the 20 m net was mounted on 8 mm ropes. The bottom line held 100 g weights at 1 m intervals.
In reservoirs with muddy bottoms, normal bottom lines may not be very efficient, as they have a tendency to dig into and drag through the mud. This causes the seine net to roll up, with consequent loss of fish. Also, when dragging the mud and the fish together, the gills of the fish may clog up and survival rates are reduced. To avoid this, a mud line should be used. Mud lines are composed of a number of relatively small diameter ropes, loosely tied together. These ropes should sink without extra weights. They tend to maintain contact with the bottom without either digging into or lifting off the sediment. The mud lines will, however, fray and wear rapidly in reservoirs having firm sediments (Stickney, 1979). It was decided that the seine nets would not be fitted with a mud line, because problems with excessive mud had occurred in only a few dams during previous seine net operations.
The top rope held polystyrene floats of 80 mm diameter and 50 mm thickness at 1 m intervals. The polystyrene floats are more prone to breakage than rubber or plastic floats, but the last two were not locally available. Materials and prices for the mounting of a seine net are given in Table 8.
Table 8 Materials and prices for constructing a 50 m seine net
| Description | Quantity | Total price ($Z) |
|---|---|---|
| Netting (150 meshes deep × 25 mm mesh) | 81 m | 1536.76 |
| Polystyrene floats | 51 pieces | 32.64 |
| Lead weights | 51 pieces | 107.10 |
| Rope (10 mm Æ nylon) | 120 m | 496.00 |
| Mounting twine (16 ply) | 1 kg | 100.00 |
| Labour for mounting | 100.00 | |
| TOTAL | 2372.50 |
(Exchange rate (January 1993): 1 US$ = 5.38 $Z)
After catching, the fish were stored in hapas [net cages] to await transport. This storage had the advantage that the badly injured fish died in the hapa and so would not affect the water quality during transport. The fish are also starved for a period. During the starvation period their intestines clear out so the water in the transporters stays clean, which increases considerably the possible transport time. Berka (1986) estimated that the transport time is reduced to half when fish are not starved. It took several pulls with the seine net to catch enough fish for transporting, so that even when the fish were not stored for a longer period, the hapas were used to store the fish during the fishing exercise. Each fishing team was equipped with 4 hapas: 2 of 4×2×2 m and 2 of 3×1.5×1.5 m. Each hapa was placed in the water at a depth of 1 to 1.5 m, with 6 metal poles.
Between catching and storing, the fish were weighed. A 10 kg (50 g precision) spring scale was used for this purpose.
Prices for all fishing equipment are given in Table 9.
Table 9 Fishing equipment for one restocking team
| Description | Units | Units cost ($Z) | Total price ($Z) |
|---|---|---|---|
| Seine net (50 m × 150 mesh × 25 mm mesh) | 1 | 2 372.50 | 2 372.50 |
| Seine net (20 m × 150 mesh × 16 mm mesh) | 1 | 1 170.00 | 1 170.00 |
| Hand nets and weighing nets | 3 | 15.00 | 45.00 |
| Hapa (6 × 2 × 2 m) | 2 | 195.00 | 390.00 |
| Hapa (3 × 1.5 × 1.5 m) | 2 | 136.00 | 272.00 |
| Hapa holders | 24 | 11.00 | 264.00 |
| Scale (10 kg × 50 g) | 2 | 195.00 | 390.00 |
| Container (50 l) | 1 | 114.00 | 114.00 |
| Bucket | 3 | 12.50 | 37.50 |
| Boat | 1 | 4 700.00 | 4 700.00 |
| TOTAL | 9 755.00 |
(Exchange rate (January 1993): 1 $US = 5.38 $Z)
There are different methods of transporting fish. The most widespread system for long distance transport is the use of closed systems. Fish are transported in a plastic bag or sealed container holding a relatively small amount of water and a large amount of oxygen. The advantages of this system are the reduced volume and weight of the transport, and the low price of the plastic bags. In most cases the bags are not returned to the sender, so that transport is one way only. Closed systems are often used for long distance transport where fish are packed in one place and where all fish are released at the same location.
During the restocking exercise, fish of different sizes and species were packed and transported, often under rough conditions. These conditions required more durable transport equipment than plastic bags.
Tanks and trailers were designed for fish transport. The design criteria were:
Local production and possible to repair locally.
Strong enough to withstand rough handling in the field.
Large transport capacity.
Easy to operate.
Enable release of fish in small quantities.
A locally manufactured tank of TAURUS Spraying Systems was modified for the transport of fish. The tank was made of fibreglass and had a capacity of 500 1. The main modifications from the original tank were an enlarged opening with lid in the top, and an outlet pipe in the bottom (100 mm diameter). Metal hooks were placed inside the tank for hanging a net cage. The net was used for storing fish too large for release through the outlet pipe, and to divide the catch for stocking smaller volumes. The tank is shown in Figure 6, and a technical drawing is given in Appendix 1. The tank was mounted on a metal frame and fitted in the back of a small pickup truck.
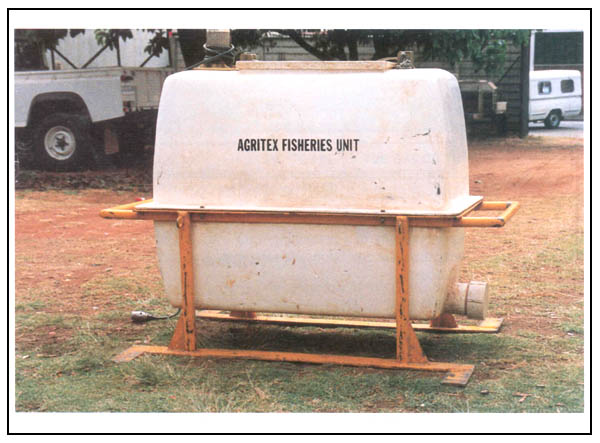
Figure 6. Fish transport tank
The fish transport trailer was constructed from metal sheet, and made by a local metal workshop. It had three compartments with capacities of 400, 700, and 700 1 of water respectively. The net weight of the trailer was 600 kg. Each compartment had an individual outlet to the back of the trailer. This outlet at the back was essential for approaching the dams, as driving alongside the dam was impossible in most cases. Access was difficult and the shores were often muddy. Driving backwards to the water had the advantage that the vehicle remained on higher ground, reducing the risk of getting stuck. The trailer is illustrated in Figure 7, and a technical drawing is given in Appendix 2.
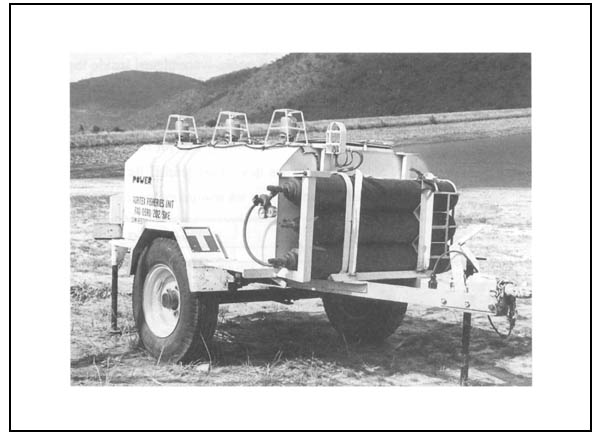
Figure 7. Fish transport trailer
The total transport capacity of a restocking team with one tank and one trailer was 2 300 1 of water. Under the local conditions, this capacity was sufficient for transporting 450 kg of fish for 8–12 hours.
For filling the tanks and the trailer, a portable water pump was used, operated by a 3.6 Kw petrol engine.
The cost of the transport equipment is given in Table 10.
Table 10. Fish transport equipment for one restocking team
| Description | Units | Unit prices ($Z) | Total price ($Z) | |
|---|---|---|---|---|
| Fish transport trailer | ||||
| construction | 1 | 16 260.00 | 16 260.00 | |
| O2 pipes and valves | 1 | 2 300.00 | 2 300.00 | |
| agitator | 3 | 572.00 | 1 716.00 | |
| diffuser | 3 | 708.50 | 2 125.50 | |
| flow meter | 1 | 312.00 | 312.00 | |
| electric installation | 1 | 719.07 | 719.07 | |
| Fish transport tank | ||||
| construction | 1 | 3 006.25 | 3 006.25 | |
| agitator | 1 | 572.00 | 572.00 | |
| Water pump | 1 | 5 183.00 | 5 183.00 | |
| pipes and fittings | - | 260.00 | 260.00 | |
| jerry can | 1 | 157.00 | 157.00 | |
| Outlet sleeve | 1 | 150.00 | 150.00 | |
| MS-222 (100 g) | 1 | 390.00 | 390.00 | |
| No foam (500 ml) | 5 | 39.00 | 195.00 | |
| TOTAL | 33 345.82 | |||
(Exchange rate (January 1993): 1 $US = 5.38 $Z)
The vehicles had to accommodate a minimum of three passengers, be able to tow the fish transport trailer (total loaded weight 2 400 kg), and carry the fish transport tank (loaded weight 500 kg). Enough space was required to carry all the transport, camping and fishing equipment, including the boat. A 4 wheel drive option and sufficient ground clearance were essential for driving off-road in rough terrain. To meet these specifications, and based on availability, a Nissan 4.2 diesel pickup and two Landrover 2.4 TDi pickups were purchased. The vehicles were fitted with an extra front bar for protection during off-road driving; extra supports for carrying the boat; and with a triple electrical system, for the trailer lights, the trailer aerators, and the tank aerator. Prices are given in Table 11.
Table 11. Vehicle-related capital costs for one restocking team
| Description | Price ($Z) |
|---|---|
| Landrover pickup | 123 425.00 |
| Protection bar | 465.00 |
| Boat supports | 625.00 |
| Electrification | 2 120.00 |
| TOTAL | 126 635.00 |
(Exchange rate (January 1993): 1 $US = 5.38 $Z)
Maintaining good water quality during the transport of the fish is crucial for their survival. The single most important factor is providing an adequate level of dissolved oxygen for the fish. However, an abundance of oxygen within a tank does not necessarily indicate that the fish are in good condition. The ability of fish to use oxygen depends on their tolerance to stress, water temperature, pH, and concentrations of carbon dioxide and metabolic products such as ammonia (Berka, 1986).
The species used during the restocking programme, Oreochromis and Tilapia, are known for their ability to withstand low oxygen levels. Oxygen levels as low as 1 ppm have been recorded in tilapia ponds (Chervinski, 1982). However, during handling and transport, fish become stressed and their oxygen consumption increases. To keep the fish in good condition during transport, the oxygen level should be much higher than the minimum level at which the fish can survive in a stable and calm environment.
There are different ways of maintaining high oxygen levels. Agitators mechanically mix water and air, and through this mixing oxygen dissolves in the water. The use of agitators requires sufficient contact area of water and air and cannot be used in closed systems. The use of agitators requires air above the water and thus the tanks cannot be filled completely. This has the disadvantage that water and fish splashes around in a not completely filled tank, which may increase injuries to the fish. Injection of oxygen into the water uses pure oxygen. While the oxygen bubbles to the water surface it is dissolved in the water. The efficiency of this system depends on the size of the bubbles and the distance they have to travel to reach the surface of the water.
The tanks were fitted with a battery-operated, 12 V, 1/20 HP agitator to maintain high oxygen levels. Each compartment of the trailer was also fitted with an agitator, but was also connected to bottled oxygen. The oxygen was diffused into the bottom of the tanks through microbubble diffusers (100–250 μm-sized bubbles). Before these diffusers were installed, normal airstones were used during two fish transporting trips. These airstones produced much larger bubbles, which did not dissolve well in the water. A much greater problem was that the airstones had a very low resistance and the oxygen flow had to be regulated with valves. Vibration during driving caused the valves to open, and all the oxygen was released. The micro-diffusers had a high resistance and not more than 0.5 1 of oxygen would pass the diffuser per minute. Thus the oxygen flow was permanently regulated.
The temperature of the water is another important factor influencing the condition of the fish during transport. A lower temperature decreases the metabolic rate and activity of the fish, and so reduces the oxygen consumption. Reduced activity lessens the risk of injuries to the fish. The oxygen dissolving capacity of water also increases with decreasing temperatures. For these reasons, ice is often used to lower the temperature during long transport of fish. However, the temperature cannot be reduced quickly because the fish have to adapt slowly to changing temperatures. At the destination, the fish have to adapt again to higher temperatures. Temperature changes should be gradual and not more than a few degrees Celsius per hour.
During the restocking programme, the transport time would be relatively short, and the water temperature at the source and at destination could be expected to be similar. For these reasons, cooling of the water during transport did not seem necessary. Moreover, it is not easy to get ice or other cooling facilities in remote areas. Painting the equipment white was the only measure taken to minimize any temperature increase during transport.
Aquaculturists recommend transport of fish during the cold season and advise limiting the handling of fish during summer. However, experience in Zimbabwe has shown that survival after handling of Oreochromis and Tilapia species is much higher at high temperatures, and handling and transport should be avoided at low (<18°C) temperatures. At low temperatures the fish do not easily recover from injuries or infections. It seems that the species used during the programme are well adapted to withstand low oxygen levels and high temperatures, but are less resistant to infections at low temperatures. For this reason it was decided to discontinue the programme during the cold months of July, August and September, whilst in June the programme concentrated on the lower and warmer areas of the country.
Other important water quality factors during the transport of fish are Ph, CO2 and NH3 levels. Because the fish were starved before transport their excretion of faeces and metabolic products was minimal, and the use of the agitators prevented excessive accumulation of the gases in the water. Therefore it did not seem necessary to take extra measures to ensure the good quality of the water.
To reduce the metabolic rate of the fish and their activity, the use of tranquilizers is often recommended. Tranquilizers are mainly used when large fish, such as brood stock, are transported over longer distances. For the restocking programme it did not seem necessary to use tranquilizers during all transport, since most fish transported were small and were transported over a relatively short distance. A small amount of MS-222 (tricaine methanesulfonate) was purchased for possible use during exceptionally long transports.
Formation of foam can occur on water which is heavily laden with organic material. This foam can interfere with the aeration of the water, especially when agitators are used. It also makes the observation of fish in the tanks difficult. Each restocking team carried a silicone-based surfactant to reduce foam formation. This chemical would only be used when excessive foam formed on the water surface.
The importance of acclimatizing fish to the water before releasing them is often stressed by fish farmers and fisheries personnel. Maar (1956) recommends that fish should never be put straight in the water, but that the water at the destination should be added to the container for up to one hour. He argues that this is essential as the fish must have time to get accustomed to the temperature of the water and to its composition. It was expected that the composition of the water between the source dam and the stocked dams would not differ much, since they were located in the same area, and most of the time in the same river system. Because of the relatively short transport time, water temperature should not increase much. Direct release was therefore assumed possible. In those cases where small amounts of fish were released, the fish were scooped out of the tank with a net and released immediately. If all fish from one tank was to be released, the tank would be connected to a flexible hose and all the water, including the fish, would be washed directly into the dam.
The catch per fishing day ranged from 2.5 to 140 kg, the average catch was 31 kg (median: 26 kg). Securing enough fish for restocking the dams at the required stocking rates was one of the main problems of the whole exercise. A total of 4 500 kg of fish was caught. On a species basis, 80.5% of the fish stocked was O. mossambicus, 10.1% T. rendalli and 9.0% O.macrochir, with a small amount of T. sparrmanii. The average weight of the fish caught was 16 g, which brought the total number of fingerlings to 280 000.
On two occasions, 90% of the fish died during overnight storage. Large amounts of fish were stored in the hapas in a eutrophic reservoir. The mortality was caused by low oxygen levels in the hapas. On all the other occasions, the mortality of fish was very low. During overnight storage of 30 kg (on average), mortality was between 0.5 and 2 kg. When the fish were transported on the same day as capture, the reported mortality was even less. The mortality during transport was always less than 0.5 kg, and in most cases no mortality was reported.
It should not be concluded, however, that transport immediately after capture would reduce the overall mortality. Direct mortality may occur when fish are handled roughly or kept out of the water for extended periods. Injuries that occurred during handling, such as loss of mucus, loss of scales, damage to the skin, or internal injuries, may lead to disease and delayed mortality. Part of this delayed mortality becomes visible during the storage of fish, but remains undetected when fish are restocked immediately. Immediate transport however, does reduce the handling of the fish and reduces chances of injuries.
Mortality after stocking was not studied systematically, but at several dams which were visited after being restocked no mortality was noticed, or only a few dead fish were seen.
In Harare, the Fisheries Unit made an overall restocking workplan. The workplan was based on the assumption that the restocking teams spent three weeks continuously in the field and returned to Harare for one week. During the three-week period, one team was expected to stock around 30 dams in one or two Districts. Before the teams were sent out, a Fisheries Unit specialist visited the Districts and discussed and prepared the workplan at the District Offices. All three teams operated in the same Province or in adjacent Provinces. The teams operated independently, each with its own programme. The advantage of operating in the same area was that preparing the programmes could be done more efficiently, and check-up visits would require less travelling.
Upon arrival in a district, the teams reported to the District Office, to get detailed information about the location of the source dams and the dams to be restocked. A person(s) was allocated to assist the team in finding their way in the area. In most cases, the AEW based in the area of the source dam was given this task.
After the briefing at the District Office, the teams went to the source dam, where they put up their camp, informed the community, and made a request for casual workers to assist with the fishing. From leaving Harare to getting set up at the source dam usually took one day.
The next day fishing started in the morning. Fish were caught, selected, weighed, stocked in the hapas (Figure 8), and transported. A sample was taken to estimate the average weight and the number. Upon arriving at the dam to be stocked, normally the day after the fish were caught, the surface area was estimated. Fish were supposed to be stocked at rates of 3 to 5 kg/ha. Two to three people were normally occupied with the transport and stocking (Figure 9). One team member with the casual workers continued catching fish at the source dam. All the dams reported dry in the vicinity of the source dam were stocked. Thereafter, or when catches at the source dam were low, the team moved to the next source dam to stock the dams in that area.
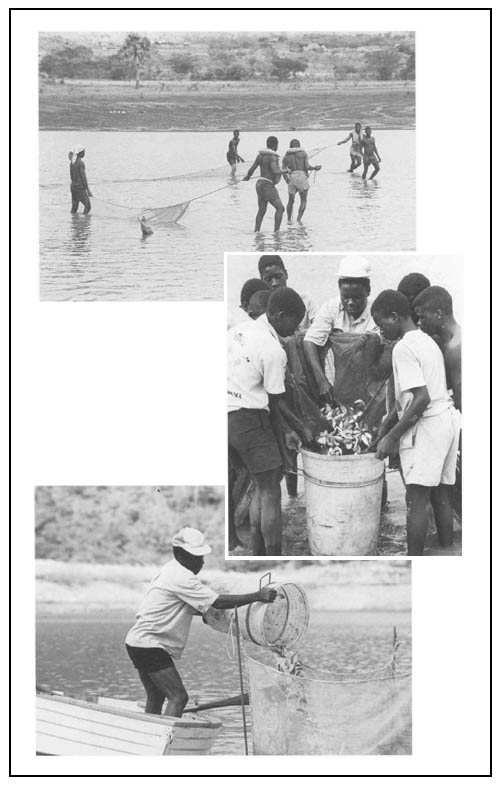
Figure 8. Fishing operations during the stocking programme
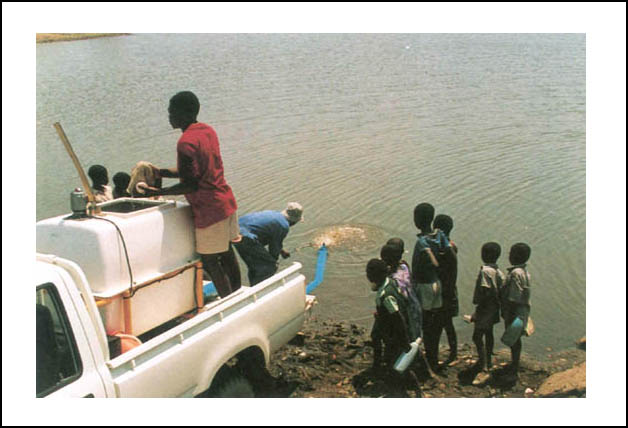
Figure 9. Release of fish into a dam
Details of a typical restocking trip by one team are given in Table 12. This team restocked 41 reservoirs in Mwenezi District, with a total surface area of 187.5 ha. The average stocking rate was 3.7 kg/ha, but varied from 0.7 to 10 kg/ha, due to the variation in supply of fish. The sizes of the reservoirs stocked varied from 1.5 to 20 ha, with a mean of 4.6 ha (median: 2.5 ha). In total, the team used 91.5 workdays of casual labour to catch 481.5 kg of fish suitable for restocking.
Table 12. Details of the restocking trip to Mwenezi District
| Province | Masvingo |
| District | Mwenezi |
| Distance from Harare | 500 km |
| Total milage | 4 356 km |
| Length of trip | 21 days |
| Dams stocked | 41 |
| Number of source dams | 4 |
| Total area stocked | 187.5 ha |
| Fish stocked | 481.5 kg |
| Casual workers | 91.5 workdays |
The main expenditures of the restocking trips comprise the running costs for the vehicle, salaries and the daily subsistence allowances (DSA). The team members were paid an allowance of $Z 25/day, which covered their expenses for food, drinks, etc. The casual workers were paid a wage of $Z 6.50/day.
The operational expenses for the restocking trip to Mwenezi District described in Table 12, are given in Table 13. These expenses are fairly standard for a three-week trip, and do not include expenses for the preparatory work nor for the follow-up visits.
Table 13. Operating expenses for restocking trip to Mwenezi District
| Description | $Z | |
|---|---|---|
| Salary for driver | 1 680.00 | |
| DSA: | driver | 525.00 |
| team leader | 525.00 | |
| fisheries assistant | 525.00 | |
| Salary for casual labourers | 594.75 | |
| Fuel: | diesel (for vehicle) | 771.15 |
| petrol (for waterpump) | 56.60 | |
| Repairs to trailer | 233.00 | |
| Maintenance of vehicle | 559.83 | |
| Supplies | 32.00 | |
| TOTAL | 5 542.33 | |
(Exchange rate (June 1993): 1 $US = 6.30 $Z)
The total operational expenses of the programme during its first 6 months of operation are given in Table 14. These costs do not cover the salaries for the specialist at the Fisheries Unit or the other Agritex staff who worked part time on the programme.
Table 14. Total monthly operating costs for the restocking programme (in $Z)
| Jan. | Feb. | March | April | May | June | TOTAL | |
| Exchange rate: 1 $US = | 5.38 | 5.86 | 6.70 | 6.50 | 6.50 | 6.30 | |
| Fuel | 192 | 300 | 1 995 | 3 718 | 4 648 | 2 926 | 13 779 |
| DSA | 800 | 4 816 | 5 225 | 5 425 | 4 825 | 21 091 | |
| Salaries | 720 | 1 440 | 1 620 | 1 750 | 3 085 | 3 675 | 12 290 |
| Casual labour | 400 | 1 450 | 1 301 | 1 914 | 1 648 | 6 713 | |
| Repairs and maintenance | 25 | 64 | 1 664 | 3 135 | 1 960 | 6 848 | |
| Supplies | 867 | 5 146 | 2 011 | 1 648 | 9 672 | ||
| TOTAL | 70 393 | ||||||
The increase in costs for salaries in May and June was the result of hiring a driver, to replace the Agritex driver. Agritex and DNPWM both allocated one driver to the programme, at no cost to the programme. After May, however, there was a need for a Ndebele speaking driver for stocking dams in Matabeleland South. This driver was employed and paid for by the restocking programme.
A total of 383 reservoirs were stocked during the first 6 months of the programme, and their distribution is shown in Figure 10.
Figure 10. Locations of the 383 dams stocked in the first 6 months of the programme
The number of dams stocked per month is given in Table 15, and Table 16 gives the distribution by Province.
O. mossambicus was the most common stocked species, and was stocked in 361 dams; T. rendalli in 193; O. macrochir in 65; and T. sparrmanii in 12 dams.
| Table 15. Number of dams stocked per month | Table 16. Number of dams stocked per Province after 6 months of operation | ||||||||||||||||||||||||||||||||||||
|
|
The restocking programme in Zimbabwe was characterized by a large number of dams to be restocked, and during the planning of the operations the location of the sources of fish were not known, nor the condition under which the fish had to be caught, stored and transported. It was speculated that keeping the transport time as short as possible, reducing the handling of the fish, and above all keeping the operation as simple as possible, would give the best chances for success. Catching fish with seine nets, storing them for a short period, transporting them to nearby dams and releasing them immediately into the dam was the most simple way to restock dams.
The assumptions made during the preparation of the programme proved to be correct, and the equipment and the method of work functioned well. The average distance from the source dam to the dam stocked was 62 km (median: 42 km), with an average transport time of 92 minutes (median: 74 minutes). The distribution of the transport distance is given in Figure 11.
Figure 11. Frequency distribution of distances between source dam and stocked dams
Normally, several dams were stocked in the same trip and the distance and time were measured via the other stocked dams. Since the mortality was very limited, no relationship between time or distance of transport and mortality could be detected.
The amounts of fish caught and transported each day were around 30 kg, and thus there was no need to use the transport equipment to full capacity. In almost all cases, the fish transport tank fitted in the back of the pick-up was used. The fish transport tank proved to be much more popular with the restocking teams than the trailer. Aeration with the agitator alone was sufficient in all cases.
The temperature of the transport tanks did not increase much during the journey. The temperature of the fish transport tank increased from 20° to 23°C during a journey of 5 hours when the outside temperature was 29°C and the agitator was operating constantly. The agitators maintained the oxygen level in the tanks above 4 ppm while transporting up to 35 kg of fish in the 500 1 tank, for a duration of 5 hours. Longer journeys did not occur during the exercise and were therefore not tested, neither were high fish densities for extended transport times.
The fish were not treated against infections, were not tranquillized and were not slowly acclimatised to the water of the dam where they were released. Although this method may not always be the most recommended, it proved successful during this restocking programme. There are reasons why, under the conditions in Zimbabwe, this approach was successful. The fish species used for the restocking are very robust and endure handling very well. It was also assumed that the water quality of the dams in one area would not differ much, and fish could be released immediately into the dams. From a large number of dams the temperature, conductivity and the Ph was measured. A frequency tabulation of these parameters is given in Figure 12.
Figure 12. Frequency distribution of temperature, conductivity and pH of dams measured during the restocking programme
A conductivity meter measures the ability of water to conduct an electric current. Although a conductivity measure does not correspond to a specific salinity value, because fresh water varies in its proportions of major ions, conductivity provides a useful estimate of the salinity of fresh water (Boyd, 1982). Some species of freshwater fishes are sensitive to sudden changes in salinity. Fry can be killed by osmotic imbalance if they are suddenly transferred from water with a salinity level of 1 000 mg/l to water with only 50 mg/l. Adult fish are usually more tolerant to salinity changes. Most tilapias are euryhaline and survive immediate changes in salinity. The values of the conductivity measured during the programme do not vary much. Between the extremes there is a difference of only a factor of 10 (Figure 12-B), and differences between dams in the same District are even smaller (Table 17). Salinity changes should not have caused any mortality during the immediate transfer of fish.
Table 17. Average conductivity in μmhos/cm in dams, and confidence intervals per District
| District | Count | Average | 95% confidence interval for means | |
|---|---|---|---|---|
| Gwanda | 15 | 129 | 98 | 160 |
| Insiza | 46 | 140 | 122 | 158 |
| Mudzi | 17 | 142 | 113 | 172 |
| Mwenezi | 43 | 216 | 198 | 234 |
| Chivi | 35 | 114 | 93 | 135 |
| Beitbridge | 4 | 115 | 54 | 175 |
| Zaka | 9 | 130 | 90 | 170 |
| Nkezi | 37 | 180 | 160 | 200 |
| Zvishavane | 18 | 129 | 100 | 157 |
| Nkayi | 17 | 108 | 78 | 137 |
| Bubi | 12 | 119 | 84 | 154 |
| TOTAL | 253 | 150 | 142 | 157 |
Lethal Ph values for tilapias are reported to be below 4 or above 11. These values are not reached in the dams measured. The Ph varied little, especially between dams within one district (Table 18).
Table 18. Average pH in dams and confidence intervals for pH per District
| District | Count | Average | 95% confidence interval for means | |
|---|---|---|---|---|
| Gwanda | 15 | 6.30 | 6.05 | 6.55 |
| Insiza | 46 | 6.07 | 5.93 | 6.21 |
| Mudzi | 4 | 7.20 | 6.72 | 7.68 |
| Mwenezi | 46 | 8.36 | 8.22 | 8.51 |
| Chivi | 35 | 6.37 | 6.20 | 6.53 |
| Beitbridge | 7 | 6.00 | 5.63 | 6.36 |
| Zaka | 5 | 6.00 | 5.57 | 6.42 |
| Nkezi | 36 | 6.05 | 5.89 | 6.21 |
| Zvishavane | 18 | 6.44 | 6.21 | 6.67 |
| Nkayi | 17 | 6.00 | 5.76 | 6.23 |
| Bubi | 11 | 6.00 | 5.71 | 6.28 |
| TOTAL | 240 | 6.60 | 6.54 | 6.66 |
The majority of the water temperatures values were between 20° and 24°C, but varied from 14° to 34°C. Temperatures are greatly influenced by the seasons and the altitude of the location. Within one district, the dams are located at comparable altitudes, and the water quality measurements were taken within a period of three weeks. The fish never experienced major changes in water temperature during the stocking exercise (Table 19).
Table 19. Average temperature in °C in dams and confidence intervals per District
| District | Count | Average | 95% confidence interval for means | |
|---|---|---|---|---|
| Gwanda | 15 | 24.1 | 22.7 | 25.5 |
| Insiza | 46 | 24.4 | 23.6 | 25.2 |
| Mudzi | 4 | 30.0 | 27.3 | 32.7 |
| Mwenezi | 46 | 22.8 | 22.0 | 23.6 |
| Chivi | 35 | 19.9 | 18.9 | 20.8 |
| Beitbridge | 8 | 20.6 | 18.7 | 22.5 |
| Zaka | 9 | 21.0 | 19.2 | 22.8 |
| Nkezi | 37 | 22.4 | 21.6 | 23.3 |
| Zvishavane | 18 | 23.2 | 21.9 | 24.4 |
| Nkayi | 17 | 23.6 | 22.3 | 24.9 |
| Bubi | 12 | 22.4 | 20.9 | 24.0 |
| TOTAL | 247 | 22.7 | 22.4 | 23.1 |
Most dams were stocked from source dams in the same district. The fluctuations of the water quality parameters within one District are limited, which supported the assumption that the fish could be released immediately into the dams, without acclimatization.
During the month of June, the beginning of the cold season, the programme concentrated on the districts Zaka, Beitbridge, Chivi and Mwenezi. These districts are situated in areas with lower altitudes and temperatures were expected to remain above 18°C. From data in Table 19 this proved to be correct.
It should, however, be noted that the measurements were not carried out scientifically. The team leaders of the restocking teams used Ph papers (accuracy 0.5), normal thermometers (accuracy 1°C) and a conductivity meter (accuracy 1 unit) at each dam visited. The times of the days when the measurements were carried out differed as well as the location at the dam site. Sometimes the measurements were carried out in deeper water, and other times in shallow areas.
The programme has been very successful in transferring fish to reservoirs. Since the programme has been fully operational with three teams, from March 1993 onwards, up to 100 dams were stocked per month. This number is much higher than earlier expected. The project proposal estimated 200 dams to be restocked after the first 6 months of operation.
Although in total 1 355 dams were reported as having dried up, the programme did not intend to restock all of them. A number of dams did not dry up completely, others were extremely small (<0.5 ha), and several were situated on commercial farms. The programme planned to stock between 600 and 700 dams in total.
The average area of the stocked dams — 4 ha — was smaller than the anticipated 10 ha. It brought the total area stocked to 1 532 ha. It has to be mentioned that the reported surface area is an estimation, and is not very accurate. The team leaders estimated the water surface areas with the aid of range finders when stocking the dams. Verification of a number of dams showed that most areas were seriously underestimated. Besides this underestimation, it is also expected that the water surface areas will increase during the following rainy season. The dried-up dams filled up during the rainy season of 1992/93, but rarely to full supply capacity. With good rains in 1993/94, a significant increase in area should be expected.
Although the programme has been successful in transferring fish to reservoirs, this was not the ultimate objective of the programme. The programme had as its objective to re-establish fish population in the reservoirs for exploitation by local communities. Therefore it can only be considered effective when the restocked species become established and would not have been present without the restocking. To determine this effectiveness of the restocking programme, 73 reservoirs were monitored between January and June 1994. The reservoirs were sampled with seine nets, and the total weight and number of all species caught were recorded.
It can be expected that fish species re-enter reservoirs by natural means. Thus C. gariepinus, L. cylindricus and Barbus spp. are commonly found in the rivers and reservoirs, and they migrate and easily enter reservoirs. The species that were used for restocking are much less likely to re-enter reservoirs naturally. The reservoirs can therefore be categorized based on the presence or absence of the stocked species, namely O. mossambicus, O. macrochir or T. rendalli), of the migrating species (C. gariepinus, L. cylindricus and Barbus spp.), and of the non-migrating and not-stocked species (O. mossambicus, O. macrochir or T. rendalli). Five categories were identified, and are given in Table 20.
Table 20. Categories of reservoirs based on fish species found
| Category | Description of category, based on fish species found | No. of dams | % of dams |
|---|---|---|---|
| 1 | Only the stocked species | 30 | 41 |
| 2 | Stocked species + migrating species | 22 | 30 |
| 3 | Stocked + migrating | ||
| 4 | + non-migrating unstocked species | 2 | 3 |
| 5 | None of the stocked species found | 4 | 5 |
| No fish found | 15 | 19 | |
| TOTAL | 73 | 100 | |
It can be safely assumed that the dams in category 1 lost their fish stocks and would not have had any fish without the restocking programme. The restocking programme was not effective for the reservoirs in categories 4 and 5, where none of the restocked species were present. It was confirmed that these reservoirs all dried up again after the restocking and as a consequence lost their stocks twice. The migrating species managed to re-enter the reservoirs in category 4 but not those in category 5. In the two dams of category 3, O. macrochir was found though this species had not been stocked in these dams. Previous stock monitoring in these dams also identified O. macrochir as one of the species, and clearly these dams did not dry out completely and did not need restocking. Determining the effectiveness of the restocking for the dams in category 2 is more difficult. The migrating species may have re-entered the dams, but their presence may also indicate that the dams never dried up. Other indicators than just the presence of fish species have to be used to determine this.
In those cases where the dams did not dry out, it can be expected that more fish are present than in those where the introduced fish were the only source. However, the number of fish caught during the monitoring in the reservoirs of Category 2 corresponds well with the 95% confidence interval of the numbers caught in Category 1. Since the fish that were stocked are a good reflection of what is normally found in the reservoirs in terms of size distribution and composition of the tilapia species, no other indicators of the fish population can be used to determine whether the dams really did dry out before restocking took place. Table 21 gives some other characteristics of the reservoirs in each category.
Table 21. Characteristics of reservoirs by category.
| Category | Number | Size (ha) | Total weight stocked (kg) | Stocking rate (kg/ha) | Water level (m) |
|---|---|---|---|---|---|
| 1 | 30 | 2.6 | 11.1 | 5.7 | 1.0 |
| 2 | 22 | 9.3 | 12.6 | 5.7 | 0.5 |
| 3 | 2 | 20.3 | 12.5 | 4.4 | 0.8 |
| 4 | 4 | 0.9 | 4.4 | 6.2 | 0.5 |
| 5 | 15 | 1.3 | 4.6 | 4.7 | 1.3 |
The water level mentioned in Table 21 is the water level below the full supply level (FSL) at the time of the monitoring. A level of zero means that the dam spills. This water level is on average 0.54 m (below FSL) for the reservoirs where the migrating species were found and 1.06 m (below FSL) for the dams without these species. This difference was significant (p<0.001), and the figures indicate that migrating species enter the dams from downstream, passing the spillways. The monitoring of the reservoirs took place between January and June and many dams were monitored after the height of the rainy season. The water levels during the rainy season were therefore probably higher than these average figures.
Category 2 consists of dams that either spilled and received migrating fish species from downstream and or of dams that were never dry. Some of the latter can be identified as dams that had low water levels during the monitoring, and therefore did not spill, while fish other than the stocked species were present. The 95% confidence interval for the water levels of the reservoirs in Category 1 and 5 was 0.80–1.32 m. For dams with water levels lower than 1 m below FSL, it was therefore assumed that they had not spilled and fish had not re-entered. Five of these dams were found among the reservoirs in Category 2. The total weight caught in these dams during the monitoring was significantly greater than caught in the other dams of Category 2, which also indicates that the dams did not dry up. Category 2 thus consists of dams that did not dry out and did spill during the rainy season, but with the available information it is impossible to identify these dams.
Table 22 gives the effectiveness of the restocking programme in number and percentage of the reservoirs. Concluding it can be said that the programme was effective for about 64% of the reservoirs restocked.
Table 22. Effectiveness of the restocking programme
| Effectiveness of restocking | Number of dams | % of dams |
|---|---|---|
| All dams effectively restocked | 30 | 41 |
| Most dams effectively restocked | 17 | 23 |
| Dams did not dry, stocking not necessary | 7 | 10 |
| Dams dried up after restocking | 19 | 26 |
| TOTAL | 73 | |
The effectiveness was greatly influenced by the reservoirs that dried up after the restocking. Most of these reservoirs were small. Figure 13 gives a frequency tabulation of the size of the dams that did and the dams that did not dry up after restocking. Although the dams that did dry up were on average smaller, 1.23 ha compared to 5.98 ha, the difference was not significant and was greatly influenced by a few large reservoirs. It can be argued that a restocking programme should not consider small reservoirs for restocking, but this would also exclude a fair number of reservoirs that do not dry every year. When a restocking team is operating in an area it does not take much to stock a few small reservoirs extra. Although some of these may dry up, it may be worth the little extra effort for those that do not dry up again.
Figure 13. Frequency tabulation of the size of dams that did and those that did not dry up after restocking
It was assumed that in cases where reservoirs had dried up, the fish had originated from the restocking or from re-entering the reservoirs after they had filled up. However, some species are adapted to live and survive in temporary waters, either by being able to air-breathe and aestivate in the mud during the dry period, like the lungfish (Protopterus spp.), or by laying drought-resistant eggs which hatch once the habitat is filled with water again, like the killifish (Nothobranchius spp.) (Skelton, 1993). C. gariepinus is also known to survive for extended periods in “dry” environments (Donnelly, 1973; Evans, 1982). All these species are not the most desired species for fish production in reservoirs in Zimbabwe, and therefore the cichlids were stocked. There are however reports of O. mossambicus surviving in dry rivers as well. Donnelly (1978) gives reports of observations of different species surviving in the sand of dry rivers. The observations are all anecdotal, but from these observations it appears that O. mossambicus also manages to survive under specific conditions, where the beds of sandy rivers are saturated with water. The fish appear to move upwards through the sand when the river starts flowing and the water table reaches the surface. Although the reports appear genuine, they are not scientifically supported. For the planning of future restocking programmes it is however important to verify these reports and determine under what conditions and in what numbers the different species manage to survive.
The level at which the 73 monitored reservoirs were stocked varied between 0.3 and 36 kg/ha, and it seems that these quantities are sufficient to re-establish a population. However, the rate of re-establishment may depend on the amount of fish stocked.
The amount of the stocked species caught during the monitoring can be used as an indicator of abundance of these species in the reservoir. The abundance may depend on the amount stocked and, since the fish grow and reproduce, on the length of the period between the stocking and the monitoring (i.e., the pre-monitoring period). The catch depends on the size of the areas fished with the seine nets, the time of the day, the water temperature, the water level and the size of the reservoir. The fish were caught using beach seines, and the tilapia species normally move to the shallow areas when the temperature of the water rises. Therefore it can be expected that the temperature and time of the day have an effect on catchability, and thus on the total catch. Other factors, such as fishing pressure and productivity, also influence the abundance of fish, and other physical characteristics of the reservoirs, such as the presence of rocks or weeds, the state of the shores, etc., determine the size of the catch. These variables were not determined and are therefore not tested, but account for much of the variation in the data. Relationships between the measured parameters and the catch of the stocked species were analyzed for the 47 reservoirs that most likely benefitted directly from the restocking. Of these 47, 29 were monitored twice, which made the total number of observations 76. The averages of these variables and their ranges are given in Table 23.
Table 23. Variables tested for influence on catch after restocking
| Variable | Sample size | Average | Median | Min. | Max. |
|---|---|---|---|---|---|
| Dependent variable | |||||
| Catch of stocked species (kg) | 76 | 14.6 | 7.4 | 0.01 | 68.3 |
| Independent variables | |||||
| Amount stocked (kg) | 74 | 12.5 | 10.0 | 1.0 | 54.5 |
| Stocking rate (kg/ha) | 75 | 5.8 | 4.0 | 0.3 | 36.3 |
| Size of reservoir (ha) | 75 | 4.7 | 2.0 | 0.25 | 111.0 |
| Water temperature (°C) | 60 | 26.3 | 26.5 | 19.0 | 33.8 |
| Time of the day | 74 | 13:00 | 13:15 | 8:45 | 17:00 |
| Water level (m below FSL) | 75 | 1.0 | 0.6 | 0 | 4.0 |
| Pre-monitoring period (days) | 74 | 359 | 357 | 218 | 480 |
| Fished area (m2) | 76 | 1243 | 1000 | 500 | 2000 |
A stepwise regression was used to identify the variables that influenced the weight caught of the stocked species. The best relation predicting the catch of the stocked species was the following:
| C = -40.27 + 0.80*S + 0.10*P + 0.01*F (n=73, R2=0.36, p<0.0001) | |
| Where: | C: Weight of stocked species caught (kg) |
| S: Stocking rate (kg/ha) | |
| P: Pre-monitoring period (days) | |
| F: Fished area (m2) |
A factor that influences the catch and not the abundance has a low predictive power. Even the area fished with the seine nets explained the size of the catch for only 6%.
The best relation predicting the catch as a direct indicator of abundance can be described as follows:
C = -24.03 + 0.89*S + 0.09*P (n=73, R2=0.30, p<0.0001)
This relation is presented in Figure 14. With the available information, it was not possible to establish a relation with a higher prediction.
Figure 14. Relation between catch during monitoring, stocking rate and pre-monitoring period
The water level of the reservoirs was the only variable that influenced the catch of the migrating species. The following relation could be established:
| Cm = 1.56 - 0.56*L (n=74, R2=0.07, p=0.021) | |
| Where: | Cm: Weight of migrating species caught (kg) |
| L: Water level below FSL (m) |
This relation predicts only 7% of the variation, but it confirms the assumption made above, that these species pass the spillway to re-enter the reservoirs.
Stocking rates between 0.3 and 36 kg/ha are sufficient to re-establish a population of mixed tilapia species. According to the relation shown in Figure 14, one year after stocking, a seine net catch covering around 1 000 m2 would yield 9.1 and 40.9 kg respectively in dams stocked at these rates. If it is necessary to re-establish a fish population quickly, high stocking rates are necessary. If re-population is not envisaged within a period of a year, the stocking rate becomes less important, and 1 kg/ha (during this exercise: 50–60 fish/ha) can be considered sufficient.
The relation between catch, stocking rate and pre-monitoring period predicts only 30% of the variation. The rest of the variation is caused by other factors, of which some were mentioned above. The influence of these factors may be of a completely different magnitude in other countries or areas. The relations established here can therefore not be used directly elsewhere.
The speed of the whole operation was in great part determined by catching enough fish. Fish can be obtained from fish farming or from catching fish from wild populations. Obtaining fish from fish farming has the advantage of more control; the species and the size to stock can be chosen, the amount of fish available can be determined before the transport takes place and the operation can be budgeted because the price of fish is known. When the fish has to be caught in wild populations there are far more uncertainties. The species present in the source dams is not always known, nor is the size, and the success rate of catching the fish determines the speed of the operation. This makes detailed planning and budgeting far more difficult.
The location of the source of fish and the dams to be stocked determines the transport distance. In Zimbabwe, few farmers practise fish farming on a scale that could supply fish for a restocking programme. In addition, their production of fish was very limited in 1993, as a result of the drought. But even if they had produced enough fish, only dams in a very confined area could be restocked from these farms. The long distances from the fish farms to the dams would make stocking from farms impossible for most dams in the country. Not more than 5–6 dams can be restocked in one day, which would require up to 200 kg of fish. The large number of dams, all requiring a relatively small amount of fish makes the use of large capacity transport equipment impractical. This option could only be possible with one large-capacity transporter, transporting all the fish to a central place from where it is distributed by several smaller transport units.
Had fish been bought from fish farmers, it would not have been necessary to purchase the fishing equipment, and that would have reduced the cost for equipment slightly. The teams would probably spend less time in the field, but the extensive transport would have increased the cost for operation considerably. These increases would have to be added to the cost of the fingerlings. The current price for tilapia fingerlings at the commercial farms is $Z 36.00/kg. During the first 6 months of the restocking programme, 4 500 kg of fish was stocked, with total operational expenses of around $Z 70 000 — or $Z 15.55/kg. Thus, besides the fact that for most dams in Zimbabwe it was practically impossible, or very cumbersome, to stock them from commercial farms, it would also have been far more expensive.
An advantage of using farmed fish for restocking is the fact that the species is known. When catching fish it is sometimes difficult to locate good sources of the right species. In Zimbabwe, many of the dams have been stocked previously with O. mossambicus, O. macrochir, and T. rendalli. The restocking programme therefore did not experience problems in locating good sources of these species. The exact species composition was not considered to be very important as long as one or a combination of these species was stocked. Under conditions where the exact composition of the species to be stocked is important and where these species are not readily available, obtaining fish from fish farms could be a better alternative.
The monitoring of the restocked reservoirs was included in the programme at a late stage, but better and more conclusive results could have been obtained at the time of stocking some reservoirs, with the aim of obtaining information on the effect of stocking rates and species composition. An extensive restocking programme as carried out in Zimbabwe provides a unique opportunity to study the effects of restocking reservoirs. Although the programme had as its objective the restoration of the fisheries potential in the dried-up dams, and not a study of the dynamics of fish populations, these studies would have been useful to evaluate the effectiveness of the restocking programme and to recommend improvements for future programmes. It is therefore recommended that restocking programmes include more systematic stocking and monitoring for at least part of the reservoirs.
The fish transport trailer was designed to enable the transport of large quantities. Although it was properly built and easy to operate it did not prove to be very useful during this particular exercise. The amounts of fish caught and transported per day did not require such a large transport capacity. The trailer proved difficult to handle behind a vehicle while driving off-road. Passing over rocks or through ditches was difficult, and the combination trailer-vehicle was much more liable to get stuck than the vehicle alone. Although the trailer was built for rough handling and was protected against damage as much as possible, it caused most of the problems in the field. The fittings of the oxygen pipes often came loose, the diffusers cracked, the braking system broke a few times, etc. All repairs were minor, but had to be carried out. As a consequence, the restocking teams used the transport tank fitted in the back of the pickup for most of the transport.
In retrospect, the restocking teams should have been equipped with fish transporting tanks only. The tanks could have been designed slightly bigger to allow larger amounts of fish to be transported in the tank, and could have been fitted with two compartments to allow the division of the fish catch. One trailer for the whole programme instead of three could have been used for special long-distance, large-quantity transport.
All the other equipment performed very well. The planning as well as the execution was well prepared, and it can be concluded that the whole programme operated smoothly.
![]()
![]()
![]()