![]()
![]()
![]()
The total land area of the 28 countries included in the present assessment is approximately 2,800 million ha, 21% of the world land surface, and is scattered in three continents, representing a high variety of ecological zones ranging from sub-tropical to temperate cold and boreal. From the geographic point of view the five sub-regions under assessment can be grouped into four main zones:
Mediterranean: ranging from Morocco to Afghanistan and including Northern Africa and Middle East
Southern Africa: including South Africa, Swaziland and Lesotho
Temperate Asia: including China, Mongolia, North and South Korea
Non-tropical South America: including Argentina, Chile and Uruguay
Despite the high variability of ecological types within and between sub-regions, one main characteristic is common to all sub-regions, i.e. the high proportion of desert : the greatest part of Northern Africa and of Middle East is covered with hot desert (93% and 78% respectively). Southern Africa totals 35% of desert. The share of true desert is less in Temperate Asia and South America where instead a considerable part of land is covered with cold steppes which are not true desert but carry mainly herbaceous vegetation and have no or very limited potential for forest growth. (e.g. Patagonia in South America and tundra-and-alpine zones in China). Globally speaking, approximately ⅔ of the land area under assessment has no potential for forest growth.
The area which has potential for forest is mainly in temperate zones (warm and cold), followed by sub-tropical zones (moist and dry), mediterranean zones (moist and dry) and by boreal (only found in Asia).
The distribution of land area by bioclimatic type is presented in the following graph and table.
| Table 2 | |||||||
| Land area distribution in the non-tropical developing countries | |||||||
| (percentage of total land area) | |||||||
| Sub-region | Desert | Cold steppe/desert | Sub-tropical | Temperate | Mediterranean | Boreal | |
| Northern Africa | 93 | 0 | 0 | 0 | 7 | 0 | |
| Southern Africa | 35 | 0 | 59 | 1 | 5 | 0 | |
| Middle East | 7 | 5 | 1 | 9 | 8 | 0 | |
| Temperate Asia | 6 | 41 | 1 | 42 | 0 | 10 | |
| South America | 3 | 55 | 31 | 7 | 4 | 0 | |
| Total | 41 | 25 | 7 | 19 | 4 | 4 | |
Figure 2
Land area by bioclimatic type and sub-region (% of land) of non-tropical
developing countries
| Table 3 | |||||
| The socio-economic setting of the sub-regions during 1980–90 | |||||
| Sub-region | Population 1990 | Population density 1990 | Population growth rate 1980–90 | GNP per capita 1990 | GNP growth rate 1980–90 |
| 1000 inh | inh/sq.km. | (%) | US $ | (%) | |
| Northern Africa | 115 172 | 19.2 | 2.7 | 1146 | 1.6 |
| Southern Africa | 40 629 | 32.0 | 2.6 | 698 | 2.6 |
| Middle East | 140 432 | 23.4 | 3.1 | 3481 | -0.4 |
| Temperate Asia | 1 205 816 | 108.5 | 1.4 | 554 | 4.7 |
| South America | 48 589 | 13.3 | 1.4 | 2275 | 1.1 |
| Total Non Tropical | 1 550 638 | 55.3 | 1.6 | 872 | 3.2 |
The following remarks can be made in relation to forest resources in the non-tropical and tropical developing countries:
The population density for non-tropical developing countries is similar to the one of tropical countries (55.3 against 51.4 inhabitants per sq. km.) but the pressure on the forest is likely to be higher in the non-tropical region where the remaining natural forest cover is only 6.4% of land, against 34.8% in the tropical region;
the annual population growth rate of non-tropical developing countries is lower than the one of tropical countries (1.6% against 2.4%);
the GNP per capita of the two groups are comparable (828 US$ per caput for non tropical against 720 US$ per caput for tropical), while the GNP growth rate is faster in non tropical (3.2% per year) compared to tropical countries (0.9% per year);
As pointed out earlier, a considerable part of land has no potential for forest growth, and it seems appropriate to deduct those areas from the total. Using potential area for comparison as total area, 65% of land is under agriculture (arable land and permanent crops, permanent meadows and pastures) and other land uses (build on areas, roads, etc.), natural forests cover around 19% of land, other wooded land (mainly shrubs) covers 12% and forest plantations 4%, as shown in the following chart.
Figure 3
Present land use of potential forest land
The present situation is the result of a historic context which presents some similarities.
The whole region extending from the Mediterranean Basin to Indus valley has been subject to intense human activity dating back to 3000 BC. Since that time several great civilizations such as Egyptian, Indian, Babylonian, Greek and Roman, all with a regional sway of power, have risen and fallen. All of them made plentiful use of forest lands for human settlement and agriculture, grazing by domestic animals; and use of wood in housing, transport, mining and metallurgy. The process has been going on for several thousands of years in an essentially forest poor region.
Similar events also took place in China. The regions in the northern and northwestern China along the Yellow River, where the Chinese first settled, were once extensively wooded. There were "boundless stretches of “tsao mu” (grass and forest) everywhere. After more than 5,500 years of destructive action the forests of China today are instead quite reduced.
The historical processes differ in South America, where the massive clear-cut of forest for agriculture purposes dates only few centuries and the demand for new land for agriculture and especially pasture is still active, with the agricultural frontier still expanding.
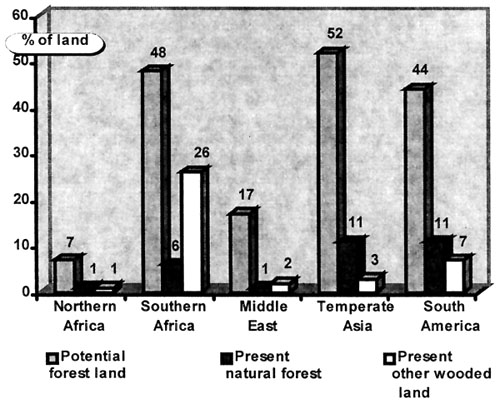
Presently, South America and Temperate Asia still have more than 20% of potentially forested land still covered with natural forests while the share is progressively lower in Northern Africa (13.5%), Southern Africa (8.9%) and Middle East (3.3 %), as shown in the following table.
| Table 4 | ||||
| Present land use of potential forest land by sub-region | ||||
| (percent of potential forest area) | ||||
| Sub-region | Agriculture and other land use | Natural forests | Other wooded land | Forest Plantations |
| Northern Africa | 72.2 | 13.5 | 10.1 | 4.3 |
| Southern Africa | 48.9 | 8.9 | 40.4 | 1.8 |
| Middle East | 82.3 | 3.3 | 14.0 | 0.5 |
| Temp. Asia | 67.1 | 21.2 | 5.8 | 5.9 |
| South America | 55.0 | 27.0 | 16.4 | 1.6 |
| Total | 65.4 | 18.8 | 11.6 | 4.2 |
4.1 Natural forests
The estimated natural forest area at end 1990 is 180 million ha (6.4% of land area). In addition, there are 111 million ha (4% of land) of other woody vegetation (mainly shrubs).
The more forested sub-regions are South America (11.4% of land) and Temperate Asia (11.0%). In North Africa and Middle East, the present natural forest cover is less than 1 %.
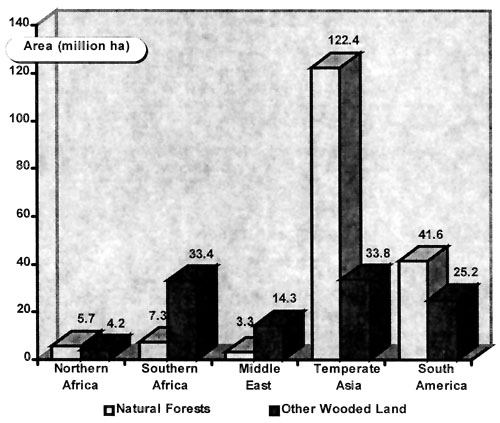
In absolute term the bulk of natural forests are located in Asia followed by South America, as shown in the following table and graph:
| Table 5 | ||||||
| Areas of natural woody vegetation by sub-region | ||||||
| (areas in thousands ha) | ||||||
| Sub-region | Land area | Natural forest area | Other wooded land | Total woody vegetation | ||
| '000 ha | % of land | ha/person | ||||
| Northern Africa | 600 294 | 5 655 | 0.9 | 0.049 | 4 232 | 9 887 |
| Southern Africa | 126 859 | 7 317 | 5.8 | 0.180 | 33 351 | 40 668 |
| Middle East | 601 204 | 3 339 | 0.6 | 0.024 | 14 263 | 17 602 |
| Temperate Asia | 1 111 247 | 122 365 | 11.0 | 0.101 | 33 765 | 156 127 |
| South America | 366 030 | 41 564 | 11.4 | 0.855 | 25 170 | 60 734 |
| Total Non Tropical | 2 805 634 | 180 240 | 6.4 | 0.116 | 110 781 | 291 018 |
Figure 4
Area of natural woody vegetation by sub-region
4.2 Forest plantations
The area of reported plantations at end 1990 is 42.1 millions ha representing 1.5 percent of the land area. The annual increase of forest plantations during 1981–90 is estimated at 1.46 million ha. The breakdown by sub-region is as follows:
| Table 6 | ||||
| Reported forest plantation areas by sub-region | ||||
| (area in 1000 ha) | ||||
| Sub-region | Land area | Forest plantations | Annual planting rate 1981–90 | |
| area 1990 | % of land area | |||
| Northern Africa | 600 294 | 1 786 | 0.3 | 72.4 |
| Southern Africa | 126 859 | 1 492 | 1.2 | 23.0 |
| Middle East | 601 204 | 470 | 0.1 | 31.6 |
| Temperate Asia | 1 111 247 | 35 931 | 3.2 | 1 249.8 |
| South America | 366 030 | 2 455 | 0.7 | 87.2 |
| Total Non Tropical | 2 805 634 | 42 134 | 1.5 | 1 464.0 |
The country with the largest plantation area of those covered in the present report is China, estimated at 31.8 million hectares in 1990, representing almost 80 percent of the total planted area in the non-tropical developing countries. More than 200 tree species are used in plantation forestry in China, of which 40 tree species are used on a relatively large scale. Approximately 60 percent of the plantations are for industrial use. Conifers constitute about 68 percent of the total plantations, of which Cunninghamia lanceolata (24%), Pinus massoniana (18%), Larix spp. (8%), and Pinus tabulaeformis (6.5%) are the main species. Among the broadleaved Populus spp. occupy about 43% of the industrial plantations.
Large scale plantations also exist in the Democratic People's Republic of Korea (2.1 millions of hectares). Other countries with forest plantation area exceeding one million ha are Chile with 1.45 million of hectares, Africa with 1.38 million of hectares of pines and eucalypts.
5.1 Natural forests
As described earlier, the estimates of forest area changes have been made at sub-national level. Results are then aggregated at national level for reporting purposes (see Annex 1). The national estimates are further aggregated at sub-regional, and for the whole non tropical developing world as presented in the following table.
| Table 7 | |||||
| Changes in area of natural forests | |||||
| (area in 1000 ha) | |||||
| Sub-region | Natural forest area | Natural forest annual change during 1981–90 | |||
| 1980 | 1990 | area | rate (%) | ||
| Northern Africa | 6 363 | 5 655 | -70.8 | -1.2 | |
| Southern Africa | 7 946 | 7 317 | -62.9 | -0.8 | |
| Middle East | 3 775 | 3 339 | -43.6 | -1.2 | |
| Temperate Asia | 126 375 | 122 365 | -401.0 | -0.3 | |
| South America | 44 309 | 41 564 | -274.5 | -0.6 | |
| Total Non Tropical | 188 768 | 180 240 | -852.8 | -0.5 | |
The estimated rate of annual loss of natural forest cover is 0.5 percent (0.85 million ha) which is lower than the deforestation rate estimated for tropical countries (0.8 percent, 15.4 million ha). The highest deforestation rates are found in Northern Africa and Middle East (1.2 percent).
5.2 Plantations
Forest plantation areas for 1980 and 1990 have been obtained from existing national data, interpolated or extrapolated, depending on the original reference years, to the standard reference dates (1980 and 1990)
| Table 8 | |||||
| Changes in reported forest plantation areas1 | |||||
| (area in 1000 ha) | |||||
| Sub-region | Forest plantation area | Average Annual plantation | |||
| 1980 | 1990 | area | rate of change (%) | ||
| Northern Africa | 1 062 | 1 786 | 72.4 | 5.3 | |
| Southern Africa | 1 262 | 1 492 | 23.0 | 1.7 | |
| Middle East | 154 | 470 | 31.6 | 11.8 | |
| Temperate Asia | 21 433 | 33 931 | 1 249.8 | 4.7 | |
| South America | 1 583 | 2 455 | 87.2 | 4.5 | |
| Total Non Tropical | 25 494 | 40 134 | 1 464.0 | 4.6 | |
1 the comparison refers to reported forest plantations as at end of 1980 and 1990
The reported annual rate of planting during 1981–90 is 1.46 million ha per year, of which 1.25 million in Temperate Asia, mainly in China where massive tree planting programmes are ongoing.
The comparison between estimated annual deforestation and annual plantation during 1981–90 is as follows:
| Table 9 | |||
| Annual deforestation and plantation areas | |||
| (area in 1000 ha) | |||
| Sub-region | Average annual deforested area (1) | Average annual planted area (2) | Balance (2) - (1) |
| Northern Africa | 70.8 | 72.4 | + 1.6 |
| Southern Africa | 62.9 | 23.0 | - 39.9 |
| Middle East | 43.6 | 31.6 | - 12.0 |
| Temperate Asia | 401.0 | 1 249.8 | + 848.8 |
| South America | 274.5 | 87.2 | - 187.3 |
| Total Non-Tropical | 852.8 | 1 464.0 | + 611.2 |
Figure 5
Annual deforestation and plantation rates
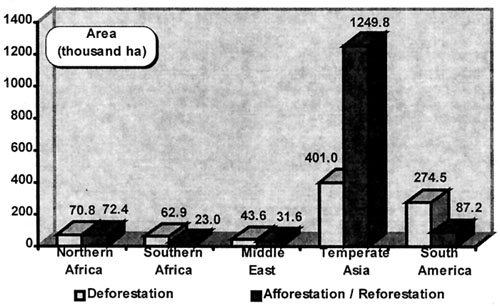
The overall comparison of annual deforestation and annual plantation rates gives a net increase of total wooded area of 0.61 million ha per year during 1981–90. However there are some important differences between the sub-regions in this respect. The positive balance is mainly due to China and Korea where the planted area largely exceeds the loss of natural forests. Among the other sub-regions only Northern Africa shows a small positive balance between deforestation and plantation, while all other sub-regions have more or less negative balances. However, it should be noted that the estimated deforestation as defined for the present assessment only accounts for the transfer from natural forests (closed and open) to other land uses (mainly agriculture or shrub formations) and excludes forest degradation figures (e.g. transition from closed to open forest).
A good indicator of forest degradation is the ratio of actual forest cover to potential forest cover, as shown in the following table.
| Table 10 | |||||
| Comparison of actual forest and potential forest area | |||||
| (area in million ha) | |||||
| Sub-region | Total land area | Potential forest land area | Potential vs. total land area (%) | Natural forest area 1990 | Ratio of actual vs. potential forest area (%) |
| Northern Africa | 600.3 | 40.7 | 6.8 | 5.7 | 13.9 |
| Southern Africa | 126.9 | 60.5 | 47.7 | 7.3 | 12.1 |
| Middle East | 601.2 | 103.0 | 17.1 | 3.3 | 3.2 |
| Temperate Asia | 1 111.2 | 577.4 | 52.0 | 121.6 | 21.1 |
| South America | 366.0 | 160.0 | 43.7 | 41.6 | 26.0 |
| Total Non Tropical | 2 805.6 | 941.5 | 33.6 | 179.5 | 19.1 |
The original forest area has been progressively degraded and converted into agriculture and pastures. In some cases the transition is direct while in many others (e.g. in dry mediterranean zone) the forests follow a degradation pattern from closed to open forests and then into shrub areas. The potential forest land is compared with the present natural woody vegetation in the following graph.
Figure 6
Potential vs. actual natural woody vegetation
Due to repeated cuttings, grazing, fires and trampling of ground by animals, the ground flora and micro-climate near the surface of the soil and consequently the hydrological and nutrient cycle of the forest ecosystem are in most cases significantly altered.
The human and livestock pressure on forest land is extremely high resulting in transformation of forest land into shrub or barren land, and in the gradual reduction of growing stock per unit area.
| Table 11 | ||
| Human and cattle pressure on forest land | ||
| Sub-region | Human population | Livestock population1 |
| per ha of natural forest area | ||
| Northern Africa | 20.4 | 4.8 |
| Southern Africa | 5.2 | 3.1 |
| Middle East | 42.4 | 12.7 |
| Temperate Asia | 9.5 | 1.4 |
| South America | 1.1 | 1.8 |
| Total non-tropical | 8.3 | 1.9 |
1 The livestock population is expressed in terms of cattle equivalent
In future, the gap between the potential and actual growing stock and increment are both expected to widen because of the rising demographic trends. No quantative estimates, however, can be made due to lack of precise data on forest growing stock, increment and drain.
![]()
![]()
![]()