![]()
![]()
Note:
NA indicates data not available
All percentage rates of change are compound rates
| Table 1 | ||||||||
| Socio-economic data | ||||||||
| Country | Population | Gross National Product1 | ||||||
| Land area (000 ha) | Total 1990 (000 inh.) | Density 1990 (inh./km2) | Growth rate (%) | Per capita 1990 (US$/capita) | Annual Growth 1981–90 (%) | |||
| Algeria | 238 174 | 24 960 | 10.5 | 2.9 | 2 350 | 1.9 | ||
| Egypt | 99 545 | 52 426 | 52.7 | 2.5 | 610 | 2.0 | ||
| Libya | 175 954 | 4 545 | 2.6 | 4.1 | NA | NA | ||
| Morocco | 71 085 | 25 061 | 35.3 | 2.6 | 970 | 0.4 | ||
| Tunisia | 15 536 | 8 180 | 52.7 | 2.5 | 1 440 | 1.2 | ||
| Northern Africa | 600 294 | 115 172 | 19.2 | 2.7 | 1 146 | 1.6 | ||
| Lesotho | 3 035 | 1 774 | 58.5 | 2.9 | 550 | 2.7 | ||
| South Africa | 122 104 | 38 067 | 31.2 | 2.5 | 2 530 | * | NA | |
| Swaziland | 1 720 | 788 | 45.8 | 3.4 | 1 030 | 2.2 | ||
| Southern Africa | 126 859 | 40 629 | 32.0 | 2.6 | 698 | 2.6 | ||
| NON TROP. AFRICA | 727 153 | 155 801 | 21.4 | 2.7 | 1 135 | 1.6 | ||
| Afghanistan | 65 209 | 16 557 | 25.4 | 0.3 | NA | NA | ||
| Bahrain | 68 | 516 | 758.8 | 4.0 | 6 830 | * | NA | |
| Iran | 163 600 | 54 607 | 33.4 | 3.4 | 2 500 | 2.5 | ||
| Iraq | 43 737 | 18 920 | 43.3 | 3.6 | NA | NA | ||
| Jordan | 8 893 | 3 282 | 36.9 | 4.2 | 1 290 | * | NA | |
| Kuwait | 1 782 | 2 039 | 114.4 | 4.0 | NA | NA | ||
| Lebanon | 1 023 | 2 701 | 264.0 | 0.1 | NA | NA | ||
| Oman | 21 246 | 1 502 | 7.1 | 4.3 | 5 680 | 4.5 | ||
| Qatar | 1 100 | 368 | 33.5 | 4.9 | 15 876 | * | NA | |
| Saudi Arabia | 214 969 | 14 134 | 6.6 | 4.2 | 7 070 | -3.8 | ||
| Syria | 18 420 | 12 530 | 68.0 | 3.6 | 1 000 | -3.6 | ||
| Un. Arab Emirates | 8 360 | 1 589 | 19.0 | 4.6 | 19 870 | -1.8 | ||
| Yemen | 52 797 | 11 687 | 22.1 | 3.6 | 540 | * | NA | |
| Middle East | 601 204 | 140 432 | 23.4 | 3.1 | 3 481 | -0.4 | ||
| China | 932 641 | 1 139 060 | 122.1 | 1.3 | 370 | 2.1 | ||
| Korea DPR | 12 054 | 21 773 | 180.6 | 1.8 | NA | NA | ||
| Korea Rep. | 9 902 | 42 793 | 432.2 | 1.2 | 5 401 | 12.9 | ||
| Mongolia | 156 650 | 2 190 | 1.4 | 2.8 | NA | NA | ||
| Temperate Asia | 1 111 247 | 1 205 816 | 108.5 | 1.4 | 554 | 4.7 | ||
| NON TROP. ASIA | 1 712 451 | 1 346 248 | 78.6 | 1.5 | 749 | 3.6 | ||
| Argentina | 273 669 | 32 322 | 11.8 | 1.4 | 2 380 | 1.9 | ||
| Chile | 74 880 | 13 173 | 17.6 | 1.7 | 1 940 | -0.3 | ||
| Uruguay | 17 481 | 3 094 | 17.7 | 0.6 | 2 600 | -0.5 | ||
| NON TROP.S.AMERICA | 366 030 | 48 589 | 13.3 | 1.4 | 2 275 | 1.1 | ||
| TOTAL NON TROPICAL | 2 805 634 | 1 550 638 | 55.3 | 1.6 | 872 | 3.2 | ||
| Table 2 | ||||||||
| State of forest inventory | ||||||||
| Country | Number of national forest surveys/inventories | Survey used as baseline | Change assessment | |||||
| Total | Before 1981 | Years 1981–90 (inclusive) | Reference year | Reliability class (*) | Reliability class (**) | |||
| Algeria | 1 | 0 | 1 | 1984 | 2 | 3 | ||
| Egypt | 1 | 1 | 0 | 1980 | 3 | 3 | ||
| Libya | 1 | 1 | 0 | 1980 | 3 | 3 | ||
| Morocco | 1 | 0 | 1 | 1984 | 3 | 3 | ||
| Tunisia | 1 | 0 | 1 | 1990 | 2 | 3 | ||
| Northern Africa | 5 | 2 | 3 | - | - | - | ||
| Lesotho | 1 | 0 | 1 | 1984 | 3 | 3 | ||
| South Africa | 1 | 1 | 0 | 1955 | 3 | 3 | ||
| Swaziland | 1 | 0 | 1 | 1983 | 2 | 3 | ||
| Southern Africa | 3 | 1 | 2 | - | - | - | ||
| NON TROP. AFRICA | 8 | 3 | 5 | - | - | - | ||
| Afghanistan | 2 | 1 | 1 | 1968–90 | 2 | 3 | ||
| Bahrain | 1 | 1 | 0 | 1980 | 3 | 3 | ||
| Iran | 1 | 1 | 0 | 1959–80 | 3 | 3 | ||
| Iraq | 1 | 1 | 0 | 1966 | 3 | 3 | ||
| Jordan | 1 | 0 | 1 | 1990 | 3 | 3 | ||
| Kuwait | 1 | 1 | 0 | 1980 | 3 | 3 | ||
| Lebanon | 2 | 1 | 1 | 1990 | 1 | 1 | ||
| Oman | 1 | 1 | 0 | 1980 | 3 | 3 | ||
| Qatar | 1 | 1 | 0 | 1980 | 3 | 3 | ||
| Saudi Arabia | 1 | 1 | 0 | 1971 | 3 | 3 | ||
| Syria | 1 | 1 | 0 | 1980 | 3 | 3 | ||
| Un.Arab Emirates | 1 | 1 | 0 | 1980 | 3 | 3 | ||
| Yemen | 1 | 0 | 1 | 1987 | 3 | 3 | ||
| Middle East | 15 | 11 | 4 | - | - | - | ||
| China | 3 | 1 | 2 | 1988 | 1 | 2 | ||
| Korea DPR | 1 | 1 | 0 | 1980 | 3 | 3 | ||
| Korea Rep | 4 | 3 | 1 | 1992 | 1 | 1 | ||
| Mongolia | 1 | 1 | 0 | 1972 | 3 | 3 | ||
| Temperate Asia | 9 | 6 | 3 | - | - | - | ||
| NON TROPICAL ASIA | 24 | 17 | 7 | - | - | - | ||
| Argentina | 1 | 0 | 1 | 1987 | 3 | 3 | ||
| Chile | 1 | 1 | 0 | 1980 | 3 | 3 | ||
| Uruguay | 1 | 1 | 0 | 1980 | 3 | 3 | ||
| NON TROPICAL SOUTH AMERICA | 3 | 2 | 1 | - | - | - | ||
| TOTAL NON TROPICAL | 35 | 22 | 13 | - | - | - | ||
(**) Change assessment reliability classes:
| Table 3 | |||||||
| Area of natural forests, plantations and other wooded land — 1990 | |||||||
| Country | Forest area 1990 | Forest per capita ha/inh. | Plantation 1990 | Total Forest | Other Wooded Land | Total Wooded land | |
| 1000ha | % of land | ||||||
| 1000 ha | 1000 ha | 1000 ha | 1000 ha | ||||
| Algeria | 1 554 | 0.7 | 0.062 | 693 | 2 247 | 1 906 | 4 153 |
| Egypt | 0 | 0.0 | 0.000 | 48 | 48 | 0 | 48 |
| Libya | 190 | 0.1 | 0.042 | 300 | 490 | 446 | 936 |
| Morocco | 3 543 | 5.0 | 0.141 | 458 | 4 001 | 1 880 | 5 881 |
| Tunisia | 368 | 2.4 | 0.045 | 287 | 655 | 0 | 655 |
| Northern Africa | 5 655 | 0.9 | 0.049 | 1 786 | 7 441 | 4 232 | 11 673 |
| Lesotho | 0 | 0.0 | 0.000 | 10 | 10 | 16 | 26 |
| South Africa | 7 243 | 5.9 | 0.190 | 1 379 | 8 622 | 33 335 | 41 957 |
| Swaziland | 74 | 4.3 | 0.094 | 103 | 177 | 0 | 177 |
| Southern Africa | 7 317 | 5.8 | 0.180 | 1 492 | 8 809 | 33 351 | 42 160 |
| NON TROP. AFRICA | 12 972 | 1.8 | 0.083 | 3 278 | 16 250 | 37 583 | 53 833 |
| Afghanistan | 1 191 | 1.8 | 0.072 | 11 | 1 202 | 1 415 | 2 617 |
| Bahrain | 0 | 0.0 | 0.000 | 0 | 0 | 0 | 0 |
| Iran | 1 658 | 1.0 | 0.030 | 113 | 1 771 | 9 700 | 11 471 |
| Iraq | 69 | 0.2 | 0.004 | 20 | 89 | 109 | 198 |
| Jordan | 28 | 0.3 | 0.009 | 33 | 61 | 122 | 183 |
| Kuwait | 0 | 0.0 | 0.000 | 7 | 7 | 0 | 7 |
| Lebanon | 65 | 6.4 | 0.024 | 18 | 83 | 66 | 149 |
| Oman | 0 | 0.0 | 0.000 | 0 | 0 | 0 | 0 |
| Qatar | 0 | 0.0 | 0.000 | 0 | 0 | 0 | 0 |
| Saudi Arabia | 201 | 0.1 | 0.014 | 1 | 202 | 700 | 902 |
| Syria | 118 | 0.6 | 0.009 | 182 | 300 | 239 | 539 |
| Un.Arab Emir. | 0 | 0.0 | 0.000 | 85 | 85 | 0 | 85 |
| Yemen | 9 | ε | 0.001 | 0 | 9 | 1 912 | 1 921 |
| Middle East | 3 339 | 0.6 | 0.024 | 470 | 3 809 | 14 263 | 18 072 |
| China | 101 968 | 10.9 | 0.090 | 31 831 | 133 799 | 28 230 | 162 029 |
| Korea DPR | 4 700 | 39.0 | 0.216 | 2 100 | 6 800 | 1200 | 8 000 |
| Korea Rep | 6 291 | 63.5 | 0.147 | 0 | 6 291 | 0 | 6 291 |
| Mongolia | 9 406 | 6.0 | 4.295 | 0 | 9 406 | 4 335 | 13 741 |
| Temperate Asia | 122 365 | 11.0 | 0.101 | 33 931 | 156 296 | 33 765 | 190 061 |
| NON TROPICAL ASIA | 125 704 | 7.3 | 0.093 | 34 401 | 160 105 | 48 028 | 208 133 |
| Argentina | 33 889 | 12.4 | 1.048 | 782 | 34 671 | 16 500 | 51 171 |
| Chile | 7 018 | 9.4 | 0.533 | 1 450 | 8 468 | 8 550 | 17 018 |
| Uruguay | 657 | 3.8 | 0.212 | 223 | 880 | 120 | 1 000 |
| NON TROPICAL SOUTH AMERICA | 41 564 | 11.4 | 0.855 | 2 455 | 44 019 | 25 170 | 69 189 |
| TOTAL NON TROPICAL | 180 240 | 6.4 | 0.116 | 40 134 | 220 374 | 110 781 | 331 155 |
| Table 4 | |||||
| Potential and actual forest area | |||||
| Country | Land Area 1000 ha | Potential forest land 1000 ha | Potential vs. total percent | Forest Area 1990 1000 ha | Actual vs. potential percent |
| Algeria | 238 174 | 17 625 | 7.4 | 1 554 | 8.8 |
| Egypt | 99 545 | 0 | 0.0 | 0 | 0.0 |
| Libya | 175 954 | 2 435 | 1.4 | 190 | 7.8 |
| Morocco | 71 085 | 14 817 | 20.8 | 3 543 | 23.9 |
| Tunisia | 15 536 | 5 779 | 37.2 | 368 | 6.4 |
| Northern Africa | 600 294 | 40 656 | 6.8 | 5 655 | 13.9 |
| Lesotho | 3 035 | 2 484 | 81.8 | 0 | 0.0 |
| South Africa | 122 104 | 56 266 | 46.1 | 7 243 | 12.9 |
| Swaziland | 1 720 | 1 720 | 100.0 | 74 | 4.3 |
| Southern Africa | 126 859 | 60 469 | 47.7 | 7 317 | 12.1 |
| NON TROPICAL AFRICA | 727 153 | 101 125 | 13.9 | 12 972 | 12.8 |
| Afghanistan | 65 209 | 17 346 | 26.6 | 1 191 | 6.9 |
| Bahrain | 68 | 0 | 0.0 | 0 | 0.0 |
| Iran | 163 600 | 66 749 | 40.8 | 1 658 | 2.5 |
| Iraq | 43 737 | 6 910 | 15.8 | 69 | 1.0 |
| Jordan | 8 893 | 258 | 2.9 | 28 | 10.9 |
| Kuwait | 1 782 | 0 | 0.0 | 0 | 0.0 |
| Lebanon | 1 023 | 1 023 | 100.0 | 65 | 6.4 |
| Oman | 21 246 | 167 | 0.8 | 0 | 0.0 |
| Qatar | 1 100 | 0 | 0.0 | 0 | 0.0 |
| Saudi Arabia | 214 969 | 1 150 | 0.5 | 201 | 17.5 |
| Syria | 18 420 | 5 673 | 30.8 | 118 | 2.1 |
| Un. Arab Emirates | 8 360 | 0 | 0.0 | 0 | 0.0 |
| Yemen | 52 797 | 3 727 | 7.1 | 9 | 0.2 |
| Middle East | 601 204 | 103 004 | 17.1 | 3 339 | 3.2 |
| China | 932 641 | 519 873 | 55.7 | 101 252 | 19.5 |
| Korea DPR | 12 054 | 12 054 | 100.0 | 4 700 | 39.0 |
| Korea Rep | 9 902 | 9 902 | 100.0 | 6 291 | 63.5 |
| Mongolia | 156 650 | 35 539 | 22.7 | 9 406 | 26.5 |
| Temperate Asia | 1 111 247 | 577 368 | 52.0 | 121 649 | 21.1 |
| NON TROPICAL ASIA | 1 712 451 | 680 372 | 39.7 | 124 988 | 18.4 |
| Argentina | 273 669 | 95 237 | 34.8 | 33 889 | 35.6 |
| Chile | 74 880 | 47 249 | 63.1 | 7 018 | 14.9 |
| Uruguay | 17 481 | 17 481 | 100.0 | 657 | 3.8 |
| NON TROPICAL SOUTH AMERICA | 366 030 | 159 967 | 43.7 | 41 564 | 26.0 |
| TOTAL NON TROPICAL | 2 805 634 | 941 464 | 33.6 | 179 524 | 19.1 |
| Table 5A | |||||
| Forest area change during 1981–90 — Natural forests | |||||
| Country | Land Area 1000 ha | Forest area 1980 1000 ha | Forest area 1990 1000 ha | Annual Change 1000 ha | Annual rate of Change Percent |
| Algeria | 238 174 | 1 934 | 1 554 | -38.0 | -2.2 |
| Egypt | 99 545 | 0 | 0 | 0.0 | 0.0 |
| Libya | 175 954 | 190 | 190 | 0.0 | 0.0 |
| Morocco | 71 085 | 3 807 | 3 543 | -26.4 | -0.7 |
| Tunisia | 15 536 | 432 | 368 | -6.4 | -1.6 |
| North Africa | 600 294 | 6 363 | 5 655 | -70.8 | -1.2 |
| Lesotho | 3 035 | 0 | 0 | 0.0 | 0.0 |
| South Africa | 122 104 | 7 872 | 7 243 | -62.9 | -0.8 |
| Swaziland | 1 720 | 74 | 74 | 0.0 | 0.0 |
| Southern Africa | 126 859 | 7 946 | 7 317 | -62.9 | -0.8 |
| NON TROPICAL AFRICA | 727 153 | 14 309 | 12 972 | -133.7 | -1.0 |
| Afghanistan | 65 209 | 1 195 | 1 191 | -0.4 | -ε |
| Bahrain | 68 | 0 | 0 | 0.0 | 0.0 |
| Iran | 163 600 | 1 986 | 1 658 | -32.8 | -1.8 |
| Iraq | 43 737 | 69 | 69 | 0.0 | 0.0 |
| Jordan | 8 893 | 35 | 28 | -0.7 | -2.2 |
| Kuwait | 1 782 | 0 | 0 | 0.0 | 0.0 |
| Lebanon | 1 023 | 71 | 65 | -0.6 | -0.9 |
| Oman | 21 246 | 0 | 0 | 0.0 | 0.0 |
| Qatar | 1 100 | 0 | 0 | 0.0 | 0.0 |
| Saudi Arabia | 214 969 | 247 | 201 | -4.6 | -2.0 |
| Syria | 18 420 | 163 | 118 | -4.5 | -3.2 |
| Un. Arab Emirates | 8 360 | 0 | 0 | 0.0 | 0.0 |
| Yemen | 52 797 | 9 | 9 | 0.0 | 0.0 |
| Middle East | 601 204 | 3 775 | 3 339 | -43.6 | -1.2 |
| China | 932 641 | 105 965 | 101 968 | -399.7 | -0.4 |
| Korea DPR | 12 054 | 4 700 | 4 700 | 0.0 | 0.0 |
| Korea Rep | 9 902 | 6 304 | 6 291 | -1.3 | -ε |
| Mongolia | 156 650 | 9 406 | 9 406 | 0.0 | 0.0 |
| Temperate Asia | 1 111 247 | 126 375 | 122 365 | -401.0 | -0.3 |
| NON TROPICAL ASIA | 1 712 451 | 130 150 | 125 704 | -444.6 | -0.3 |
| Argentina | 273 669 | 36 025 | 33 889 | -213.6 | -0.6 |
| Chile | 74 880 | 7 617 | 7 018 | -59.9 | -0.8 |
| Uruguay | 17 481 | 667 | 657 | -1.0 | -0.2 |
| NON TROPICAL SOUTH AMERICA | 366 030 | 44 309 | 41 564 | -274.5 | -0.6 |
| TOTAL NON TROPICAL | 2 805 634 | 188 768 | 180 240 | -852.8 | -0.5 |
| Table 5B | |||||
| Forest area change during 1981–90 — Plantations | |||||
| Country | Plantation 1980 1000 ha | Plantation 1990 1000 ha | Annual Plantation Rate 1000 ha | Annual Rate of change percent | Deforestation minus Reforestation1 1000 ha |
| Algeria | 431 | 693 | 26.2 | 4.9 | -11.8 |
| Egypt | 40 | 48 | 0.8 | 1.8 | 0.8 |
| Libya | 143 | 300 | 15.7 | 7.7 | 15.7 |
| Morocco | 321 | 458 | 13.7 | 3.6 | -12.7 |
| Tunisia | 127 | 287 | 16.0 | 8.5 | 9.6 |
| North Africa | 1 062 | 1 786 | 72.4 | 5.3 | 1.6 |
| Lesotho | 2 | 10 | 0.8 | 17.5 | 0.8 |
| South Africa | 1 158 | 1 379 | 22.1 | 1.8 | -40.8 |
| Swaziland | 102 | 103 | 0.1 | 0.1 | 0.1 |
| Southern Africa | 1 262 | 1 492 | 23.0 | 1.7 | -39.9 |
| NON TROPICAL AFRICA | 2 324 | 3 278 | 95.4 | 3.5 | -38.3 |
| Afghanistan | 11 | 11 | 0.0 | 0.0 | -0.4 |
| Bahrain | 0 | 0 | 0.0 | 0.0 | 0.0 |
| Iran | 43 | 113 | 7.0 | 10.1 | -25.8 |
| Iraq | 20 | 20 | 0.0 | 0.0 | 0.0 |
| Jordan | 21 | 33 | 1.2 | 4.6 | 0.5 |
| Kuwait | 0 | 7 | 0.7 | NA | 0.7 |
| Lebanon | 18 | 18 | 0.0 | 0.0 | -0.6 |
| Oman | 0 | 0 | 0.0 | 0.0 | 0.0 |
| Qatar | 0 | 0 | 0.0 | 0.0 | 0.0 |
| Saudi Arabia | 1 | 1 | 0.0 | 0.0 | -4.6 |
| Syria | 40 | 182 | 14.2 | 16.4 | 9.7 |
| Un. Arab Emirates | 0 | 85 | 8.5 | NA | 8.5 |
| Yemen | 0 | 0 | 0.0 | 0.0 | 0.0 |
| Middle East | 154 | 470 | 31.6 | 11.8 | -12.0 |
| China | 20 433 | 31 831 | 1 139.8 | 4.5 | 740.1 |
| Korea DPR | 1 000 | 2 100 | 110.0 | 7.7 | 110.0 |
| Korea Rep | NA | NA | NA | NA | -1.3 |
| Mongolia | NA | NA | NA | NA | 0.0 |
| Temperate Asia | 21 433 | 33 931 | 1 249.8 | 4.7 | 848.8 |
| NON TROPICAL ASIA | 21 587 | 34 401 | 1281.4 | 4.8 | 836.8 |
| Argentina | 717 | 782 | 6.5 | 0.9 | -207.1 |
| Chile | 671 | 1 450 | 77.9 | 8.0 | 18.0 |
| Uruguay | 195 | 223 | 2.8 | 1.4 | 1.8 |
| NON TROPICAL SOUTH AMERICA | 1 583 | 2 455 | 87.2 | 4.5 | -187.3 |
| TOTAL NON TROPICAL | 25 494 | 40 134 | 1 464.0 | 4.6 | 611.2 |
Reforestation refers to Annual plantation rate; Deforestation refers to Table 5A - Annual Change
1. INTRODUCTION
As pointed out in the main text, the forest inventory data available with the countries have different reference dates ranging from 1955 to 1992 and need to be standardized to a common reference date (i.e. year 1990) for the global assessment purposes. The adjustment requires an estimate of the rate of change of the forest cover during 1980–90.
There are two ways of doing such adjustment:
use of ad hoc expert's estimates based on personal experience and knowledge of the study area; and
use of statistical models correlating forest cover and deforestation with population density and its growth and auxiliary variables.
The second approach is objective, repeatable and avoids subjective estimates, whose quality is necessarily variable and difficult to control and to document. In particular for the area under present assessment, given the scarcity of national or even partial forest inventory, the estimates of changes would require considerable guess work.
The model approach is related with the availability of statistical and spatial databases such as: sub-national units (province, district, etc.) and demographic and ecological variables.
The estimates obtained by modelling are expected to become more precise in future when additional forest surveys data become available together with socio-economic and ecological variables. The process of modelling enables a continuous upgrade of the estimates by successive approximations using improved models. The modelling will benefit from the enlargement of the multi date and single date observations. In general the model approach can be considered a useful methodology for present and especially for future global forest resources assessments.
The models are applied at subnational level and results are successively aggregated at national, regional and global levels. Keeping in view the law of propagation of errors the global estimates are expected to be more precise than the subregional; and the subregional estimates more precise than the national and subnational estimates. Nevertheless some important deviation are expected at district level.
The present results are based on a minimum set of data and should be considered mainly indicative of the current processes of deforestation and degradation. Certainly they constitute a useful starting point, covering the totality of the study area, for further analysis and understanding of dynamics of forest resources.
2. MODEL BUILDING
The techniques used in the present modelling exercise are derived from the experience acquired with the study of tropical countries. The main finding was that forest cover (as percent of land) of a given administrative unit is a function of (i) population density; and (ii) ecological conditions. The above hypotheses have been tested on 5 sub-regional data sets for North Africa, Middle East, South America, South Africa and China.
Each subregional data set includes the following variables : population density and growth; forest cover (as percent of land); potential forest cover (forest as percentage of potential forest area) where potential forest land is obtained by subtracting desert area (hot and cold); ecological zoning (percent of land in each ecological zone within the subnational unit). For some subregions additional variables were also available and have been used (e.g. rural population density, animal density, Weck Climatic Index, etc.).
Each subregion was analyzed separately using a cross-sectional analysis approach, using population density as proxy of time, this assumes that within a given ecological type the less populated district would be more forested, representing early stages of development and that with the growth of population the forest cover would decline progressively.
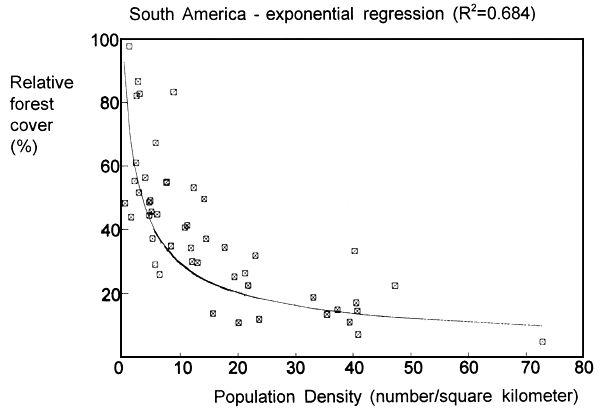
An illustration of data scatter is given in the following graph. above the example only the influence of population is shown. Ecological data are further included in the dataset and a multiple regression analysis performed using forest cover (or relative forest cover) as dependent variable and population, ecological zoning (% of land in each ecological class) and other factors, indicated in each case, as independent variables. The regression analysis was performed using a stepwise approach to determine the best fit.
Population density and relative forest cover example: South America
A worked out example for North Africa is given hereunder to illustrate the methodology used.
Step 1: Correlation of individual variables
| Variable | Correlation | |
| (R) | (R squared) | |
| Montane moist area | 0.765 | 0.585 |
| Rural population density | 0.752 | 0.566 |
| Animal density | 0.542 | 0.294 |
| Population density | 0.500 | 0.250 |
| Weck Climatic Index | 0.421 | 0.177 |
Step 2: Variable selection
Montane moist area is found to be the most significant variable with an R2 of 0.585.
The second variable added is Rural population density and the combined effect leads to an R2 of 0.714 (adjusted to 0.686 for the degrees of freedom).
After the inclusion of rural population the other variables are no longer significant as their F values and partial correlation are low.
Step 3: Model fitting results
The model selected is as follows:
Y = a + bx + cz
Where
Y = relative forest cover
a = constant
b = percentage of area in montane moist zone
c = rural population density
and the values computed for the parameters are:
a = 16.913
b = 0.164
c = -0.138
Model fitting : R-squared (adjusted) : 0.6862 ; d.f. = 20
| Independent variable | Coefficient | Standard Error | Significant level |
|---|---|---|---|
| a = constant | 16.912796 | 3.272101 | 0.0000 |
| b = montane moist area | 0.164327 | 0.050782 | 0.0041 |
| c = rural density | -0.137958 | 0.045777 | 0.0069 |
The selected model expresses the relative forest cover of a given unit as a function of a = constant; b = montane moist area; and c = rural population density. The first two parameters are positive while the parameter for population is negative. Montane moist zones have a positive effect on forest cover probably due to inaccessibility and limited suitability of land for agriculture and grazing; since the residuals forests are located mainly in montane zones, the environmental implication of their possible further reduction should be analyzed. On the other hand the growth of rural population leads to forest degradation and deforestation.
The above model can be used to estimate the forest area change between two dates for which the corresponding rural population density values are known. The procedure is as follows.
If:
Y1 and Y2 are the relative forest cover at time 1 and 2; and
x is the portion of land in the montane moist zone; and
z1 and z2 are the rural population density at time 1 and 2;
Y1 = a + b*x + c*z1
and
Y2 = a + b*x + c*z2
then
(Y1-Y2) = (a+b*x+c*z1) - (a+b*x+c*z2)
since a,b,c and x are constants the change function can be simplified as follows:
(Y1-Y2) = c* (z1-z2)
The dynamic aspects of the model are controlled by population size and growth steered by the estimated parameter. Nevertheless the auxiliary parameters (of ecological nature) are influencing the value of the ‘c’ parameter and are necessary to improve the correlation with forest cover and to control the effect of the population.
The methodology described for North Africa is adopted for the other subregional models also and, thus, the implications discussed before are similar. In practice for each subregional data set, one model has been statistically developed. The selected combination of variables have been analyzed to test the consistency of the results. Special attention was paid to significance of the population parameter which is crucial for change assessment. In all models except one (Mongolia) the population was the statistically most significant variable (probability > 95%). In case that the population parameter is not included in the selected model the forest cover appears to be determined only by ecological factors and the decline due to human activities appears to be not significant.
A summary of the statistical results is presented in the following table.
| Table 12 | |||||
| Subregion/country | Number of observations | Number of independent variables tested | Number of variables selected | Correlation coefficient R2 | F values for population parameter |
| North Africa | 23 | 10 | 2 | 0.69 | 8.9 |
| Middle East | 50 | 10 | 8 | 0.98 | 6.7 |
| South America | 53 | 6 | 3 | 0.71 | 11.8 |
| South Africa | 9 | 4 | 2 | 0.73 | 4.51 |
| China | 23 | 12 | 3 | 0.86 | 28.3 |
5. RELIABILITY ASSESSMENT
The modelling approach, though useful, is not exempt from criticism. The main question is related to the reliability of the estimates. The easiest way to assess the reliability of estimates would be to compare independent multi-date observations for given districts with the corresponding model results. Unfortunately the virtual absence of reliable multi-date observation does not allow such comparison. Moreover, the models are obtained by regression analysis and are intended to represent average trends; local deviations in individual districts can lead to underestimation or overestimation. From a statistical view, the most important requisite is the absence of bias which has been tested with residuals analysis. Even in absence of bias the model estimates are necessarily associated with an error.

![]()
![]()