![]()
![]()
![]()
The first part of the overview covers the tropical countries and presents the reported areas of forestry plantations for the years ending 1980 and 1990. The success of plantations at tropical and regional levels is estimated on the basis of available survey/survival reports. The composition of the reported area and by the main species, the salient features of the community forestry plantations programmes and estimated areas under non-forestry plantations are also described. In the second part, plantation areas of selected non-tropical developing and developed countries are presented and their growth and yield compared with those of the tropical plantations.
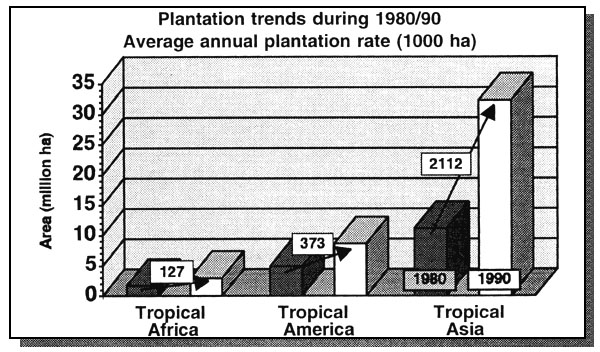
The detailed information by countries, sub-regions and regions has been provided in Chapter 3. Therefore only regional and total tropical figures are given here. A significant fact is the rapid increase in plantations, estimated at about 44 million ha to the end of 1990, against 18 million ha in 1980, that is an increase by 150%, at the rate of 2.61 million ha annually. The area under non-industrial plantations has almost tripled, whereas that under industrial plantation has doubled.
Among the regions, Tropical Asia and Pacific had the largest share (73%) followed by Tropical America (20%) and Africa (7%).
The increase in plantation areas in Asia and Pacific region was 190% at the annual rate of 2.11 million ha, whereas in Tropical America and Africa it was only 75% each, at the rate of 0.37 million and 0.13 million ha respectively. The plantation rate in Asia and Pacific region was relatively high, mainly because of the increasing popularity of community/social forestry.
The share of industrial plantations in the tropics was about 35% with the following distribution; 9% in Africa, 33% in America and 58% in Asia and the Pacific. It is relevant to mention here that the ownership of industrial plantations in Tropical Africa and Tropical Asia and Pacific rested with the state/public sector where as in Tropical America most of the industrial plantations were owned by private companies/individuals. The share of industrial plantation of the total plantation area reduced from 40% in 1980 to 35% in 1990. Such a reduction is more noticeable in Africa, from 56% to 46%, and Asia and Pacific, from 32% to 28%. Percentage reductions in industrial or increases in non-industrial plantations were largely attributed to the increasing popularity of community/agroforestry programmes. Large scale plantations were being established outside forest reserves to meet the growing local demand of fuelwood and small timber.
Regional Plantation Areas by 1980 and 1990
| Tropical region | Number of countries | Total areas by categories in million ha | Average Annual Rate (000 ha) | ||||||
|---|---|---|---|---|---|---|---|---|---|
| 1980 | 1990 | ||||||||
| Industrial | Non-Indust. | Total | Industrial | Non-Indust. | Total | ||||
| Africa | 36 | 0.96 | 0.76 | 1.72 | 1.37 | 1.62 | 2.99 | 127 | |
| America | 33 | 2.55 | 2.36 | 4.91 | 5.10 | 3.54 | 8.64 | 373 | |
| Asia | 19 | 3.57 | 7.60 | 11.17 | 9.16 | 23.14 | 32.30 | 2 112 | |
| Total | 88 | 7.08 | 10.72 | 17.80 | 15.63 | 28.30 | 43.93 | 2 612 | |
The above table includes areas of community forestry but excludes non-forestry plantations. Please note that this in-depth study on forest plantations covers 88 countries, of which 81 are in common with Forest Resources Assessment 1990 - Tropical countries (Forestry Paper 112). Forestry Paper 112 provides a more complete country coverage (90 countries) and for some countries a more recent update. For these reasons the regional and global totals differ slightly between the two reports.
Total plantation areas and current annual planting (1989–90) of the ten countries constituting 90% of tropical plantations are presented in the following table.
Top ten planting countries (tropical)
(000 ha)
| Countries | Total | Annual |
|---|---|---|
| 1. India | 18,900 | 1,700 |
| 2. Indonesia | 8,750 | 100 |
| 3. Brazil | 7,000 | 200 |
| 4. Vietnam | 2,100 | 125 |
| 5. Thailand | 756 | 40 |
| 6. Venezuela | 362 | 30 |
| 7. Cuba | 350 | 30 |
| 8. Bangladesh | 335 | 10 |
| 9. Myanmar | 335 | 40 |
| 10. Madagascar | 310 | 5 |
India attained the above plantation rate after the creation of the National Wasteland Development Board in 1985. Most of the plantations in India were established outside the forest reserve in degraded wastelands owned by the state or on the private lands of farmers. Indonesia and Vietnam launched several plantation projects with the financial support of international banks. The annual plantation rate in Brazil declined after withdrawal of fiscal incentives from 1987.
The practice of community forestry/social forestry is not a new phenomenon especially in tropical Africa and Asia. Growing trees with agricultural crops under ‘taungya’ or ‘shamba’ or ‘tungapasari’ is an old established practice in these two regions, but in the last decade it has increased. Growing woodlots outside the state forest domain (forest land in these two regions mostly belongs to the government, a different situation from that in Tropical America and developed countries) in private farms, community land, etc has become popular. Besides the impetus for plantation establishment arising from the shortage of fuelwood, smallwood and fodder, external financial support by a large number of donor agencies like the World Bank and the regional development banks (AsDB, AfDB, CDB & IDB), SIDA, JICA, USAID, ODA, DANIDA, FINNIDA, etc. has played a key role in stimulating the activity. Unfortunately the monitoring and evaluation of such plantations has often been quite poor. In the absence of actual area information, the reporting of community forestry area at the national level has been either inaccurate or incomplete, and in a few cases was totally neglected. In order to estimate the planted area outside the traditional block plantations, many countries fixed a national criterion to convert seedlings into area (ha), of the seedlings raised in the nurseries, distributed to planters or planted in different spatial patterns. This criterion varied from country to country. For example, in India 2000 seedlings and in Senegal 625 seedlings were treated as equivalent to 1 ha (see Appendix II for more details).
In the absence of reliable inventories it was not possible to give an estimate of the total area planted under community forestry but its proportion of the total plantations in tropical Africa and Asia was relatively large. Plantation areas established under community forestry for most countries were included in the total area described in the beginning of this chapter. A few countries like Bangladesh, Sri Lanka, Kenya, Nigeria, Zambia and Zimbabwe, where the practice of community forestry has been reported in other sources, did not mention the area in their national reports and hence it was not included.
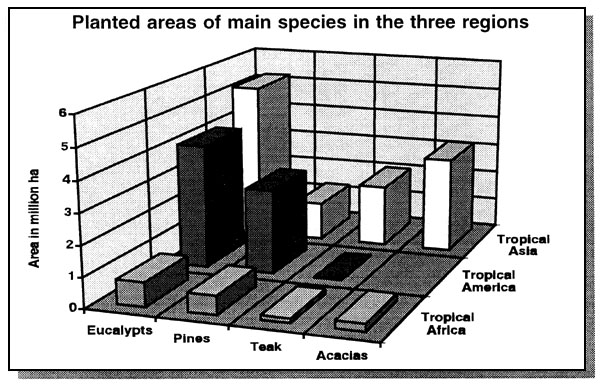
Area information at the species level in plantations was very scarce. In a few cases, there was also an element of uncertainty in the actual name of the species due to hybridization and unknown seed source. For example, in India the commonly planted species, Eucalyptus hybrid, was thought to be at least partly pure Eucalyptus tereticornis, and partly a hybrid from spontaneous hybridization between this species and E. grandis. Generally speaking, countries reported plantation areas by genus/species group, and in many cases only the name of the main species used in plantations, without indicating the area or end use. As a result, assessment of the area occupied by each species and its end use was difficult. A tentative estimate of plantation areas of the main genus/species group in the tropics to the end of 1990 is presented above.
Estimates of Reported areas of the main species
(million ha)
| Regions/Species | Eucalypts | Pines | Teak | Acacias | Others | Total |
|---|---|---|---|---|---|---|
| Tr. Africa | 0.79 | 0.61 | 0.15 | 0.25 | 1.19 | 2.99 |
| Tr. America | 4.07 | 2.78 | 0.01 | - | 1.78 | 8.64 |
| Tr. Asia & Pacific | 5.20 | 1.25 | 2.03 | 3.15 | 20.68 | 32.30 |
| Total | 10.06 | 4.64 | 2.19 | 3.40 | 23.65 | 43.93 |
| Percentage | 23 | 10.5 | 5 | 7.7 | 53.8 | 100 |
In Tropical Africa, eucalypts and pines occupied about 50% of the total plantation area. Pines and Cupressus lusitanica (0.13 million ha) were planted mainly for industrial purposes in southern and insular Africa and Kenya. Plantations of eucalypts were widely distributed throughout the region. Most of the acacias were planted for the production of fuelwood, tannin (A. mearnsii) and gum arabic (A. senegal). Plantations of exotic teak and indigenous timber species like Terminalia spp and Khaya spp were confined to west Africa. The total plantation area of Gmelina arborea was about 0.16 million ha, 60% of which is planted in Nigeria for industrial use. Other important species which have been widely introduced are Neem, Cassia and Prosopis spp.
In Tropical America, pines and eucalypts were the main species groups, occupying more than 80% of the total plantation area. Pines were mainly established for industrial purposes whereas eucalypts were established for both industrial and non-industrial purposes. Other species which occupied significant area (>10,000 ha) were gmelina, casuarina, mahogany, cypress and teak.
In Tropical Asia, eucalypts, teak and acacias were the most favoured species in the plantations. Pines were planted to a limited extent both for industrial and non-industrial purposes. About 0.6 million ha of Pinus merkusii were planted in Indonesia for resin tapping. Teak has been planted for industrial use and was mostly confined to Indonesia, India, Thailand, Bangladesh and Sri Lanka (listed by decreasing area). Eucalypts and acacias have been planted widely for industrial and non-industrial use but the major portion lay in India. Eucalyptus hybrid and Acacia nilotica were the main species of eucalypts and acacias in India. Other species occupying significant areas in the region were Dalbergia sissoo, Paraserianthes (Albizzia) falcataria, Casuarina spp, Gmelina, and Swietenia spp.
Estimation of the net plantation area in the tropics depends on the availability of the statistically designed plantation inventory reports from the countries. But in general a small area of the tropical plantations has been inventoried to estimate the net area of successfully established plantations. Several of the plantation survey reports presented and analyzed in Chapter 4 are neither reliable nor statistically designed. For example. India's main survey report was based on a questionnaire. The estimates of the net planted areas presented in this section, therefore, must be treated as tentative.
Based on 56 plantation surveys/survival assessments in 18 tropical countries, the weighted average of success percent in the tropical zone was found to be about 70% with a standard error of ±7% at 95% confidence level. Applying this weighted average and standard errors, then the net area of the total plantation in the tropics to the end of 1990 was estimated to lie between 27.6 and 34.08 million ha. The estimated net planted areas, for Tropical Asia and Pacific (success percent 61%) lay between 17.71 and 21.83 million ha and for Tropical America (success percent 84%) between 6.74 and 7.81 million ha at 95% confidence level, on the basis of inventory reports/survival results of respective regions. In the absence of adequate data from tropical Africa (inventory results cover only 6% of the plantation areas) the net area was tentatively estimated using the total tropical success rate of (70%); it lay between 1.88 and 2.32 million ha. Similarly, the net area of average annual plantation during 1981–90 for total tropical and regional levels was estimated by applying the above success rates. The comparative reported and net plantation areas to end 1990 and annual plantation rates are presented in the following table.
Reported v/s net planted areas
| Regions | Tropical Asia/Pacific | Tropical America | Tropical Africa | Total Tropical | |
|---|---|---|---|---|---|
| Total (million ha) | |||||
| Reported | 32.30 | 8.64 | 2.99 | 43.92 | |
| Estimated net | 19.77 | 7.28 | (2.10) | 30.84* | |
| Annual (000 ha) | |||||
| Reported | 2,112 | 373 | 127 | 2,612 | |
| Estimated net | 1,292 | 314 | (89) | 1,834* | |
It must, however, be stressed that these net planted areas were derived from inventories possibly carried out in the more successful plantation programmes; they are therefore tentative.
Non-forestry plantations have become a potential source of industrial wood due to advances in technology and the increasing scarcity of raw material. Area information about non-forestry plantations was available only from Tropical Asia, where they are mainly situated in Indonesia, Malaysia and Thailand and thus were not included in the forestry plantation areas. The FAO Production Year Book 1991 showed that about 85% of the total production of rubber, coconut and palm oil in the world was from Tropical Asia, from which it was inferred that most of the non-forestry plantations are situated in this region. Of the total estimated area of 14.0 million ha, rubber occupied 7.2 million ha and the rest were coconut (4.2 million ha) and oil palm (2.70 million ha)
As in tropical countries, the information about the actual area under existing forestry plantations in non-tropical developing and developed countries was quite uncertain. In many countries the figure for total plantation area were based on an accumulation of annual plantation areas without deleting the areas of old plantations already clear-felled. On the basis of country reports, total plantation area estimates and current annual planting rates of a few countries to the end of 1990 are presented in the following table.
Plantation areas to the end of 1990
(000 ha)
| Countries | Total | Annual |
|---|---|---|
| Non-tropical Developing Countries | ||
| China | 36,000 | 1,250 |
| Republic of Korea | 2,000 | 50 |
| Chile | 1,450 | 80 |
| Rep. of South Africa | 1,333 | 30 |
| Argentina | 800 | 25 |
| Morocco | 526 | 30 |
| Uruguay | 208 | 2 |
| Developed Countries | ||
| United States of America | 31,850 | 1,000 |
| Undivided USSR | 23,800 | 1,000 |
| Japan | 10,670 | 50 |
| Canada | 5,023 | 400 |
| New Zealand | 1,240 | 10 |
| Australia | 965 | 30 |
The annual plantation rate in China has been estimated from two successive plantation inventories of 1977–81 and 1984–88. Annual plantation rates of the Republic of Korea, Japan and New Zealand have been decreasing over the years whereas in other countries it was either steadily rising or stable. Chile, Republic of South Africa. New Zealand and Australia had mostly industrial plantations of pines and eucalypts and had quite high (>15 m3/ha per year) average increment. In the other developed countries mentioned above, though indigenous species were mostly planted, fast growing species were favoured and their proportion has increased. For example, Pinus taeda has been planted in USA and Cryptomeria japonica in Japan.
The detailed discussion about growth and yield data is in Chapter 4, where the actual yield of the main species (eucalypts, pines and teak) obtained from large scale plantations has been compared with the optimum yield from permanent sample plot data and the potential yield of natural forests of the same region. Due to the paucity of information it was not possible to reach a definitive conclusion about the growth performance of any species in any region, sub-region or country. Comparisons based on limited information, however, indicated that growth and yield of teak plantations over all was very low, eucalypts have attained close to potential growth rates in limited areas such as Brazil, Congo, Republic of South Africa, etc whilst pines, in industrial plantations, generally have a performance that is close to the potential of the site.
Yield of main plantation genera in selected countries
| Species | Tropical Region | Country | MAI (m3/ha/yr) | Rotation (years) |
|---|---|---|---|---|
| Eucalypts | America | Brazil | 18–20 | 8–10 |
| Africa | Burundi | 1.2–1.8 | 8 | |
| Congo | 30 | 7 | ||
| Rwanda | 8.5 | 8 | ||
| Rep. S.A. | 18–20 | 8–10 | ||
| Pines | America | Brazil | 15–25 | 16–25 |
| Venezuela | 10 | 10–20 | ||
| Chile | 24 | 20–30 | ||
| Africa | Malawi | 17 | 20–25 | |
| Madagascar | 6–10 | 15–18 | ||
| Mozambique | 11 | 18–25 | ||
| Teak | Asia | Bangladesh | 2.6–3 | 60 |
| India | 2.5 | 70 | ||
| Indonesia | 1.25–2 | 50–70 |
The actual yield of main plantation species/genera has also been quoted briefly in Chapter 4. The following information about the actual yield of main species/genera (eucalypts, pines and teak) was derived from isolated cases in a few countries and not related to area of plantation considered. It is presented as an overview and not for comparative purposes.
As can be seen, there was a lot of variation in the growth and yield of the main plantation general between different countries. A few countries were able to achieve higher than the potential yield of their natural forests through correct site/species matching, genetic improvement and adequate tending operations, while others were producing much less. Lower yield was mainly attributed to improper matching of species to planting site, poor quality planting stock, poor stocking, damage due to fire, grazing, illegal felling and encroachment. It would be, therefore, theoretically possible to increase the productivity of tropical plantations greatly without increasing the area, with proper management supported by research.
The potential contribution of some plantation programmes in the tropics to wood supplies, in spite of their biological success, has not been achieved because of the incorrect choice of location (eg. industrial plantations in Malawi), lack of industrial infrastructure (eg. gmelina plantation in Nigeria) and lack of market guarantees at remunerative prices for the produce (eg. social forestry in India). The integration of end use in plantation planning is, therefore, one of the vital issues for overall success and the sustainable development of plantations.
BIBLIOGRAPHY
FAO, 1991: Production Year book, Rome
![]()
![]()
![]()