Data on production, number of species and introduced species from the three major animal groups have been summarized in Table 1. As it is shown in Figure 2, Asia produces most of world’s aquaculture (84.9% of the total production reported at the species level to FAO, 1996). Europe is the second continent in quantity of aquaculture production but produces only 8.2% of the total. This striking difference from Asia and the other continents is not so evident in the number of species: in fact, the Asian production of more than 13 million of tons comes from the culture of 75 species while Europe produce ten times less using more than half the number of species used in Asia (Table 1).
Regarding introduced species, Asia, together with the Former USSR, is the continent in which introduced species give the lowest contribution to the total production of the continent (Figure 3). In Asia there are many important cultivated species native of the continent and then only four species have been introduced from other continents. Introduced species form a very important part of aquaculture production in other continents: 97.1% of crustaceans production in Europe, 96.2% of fishes production in South America, 84.7% in Oceania. Overall, 9.7% of aquaculture production comes from introduced species.
Although this list shows that world animal aquaculture is mainly based on about 260 species, the bulk of the production comes from a much more limited number of species. In fact, 31 species account for 95% of the total production reported to FAO (1996) (Table 2). Pullin (1995), using FAO and Taiwanese official statistics, made an estimate much higher: 105 finfish, 43 molluscs, 27 crustaceans and 6 seaweeds species would produce the 95% of farmed aquatic production. A similar exercise has been done for agriculture (Prescott-Allen and Prescott-Allen, 1990) and it demonstrated that 103 species of plants contribute 90% of the world's plant food supply and 95% of livestock production comes from 5 species of animals.
Among the three major groups, 17 finfish species constitute 95% of the total fish production reported to FAO at the species level: between these, the first five and a total of eleven are cyprinids (Figure 4). Crustaceans have the smallest number of species reported, but the highest percentage of species contributing to the 95% of total production which means that the bulk of production is distributed on a higher number of species in proportion (Table 2). On the total, about one fifth (18.9%) of the species reported produce the 95% of the total production at the species level.
The number of species important to aquaculture is steadily increasing but not at the rate that was expected as a consequence of the effort of researchers and farmers in experimenting new species suitable for aquaculture: considering a period of eleven years from 1984 to 1994, the total number of reports to FAO, at the species and at other taxonomic levels, has increased by 24.6%, respectively 39.1% at the species level and 18.5% at less defined taxonomic levels (Table 3). This could indicate a slight increase in the accuracy of the reporting of production data by Member countries but many problems still remain to be solved to improve the quality of aquaculture statistics (FAO, 1995b).
Table 1. Summary of production data (FAO, 1996) by continent for native and introduced species (n = number of species)
FISHES |
||||||||||||||||||||||||
Africa |
America, North |
America, South |
Asia |
Europe |
Oceania |
Former USSR |
Total |
|||||||||||||||||
n |
mt |
% |
n |
mt |
% |
n |
mt |
% |
n |
mt |
% |
n |
mt |
% |
n |
mt |
% |
n |
mt |
% |
n |
mt |
% |
|
| Native species | 15 |
47,981 |
85.2 |
14 |
287,235 |
90.3 |
7 |
4,713 |
3.8 |
49 |
8,949,705 |
91.4 |
22 |
426,994 |
63.7 |
6 |
1,673 |
15.3 |
8 |
121,712 |
95.9 |
121 |
9,840,013 |
88.6 |
| Introduced species | 5 |
8,363 |
14.8 |
8 |
30,950 |
9.7 |
9 |
118,045 |
96.2 |
4 |
845,179 |
8.6 |
8 |
243,630 |
36.3 |
10 |
9,256 |
84.7 |
3 |
5,242 |
4.1 |
47 |
1,260,665 |
11.4 |
| Total by continent | 20 |
56,344 |
22 |
318,185 |
16 |
122,758 |
53 |
9,794,884 |
30 |
670,624 |
16 |
10,929 |
11 |
126,954 |
168 |
11,100,678 |
||||||||
CRUSTACEANS |
||||||||||||||||||||||||
Africa |
America, North |
America, South |
Asia |
Europe |
Oceania |
Former USSR |
Total |
|||||||||||||||||
n |
mt |
% |
n |
mt |
% |
n |
mt |
% |
n |
mt |
% |
n |
mt |
% |
n |
mt |
% |
n |
mt |
% |
n |
mt |
% |
|
| Native species | 4 |
630 |
86.3 |
3 |
32,289 |
95.0 |
3 |
111,674 |
98.5 |
12 |
674,462 |
100 |
2 |
66 |
2.9 |
6 |
1,899 |
100 |
0 |
0 |
30 |
821,020 |
99.3 |
|
| Introduced species | 2 |
100 |
13.7 |
1 |
1,706 |
5.0 |
1 |
1,757 |
1.5 |
0 |
0 |
4 |
2,229 |
97.1 |
0 |
0 |
0 |
0 |
8 |
5,792 |
0.7 |
|||
| Total by continent | 6 |
730 |
4 |
33,995 |
4 |
113,431 |
12 |
674,462 |
6 |
2295 |
6 |
1899 |
0 |
0 |
38 |
826,812 |
||||||||
MOLLUSCS |
||||||||||||||||||||||||
Africa |
America, North |
America, South |
Asia |
Europe |
Oceania |
Former USSR |
Total |
|||||||||||||||||
n |
mt |
% |
n |
mt |
% |
n |
mt |
% |
n |
mt |
% |
n |
mt |
% |
n |
mt |
% |
n |
mt |
% |
n |
mt |
% |
|
| Native species | 6 |
2,396 |
74.5 |
11 |
108,762 |
61.0 |
6 |
21,205 |
94.9 |
10 |
2,587,666 |
100 |
9 |
438,919 |
74.4 |
5 |
54,373 |
91.5 |
2 |
1,815 |
100 |
49 |
3,215,136 |
93.4 |
| Introduced species | 1 |
818 |
25.5 |
2 |
69,413 |
39.0 |
1 |
1,130 |
5.1 |
0 |
0 |
2 |
150,792 |
25.6 |
2 |
5,082 |
8.5 |
0 |
0 |
8 |
227,235 |
6.6 |
||
| Total by continent | 7 |
3,214 |
13 |
178175 |
7 |
22,335 |
10 |
2,587,666 |
11 |
589,711 |
7 |
59,455 |
2 |
1,815 |
57 |
3,442,371 |
||||||||
TOTAL ANIMAL SPECIES |
||||||||||||||||||||||||
Africa |
America, North |
America, South |
Asia |
Europe |
Oceania |
Former USSR |
Total |
|||||||||||||||||
n |
mt |
% |
n |
mt |
% |
n |
mt |
% |
n |
mt |
% |
n |
mt |
% |
n |
mt |
% |
n |
mt |
% |
n |
mt |
% |
|
| Native species | 25 |
51,007 |
84.6 |
28 |
428,286 |
80.8 |
16 |
137,592 |
53.2 |
71 |
12,211,833 |
93.5 |
33 |
865,979 |
68.6 |
17 |
57,945 |
80.2 |
10 |
123,527 |
95.9 |
200 |
13,876,169 |
90.3 |
| Introduced species | 8 |
9,281 |
15.4 |
11 |
102,069 |
19.2 |
11 |
120,932 |
46.8 |
4 |
845,179 |
6.5 |
14 |
396,651 |
31.4 |
12 |
14,338 |
19.8 |
3 |
5,242 |
4.1 |
63 |
1,493,692 |
9.7 |
| Total by continent | 33 |
60,288 |
39 |
530,355 |
27 |
258,524 |
75 |
13,057,012 |
47 |
1,262,630 |
29 |
72,283 |
13 |
128,769 |
263 |
15,369,861 |
||||||||
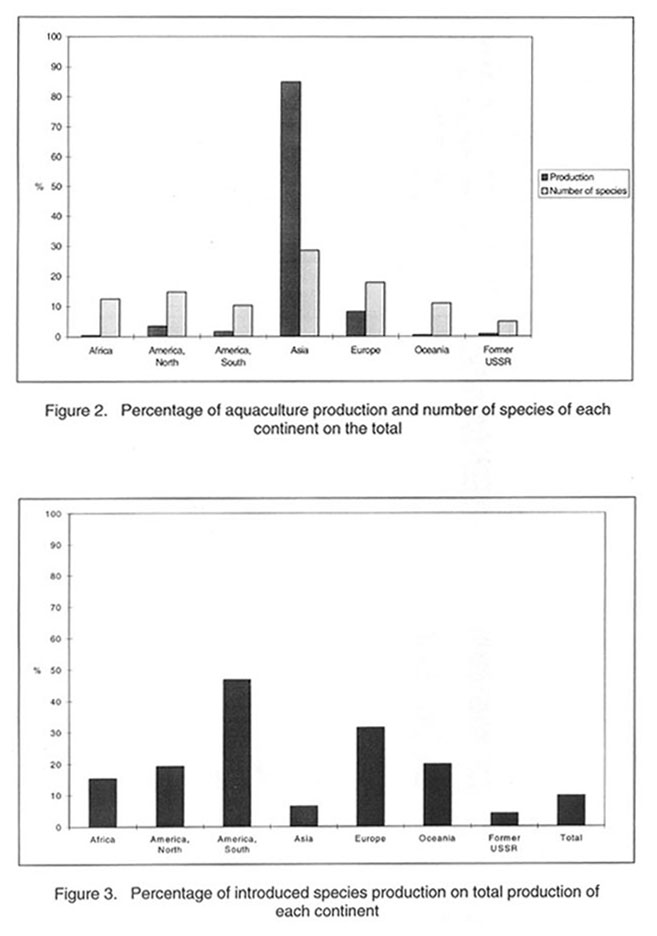
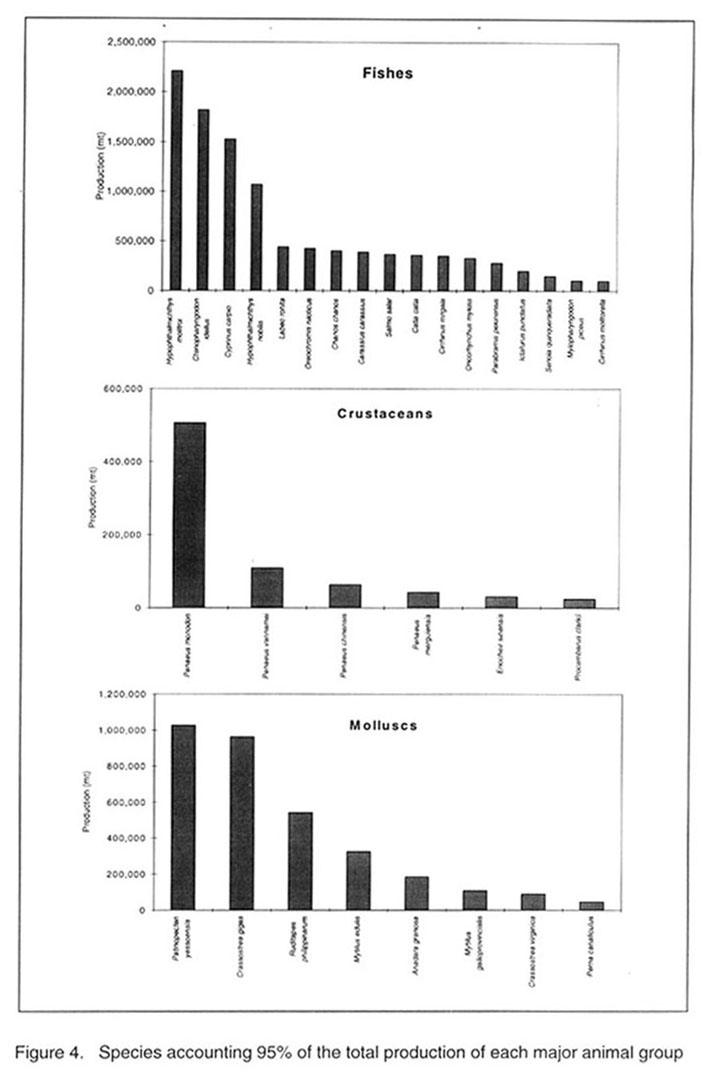
Table 2. Number of species having production figures (FAO, 1996) and accounting for 95% of production for each major animal group
| Major animal group | Number of species having production figures |
Number of species accounting for 95% of production |
% |
| Fishes | 102* |
17 |
16.7 |
| Crustaceans | 21 |
6 |
28.6 |
| Molluscs | 41* |
8 |
19.5 |
| Total | 164* |
31 |
18.9 |
Table 3. Number of species and other taxonomic levels* having aquaculture production reported to FAO from 1984 to 1994 for the three major animal groups
1984 |
1985 |
1986 |
1987 |
1988 |
1989 |
1990 |
1991 |
1992 |
1993 |
1994 |
|
| FISHES | |||||||||||
| n of species | 73 |
76 |
82 |
84 |
89 |
90 |
91 |
95 |
94 |
101 |
103 |
| n of other taxa | 32 |
32 |
35 |
36 |
34 |
36 |
34 |
38 |
37 |
37 |
38 |
| Totals | 105 |
108 |
117 |
120 |
123 |
126 |
125 |
133 |
131 |
138 |
141 |
| CRUSTACEANS | |||||||||||
| n of species | 14 |
20 |
20 |
20 |
21 |
21 |
19 |
20 |
19 |
20 |
21 |
| n of other taxa | 10 |
10 |
10 |
11 |
11 |
10 |
10 |
10 |
9 |
8 |
10 |
| Totals | 24 |
30 |
30 |
31 |
32 |
31 |
29 |
30 |
28 |
28 |
31 |
| MOLLUSCS | |||||||||||
| n of species | 33 |
32 |
34 |
35 |
33 |
36 |
38 |
39 |
38 |
40 |
43 |
| n of other taxa | 12 |
12 |
12 |
15 |
16 |
16 |
16 |
16 |
15 |
15 |
16 |
| Totals | 45 |
44 |
46 |
50 |
49 |
52 |
54 |
55 |
53 |
55 |
59 |
| Total three groups | |||||||||||
| n of species | 120 |
128 |
136 |
139 |
143 |
147 |
148 |
154 |
151 |
161 |
167 |
| n of other taxa | 54 |
54 |
57 |
62 |
61 |
62 |
60 |
64 |
61 |
60 |
64 |
| Totals | 174 |
182 |
193 |
201 |
204 |
209 |
208 |
218 |
212 |
221 |
231 |
Sources: FAO, 1989, 1990, 1991, 1992, 1993, 1994b, 1995d, 1996.
![]()
![]()
![]()