Animal metabolism
Information was made available to the Meeting on studies of ferbam metabolism in lactating goats and sheep.

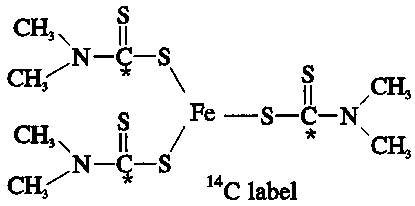
Tissue, milk and excreta residues were measured in lactating goats (2 goats, each weighing approximately 45 kg) dosed once daily after the morning milking for 5 consecutive days orally by capsule with 500 mg [thiocarbonyl-14C]ferbam at 11.4 and 11.1 mg/kg bw/day, equivalent to 220-250 ppm ferbam in the feed (Daun, 1993). The feed consumption was 1 kg/animal/day of a grain mixture (shelled maize, oats, mineral mix, wet molasses, dairy pellets) as well as alfalfa grass hay provided ad libitum; the mean total daily feed consumption was 2.0-2.3 kg. The animals were hand-milked twice daily; the milk production was 1.5-1.6 kg per day. Milk and excreta were collected throughout, and the goats were slaughtered 6 hours after the final dose for tissue collection.
The distribution of 14C was as shown below.
|
|
14C % of dose |
|
|
Goat 1 |
Goat 2 |
|
|
Milk |
0.70 |
0.79 |
|
Urine |
8.3 |
11.9 |
|
Faeces |
32.1 |
25.0 |
|
Tissues |
2.7 |
5.6 |
|
TOTAL |
43.8 |
43.3 |
Levels of 14C in the milk increased for the first 2 or 3 days of feeding and then reached a plateau (Table 1). Levels of 14C were higher in the liver than in other tissues (Table 2) and higher in the kidneys than in fat and muscle. Less than 50% of the dose was accounted for by the 14C found in the milk, urine and faeces. It is possible that 14C was lost as 14CS2 or 14CO2 in expired air, which was not collected.
Most of the 14C residues in the milk, liver, kidneys, muscle and fat were not extractable with a chloroform/methanol/water mixture until after protease treatment. The soluble 14C components produced by protease were mostly polar water-soluble compounds. Lactose and casein containing the 14C label were isolated from the milk. Urea containing 14C was isolated from the urine. This evidence supported other strong indications that much of the 14C in the milk and tissues had been incorporated into natural products.
Table 1. Levels of 14C in milk produced by 2 goats dosed daily with [14C]ferbam equivalent to 220-250 ppm in the feed (Daun, 1993).
|
Day |
14C as ferbam, mg/kg milk |
|||
|
Goat 1, am milking |
Goat 1, pm milking |
Goat 2, am milking |
Goat 2, pm milking |
|
|
1 |
|
0.96 |
|
0.94 |
|
2 |
1.8 |
2.3 |
2.0 |
2.9 |
|
3 |
2.4 |
2.8 |
2.9 |
3.3 |
|
4 |
2.8 |
4.0 |
3.4 |
3.9 |
|
5 |
2.9 |
3.4 |
3.5 |
3.7 |
Table 2. Levels of 14C in tissues and fluids from 2 goats dosed daily with [14C]ferbam equivalent to 220-250 ppm in the feed and slaughtered 6 hours after the final dose (Daun, 1993).
|
Sample |
14C as ferbam, mg/kg |
|
|
Goat 1 |
Goat 2 |
|
|
Bile |
6.2 |
13.2 |
|
Blood |
2.5 |
3.2 |
|
Fat (omental) |
0.47 |
0.66 |
|
Fat (renal) |
0.54 |
0.89 |
|
Kidneys |
8.3 |
9.4 |
|
Liver |
63 |
75 |
|
Muscle |
1.5 |
1.9 |
Hunt and Gilbert (1976) dosed sheep (ewes) orally by gelatin capsule with [3H]ferbam and [35S]ferbam and examined the excreta and tissues for the radiolabels. One sheep weighing 32 kg was dosed with [3H]ferbam at 0.74 mg/kg bw and [35S]ferbam at 0.45 mg/kg bw, a total dose of 1.19 mg ferbam/kg bw. The second sheep, also weighing 32 kg, was treated with 14.5 mg [35S]ferbam equivalent to 0.45 mg/kg bw. The sheep were slaughtered 72 hours after dosing for tissue collection and analysis.
Over 80% of the dosed 3H but only 23-24% of the 35S was excreted in the urine and faeces (Table 3). This is consistent with studies of thiram in rats which showed that 40-60% of the CS2 part of the molecule was eliminated as volatile compounds in exhaled air. The level of 3H in the liver was much higher than that of 35S, demonstrating that the dithiocarbamic acid moiety had largely been degraded (Table 4).
Table 3. Excretion of 35S and 3H from 2 sheep dosed with [35S]ferbam + [3H]ferbam (sheep A) and [35S]ferbam (sheep B) and slaughtered 76 hours later (Hunt and Gilbert, 1976).
|
% of dose | |||||
|
Sheep A |
Sheep B | ||||
|
Urine |
Faeces |
Urine |
Faeces | ||
|
35S |
3H |
35S |
3H |
35S |
35S |
|
12 |
62 |
11 |
20 |
14 |
10 |
Table 4. Residues of 35S and 3H (expressed as ferbam) in tissues of 2 sheep dosed with [35S]ferbam + [3H]ferbam (sheep A) and [35S]ferbam (sheep B) and slaughtered 76 hours later (Hunt and Gilbert, 1976).
|
Sample |
Residues of radiolabel, expressed as ferbam, mg/kg |
||
|
Sheep A |
Sheep B |
||
|
35S |
3H |
35S |
|
|
Fat, omental |
0.05 |
0.09 |
0.04 |
|
Kidneys |
0.72 |
0.81 |
0.77 |
|
Liver |
0.66 |
3.4 |
1.0 |
|
Muscle |
0.14 |
0.22 |
0.11 |
Plant metabolism
No information was available.
Environmental fate
No information was available on the fate of ferbam in soils or in water/sediment systems.