In storage
No data were provided.
In processing
Processing studies have been conducted on apples, grapes and tea.
Apples. Washed apples from two trials in Germany at a two-fold rate were processed into juice and purée on a household scale (Raquet et al; 1993). Sample were analysed by GLC with an LOD of 0.01 mg/kg for juice and washings and 0.02 mg/kg for fruit.
The aqueous washings showed no residues above 0.02 mg/kg. The peel obtained during the production of purée was not analysed. Pomace from the production of juice showed slightly higher residues than those in the original fruit. The results are shown in Table 39.
Apples from other German trials (Brusche and Holzwarth, 1995) were processed to purée and juice. The procedures are shown in Figures 9 and 10. After the addition of 0.5 1 water per kg fruit, the fruit was boiled for 20 minutes and sieved. The fractions obtained were washed fruit, washings, peels and pips, and purée (apple sauce). For the preparation of juice, cut apples were pressed in a juice extractor without prior heating. The crude juice was then filtered, poured into glass bottles, and pasteurized for 25 minutes at 75°C. The low concentration of tebufenozide in the washings indicates that washing does not substantially reduce the residues in the fruit. About 40-60% of the residues in the harvested apples remained in the wet pomace or peels and pips.
Table 39. Residues of tebufenozide in apples and processed fractions.
|
Country, year |
kg ai/ha |
PHI, days |
Residue, mg/kg (Ratio to residue in unwashed fruit) |
Reference |
|||||
|
Unwashed fruit |
Washed fruit |
Wet pomace |
Purée |
Washings |
Juice |
||||
|
Germany |
0.366 |
28 |
0.08 |
0.05 |
0.11 |
0.02 |
0.01 |
0.01 |
Raquet, 1993 |
|
1992 |
|
|
|
(0.63) |
(1.4) |
(0.25) |
|
(0.13) |
|
|
Germany |
0.382 |
28 |
0.11 |
0.06 |
0.13 |
0.02 |
<0.01 |
<0.01 |
Raquet, 1993 |
|
1992 |
|
|
|
(0.55) |
(1.2) |
(0.18) |
|
10* (0.09) |
|
|
Germany |
0.54 |
25 |
0.1 |
0.15 |
0.22 |
0.02 |
0.02 |
0.03 |
Brusche, 1995 |
|
1993 |
|
|
|
(1.5) |
(2.2) |
(0.2) |
(0.2) |
(0.3) |
|
|
Germany |
0.366 |
28 |
0.08 |
0.05 |
0.11 |
0.02 |
<0.01 |
0.01 |
Raquet, 1993 |
|
Germany |
0.54 |
27 |
0.07 |
|
0.3 |
0,03 |
peel and pips 0.49 |
0.02 |
Brusche, 1995 |
|
1993 |
|
|
|
|
(4.3) |
(0.43) |
0.02 (0.29) |
(0.29) |
|
|
Germany |
0.54 |
27 |
0.18 |
0.18 |
0.26 |
0.04 |
0.02 |
0.04 |
Brusche, 1995 |
|
1993 |
|
|
|
(1.0) |
(1.4) |
(0.22) |
|
(0.22) |
|
|
USA |
2.80 |
7 |
0.57 |
|
0.85 |
|
|
0.54 |
Deakyne, 1994c |
|
1991 |
|
|
|
|
(1.5) |
|
|
1 (0.95) |
|
|
USA |
2.02 |
7 |
0.56 |
0.44 |
2.4 |
|
pasteurized |
0.025 (0.05) |
Deakyne, 1995a |
|
1994 |
|
|
|
(0.79) |
(4.3) |
|
unpasteurized |
0.026 (0.05) |
|
Figure 9. Apple processing scheme 1 (Germany).
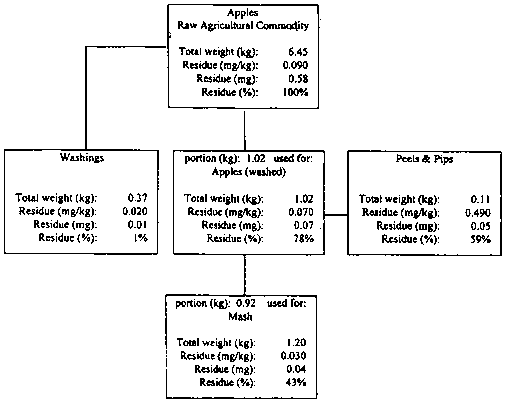
% values refer to absolute amount of tebufenozide (mg) in the raw agricultural commodity (unwashed apples)N.B.: for the preparation of mash 0.5 litre water/kg peeled fruit was added
Red delicious apples were treated with tebufenozide (10 applications at 0.28 kg ai/ha each) in the USA (Deakyne, 1994). The treatment was not according to GAP but was designed to produce high residues for processing. Unwashed apples harvested 7 days after the final application were sliced with a Hobart slicer and then added to a Hobart pulp/juicer. The juice and wet pomace were collected in separate containers. The wet pomace was pressed in a small wine press to remove excess juice which was added to the juice previously collected. Half the wet pomace was further homogenized (wet pomace fraction). Samples were analysed by HPLC (Deakyne et al, 1994b). The limit of determination was 0.02 mg/kg. The residue was slightly reduced in juice but slightly increased in wet pomace.
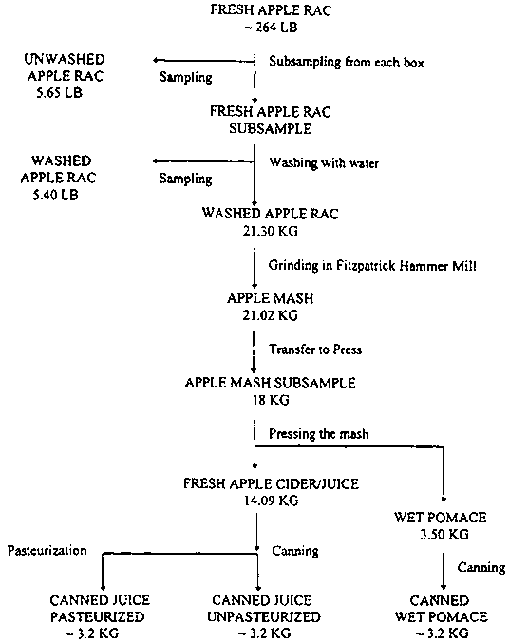
In a 1994 processing study in the USA (Deakyne, 1995a), six applications of the 70WP formulation of tebufenozide were made at 0.336 kg ai/ha to red delicious apples, a total of 2.0 kg ai/ha. Apples harvested 7 days after the final application were processed to produce pomace, unpasteurized juice and pasteurized juice by a procedure similar to the commercial process (Figure 11). The apples were lightly washed as is typical of commercial practice before grinding in a Fitzpatrick hammer mill with a no. 4 screen. A small press was used to press out the apple juice from the mash. The freshly squeezed juice was canned and some cans were subjected to pasteurization in a heat exchanger at a minimum temperature of 87.7°C. The ground wet pomace taken directly from the press was split into sublets and stored frozen at -23.3°C. All samples were kept frozen until analysis in duplicate by the method of Deakyne, et al. (1994b). The results are shown in Table 39. Washing the treated apples with water reduced the residues by about 20%. Pasteurized and unpasteurized juice contained essentially identical residues, 0.025 and 0.026 mg/kg respectively, about 5% of the level in the paplies. The residue in the pomace was about four times that in the whole fruit.
Processing apples to purée and juice reduced the residues considerably. In German apple processing studies about 40-60% of the residues on the harvested samples remained with the pomace or peel and pips, with an overall reduction of the residue level of 2.3-5.5-fold for the preparation of purée and 3-10-fold for the preparation of juice.
A 1-4-fold concentration of the residues in wet pomace was found in apple processing studies in Germany and the USA.
Figure 10. Apple processing scheme 2 (Germany).
% values refer to absolute amount of tebufenozide (mg) in the raw agricultural commodity (unwashed apples)N.B.: for the preparation of mash 0.5 litre water/kg peeled fruit was added
Figure 11. Apple processing scheme (USA).
Grapes. Three trials in 1992 and two in 1993 were conducted in France for processing studies (DeWilde et al., 1995a,b) with three applications at the recommended rate of 0.144 kg ai/ha. The grapes were harvested at the maturity stage required for wine production and processed to either red or white wine depending on the grape variety.
Processing was by the officially recommended method of the Ministry of Agriculture in France to establish the influence of plant protection products on the wine-making process (DeWilde et al., 1995a). The vinification processes for red and white wines are shown in Figures 12 and 13. Normally white wine is fermented without the grape skins but the skins were included in some white fermentations to assess the residue distribution.
Samples were analysed by the GLC method of Mellet (1993a). Processing of grapes to must and wine reduced the residues in the wine to about 20-40% of those in the grapes and increased the residues in the must with skins by about 13-40%. A single sample of pomace showed a concentration of the residue.
The fate of tebufenozide during the distillation of wine spiked with it was studied in France (Gocha, 1995a). A solution containing 2.5 mg of tebufenozide was added to one of two 5 l jars of wine to give a concentration of 0.5 mg/l. The second jar was used as a control. The wine was kept at room temperature overnight before distilling 4800 ml each of control and treated samples under conditions simulating those used commercially to produce cognac. Four fractions were analysed: wine before distillation, the fraction distilling at increasing temperatures up to 89°C, the fraction distilling at a constant 90°C, and the undistilled residue. Analyses were by the method of Mellet (1993a). No tebufenozide was detected in any of the distilled fractions.
Processing trials were conducted in Germany in 1992 (Ulrich et al., 1994) and 1993 (Kaiser, 1994). The plot size in 1992 was governed by the number of samples to be taken but was not less than 0.58 ha. At the last sampling (28-day PHI), about 200 kg grapes were taken from at least 30 vines at 2 locations for processing to must and wine. The processing scheme is shown in Figure 14. The first wine sample was taken for residue analysis at the time of bottling at the filter outlet and a second about 6 months after bottling (the normal maturation period). Processing the grapes to must (without skins) and wine reduced the residues. In the 1993 trials the residues in must (without skins) were lower and those in pomace higher by factors of about 3 to 4 than those in the corresponding grapes. The residues in the must were 0.06 and 0.12 mg/kg.
In trials in Italy (Kaiser and Holzwarth, 1994) harvested white grapes were crushed and destalked, then pressed to give must (without skins) accounting for 60 to 65% of the total mass of the grapes. For red wine, the destalked mash was fermented for 4 to 6 days before pressing and further fermentation and run-off as for white wine. After storage of the young wine in stainless steel containers for about 5 months, wine samples were taken for residue analysis. The residues in the must and wine were again significantly lower than in the fresh grapes. The results of all the trials are shown in Table 40. Residues in mature wine are compared with those in the original grapes in Table 41, which shows that residues in the wine were on average only 36% of those in the grapes.
Table 40. Residues of tebufenozide in processed products of grapes.
|
Country, year, red/white grapes |
Total applicn., kg ai/ha |
PHI, days |
Residue (mg/kg) |
Comments |
Reference |
||||
|
Grapes |
Must |
Pomace |
Wine |
||||||
|
young |
matured |
||||||||
|
France 1992 r |
0.432 |
40 |
0.18 |
0.251 |
|
|
0.08 |
duplicate analyses |
DeWilde, 1995a |
|
France 1992 r |
0.432 |
41 |
0.06 |
0.081 |
|
|
0.03 |
duplicate analyses |
DeWilde, 1995a |
|
France 1992 w |
0.432 |
25 |
0.081 |
0.091 |
|
|
0.03 |
duplicate analyses |
DeWilde, 1995a |
|
France 1993 w |
0.432 |
19 |
0.17 |
0.062 |
0.266 |
|
0.04 |
triplicate analyses of grapes mud=0.129 lees=0.168 |
DeWilde, 1995b |
|
France 1993 r |
0.432 |
21 |
0.28 |
0.341 |
|
0.09 |
0.06 |
|
DeWilde, 1995b |
|
France 1991 r |
0.144 |
66 |
0.11 |
|
|
|
0.05 |
triplicate analyses PHI=70 days for wine |
Gocha, 1995a |
|
France 1992 w |
0.288 |
50 |
0.17 |
0.01 |
|
|
|
spirit 0.01 |
Gocha, 1995a |
|
Germany 1992 w |
0.557 |
28 |
0.27 |
0.032 |
|
0.02 |
0.02 |
|
Ulrich, 1994 |
|
Germany 1992 r |
0.555 |
28 |
0.4 |
0.122 |
|
0.18 |
0.26 |
|
Ulrich, 1994 |
|
Germany 1993 w |
0.519 |
28 |
0.22 |
0.062 |
0.620 |
|
0.08 |
|
Kaiser, 1994 |
|
Germany 1993 r |
0.535 |
28 |
0.42 |
0.122 |
1.570 |
|
0.14 |
|
Kaiser, 1994 |
|
Italy 1992 r |
0.478 |
21 |
0.56 |
0.072 |
|
0.183 (0.11)4 |
0.1 |
|
Kaiser and Holzwarth, 1994 |
|
Italy 1992 r |
0.96 |
21 |
0.86 |
0.072 |
|
0.233 (0.17)4 |
0.17 |
|
Kaiser and Holzwarth, 1994 |
|
Italy 1992 w |
0.456 |
21 |
0.26 |
0.032 |
|
0.13 (0.14)4 |
0.18 |
|
Kaiser and Holzwarth, 1994 |
|
Italy 1992 w |
0.96 |
21 |
0.84 |
0.092 |
|
0.273 (0.37)4 |
0.33 |
|
Kaiser and Holzwarth, 1994 |
1 Fermentation with skins
2 Fermentation without skins
3 Mid-fermentation
4 End of fermentation
Figure 12. Red wine vinification process (France).
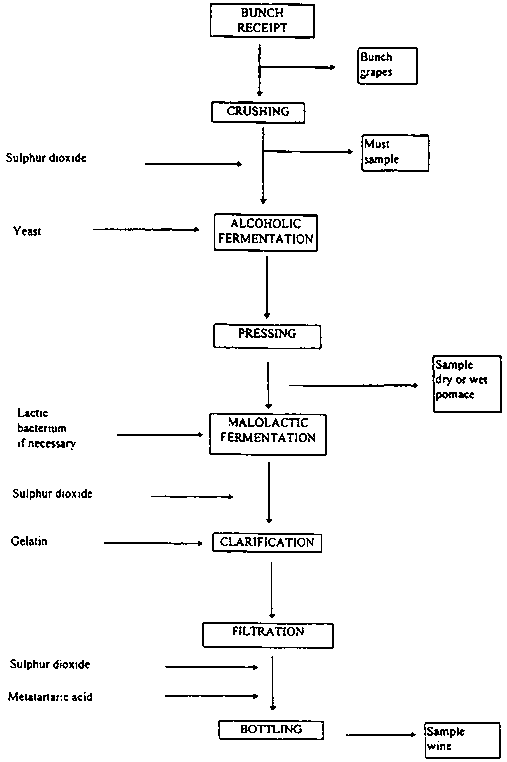
Figure 13. White wine vinification process (France).
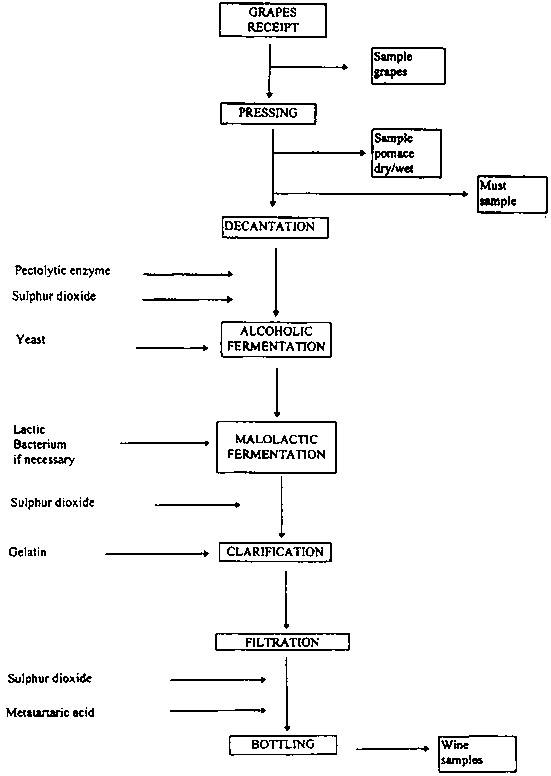
Figure 14. Wine vinification process (Germany, Italy).
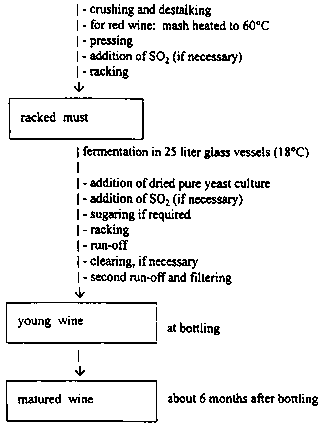
Table 41. Residues of tebufenozide in wine and grapes.
|
Country |
Total treatment kg ai/ha |
Grape type |
Residue mg/kg |
Reference |
mg/kg in wine as percentage of mg/kg in grapes |
|
|
Grapes |
mature wine |
|||||
|
France |
0.432 |
red |
0.179 |
0.083 |
DeWilde, 1995a |
46 |
|
|
0.432 |
red |
0.065 |
0.029 |
|
45 |
|
|
0.432 |
white |
0.080 |
0.025 |
|
31 |
|
France |
0.432 |
white |
0.166* |
0.038 |
DeWilde, 1995b |
23 |
|
|
0.432 |
red |
0.282 |
0.063 |
|
22 |
|
France |
0.144 |
red |
0.110 |
0.048 |
Gocha, 1995a |
44 |
|
Germany |
0.557 |
white |
0.27 |
0.02 |
Ulrich, 1994 |
7 |
|
|
0.555 |
red |
0.40 |
0.26 |
|
65 |
|
Germany |
0.519 |
white |
0.220 |
0.080 |
Kaiser, 1994a |
36 |
|
|
0.535 |
red |
0.420 |
0.140 |
|
33 |
|
Italy |
0.478 |
red |
0.560 |
0.100 |
Kaiser, 1994b |
18 |
|
|
0.96 |
red |
0.860 |
0.170 |
|
20 |
|
|
0.456 |
white |
0.260 |
0.180 |
|
69 |
|
|
0.96 |
white |
0.840 |
0.330 |
|
39 |
|
|
|
|
|
|
|
Average 36 |
Tea. Tea was brewed from samples of dry tea obtained from the field trials in Sri Lanka and Japan (Ishii, 1995; Komatsu and Yabusaki, 1993) by adding boiling water to the dry tea (60 ml/g) and allowing the solution to stand for 5 minutes. Samples of filtered brewed tea were analysed after partition and clean-up steps. The final residue in the brewed tea was calculated on the basis of the weight of the dry tea.
Although the residues of tebufenozide are relatively high in dry tea, they are much lower in brewed tea. As shown in Table 42, residues in the infusion, expressed on a dry tea basis, were only 5-31% of those in the original dry tea, with a mean of 17%.
Table 42. Residues of tebufenozide in dry tea and brewed tea.
|
Country |
Application rate kg ai/ha |
PHI, days |
Residue, mg/kg |
Residue in brewed tea as % of that in dry tea |
|
|
Dry tea |
Brewed tea1 |
||||
|
Sri Lanka |
0.15 |
0 |
93.2 |
22.6 |
24 |
|
|
|
4 |
22.3 |
4.1 |
18 |
|
|
|
7 |
14.6 |
2.6 |
18 |
|
|
|
10 |
3.98 |
0.78 |
20 |
|
Sri Lanka |
0,15 |
21 |
0.49 |
0.08 |
16 |
|
|
|
28 |
0.13 |
0.02 |
15 |
|
|
0.30 |
0 |
87.2 |
22 |
25 |
|
|
|
4 |
22 |
4.4 |
20 |
|
|
|
7 |
16 |
3 |
19 |
|
|
|
10 |
4.3 |
0.76 |
18 |
|
|
|
21 |
0.59 |
0.1 |
17 |
|
|
|
28 |
0.2 |
0.03 |
15 |
|
Japan |
0.80 |
14 |
11.5 |
3.5 |
31 |
|
|
|
21 |
6.2 |
0.92 |
15 |
|
|
|
30 |
2.4 |
0.29 |
12 |
|
|
0.80 |
14 |
11.6 |
1.4 |
12 |
|
|
|
21 |
2.0 |
0.18 |
9 |
|
|
|
30 |
0.22 |
0.01 |
5 |
|
|
|
|
|
|
Average 17 |
1 Expressed on dry tea basis
Residues in the edible portions of food commodities
No data were provided on residues in the edible portions of food commodities except those included in the processing trials described above. These showed overall reduction factors of 2.3-5.5 for preparing apple purée, 3.5 to 22 for preparing apple juice, 2-13 for vinifying grapes and about 3-20 for brewing tea.
RESIDUES IN FOOD IN COMMERCE OR AT CONSUMPTION
No information was provided.