![]()
![]()
![]()
Table 8. Residues on the surface and within grapes and leaves harvested after vines were treated 4 times with [14C]thiram at a dose equivalent to 3.2 kg ai/ha (Morgenroth and Wyss-Benz, 1995). Grape juice and press cake were prepared from acetonitrile-washed grapes.
|
Sample |
14C in apples and leaves expressed as mg thiram/kg and as % of total 14C or leaves. |
|||||
|
0 days |
14 days |
27 days |
||||
|
14C as thiram mg/kg |
% |
14C as thiram mg/kg |
% |
14C as thiram mg/kg |
% |
|
|
FRUIT |
||||||
|
MeCN washings of grapes |
8.6 |
61 |
3.5 |
38 |
3.4 |
35 |
|
Grape juice |
3.1 |
22 |
3.6 |
39 |
4.2 |
44 |
|
Grape press cake |
2.4 |
17 |
2.0 |
23 |
2.1 |
21 |
|
Grapes - TOTAL |
14.1 |
|
9.1 |
|
9.7 |
|
|
LEAVES |
||||||
|
MeCN washings of leaves |
616 |
90 |
92 |
57 |
12 |
13 |
|
MeCN-washed leaves |
69 |
10 |
69 |
43 |
81 |
87 |
|
Leaves - TOTAL |
685 |
|
161 |
|
93 |
|
Table 9. Thiram and unidentified metabolites RO and RI in acetonitrile washings from fruit and leaves after treatment of grape vines with [14C]thiram (Morgenroth and Wyss-Benz, 1995).
|
|
14C as thiram, mg/kg |
||
|
0 days |
14 days |
27 days |
|
|
FRUIT |
|||
|
Thiram |
8.5 |
3.2 |
3.2 |
|
Metabolite RO |
0.20 |
0.24 |
<0.3 |
|
Metabolite R1 |
<0.3 |
0.082 |
<0.3 |
|
Non-resolved 14C |
- |
- |
0.21 |
|
LEAVES |
|||
|
Thiram |
608 |
85 |
9.8 |
|
Metabolite RO |
8.1 |
6.9 |
<0.3 |
|
Non-resolved 14C |
- |
- |
2.1 |
Table 10. CS2-liberating residues in acetonitrile-washed grapes harvested at intervals after vines were treated 4 times with [14C]thiram at a dose equivalent to 3.2 kg ai/ha (Morgenroth and Wyss-Benz, 1995).
|
Fraction |
14C residues as mg thiram equivalents per kg grapes |
||
|
0 days |
14 days |
27 days |
|
|
Total residue |
5.4 |
5.6 |
6.3 |
|
CS2-liberating residue |
0.24 |
0.33 |
0.35 |
|
CS2 residue as % of total |
4.5 |
5.8 |
5.6 |
Womer and Balba (1978, 1979) showed that wheat seedlings (5 weeks old) grown in a sandy loam soil from [dimethylamine-14C]thiram-treated seed (334 mg thiram per kg seed) contained 0.25 mg/kg of 14C expressed as thiram, of which 0.019 mg/kg was thiram. Some plants were grown to maturity; 14C levels, as thiram, in the seed, chaff and straw were 0.05, 0.27 and 0.35 mg/kg respectively. The thiram level in the straw was <0.025 mg/kg.
After 4 weeks 62% of the recovered 14C was in the soil (35% in plants) within 3 cm of the treated seeds, with a further 2.9% in the next zone 1.3 cm beyond the first. No 14C was detectable beyond that zone. The pots (15 cm) had been watered with 50 ml water each day. The soil residues moved very little.
Harned and Tortora (1986) grew soya bean, cotton and wheat plants in a glasshouse and in the field from seed treated with [thiocarbonyl-14C]thiram and measured the 14C distribution in 30-day seedlings (Table 11) and mature plants (Table 12). The seed treatment rates (1 x) were wheat 1.3 mg ai/g seed, cotton 1.4 mg ai/g seed, and soya beans 1.03 mg ai/kg seed. Some plants were also produced from seed treated at a fivefold rate. 14C levels in the cotyledons and roots of the seedlings were higher than in the leaves and stems. In the mature plants the highest 14C levels were in the roots and the lowest in the seeds. Autoradiography of the seedlings showed that the highest levels of 14C were in the oldest parts of the plants.
Table 11. Distribution of 14C in 30-day soya bean, cotton and wheat seedlings grown from [14C]thiram-treated seed (Harned and Tortora, 1986).
|
Crop |
Plant part |
Total 14C expressed as thiram, |
|
| mg/kg | |||
|
Indoor |
Outdoor |
||
|
Soya bean |
leaf |
0.50 |
0.29 |
|
|
stem |
1.5 |
0.085 |
|
|
cotyledon |
108 |
1.7 |
|
|
root |
8.5 |
2.7 |
|
Cotton |
|
|
|
|
|
leaf |
0.049 |
0.046 |
|
|
stem |
0.291 |
0.054 |
|
|
cotyledon |
2.6 |
2.5 |
|
|
root |
0.69 |
0.73 |
|
Wheat |
|
|
|
|
|
leaf |
1.1 |
0.47 |
|
|
root |
15 |
14 |
Table 12. Distribution of 14C in mature soya bean, cotton and wheat plants grown from [14C]thiram treated seed (Harned and Tortora, 1986).
|
Crop |
Plant part |
Total 14C expressed as thiram, mg/kg dry weight of plant tissue |
|||
|
x 1 rate |
x 5 rate |
||||
|
indoor |
outdoor |
indoor |
outdoor |
||
|
Soya bean |
|
|
|
|
|
|
|
seed |
0.019 |
|
0.15 |
|
|
|
pod |
0.034 |
|
0.28 |
|
|
|
leaf |
0.12 |
|
1.4 |
|
|
|
stem |
0.29 |
|
3.2 |
|
|
|
root |
0.87 |
|
8.0 |
|
|
Cotton |
|
|
|
|
|
|
|
seed |
0.006 |
|
0.024 |
|
|
|
fibre |
0.008 |
|
0.018 |
|
|
|
husk |
0.11 |
|
0.14 |
|
|
|
leaf |
0.035 |
|
0.094 |
|
|
|
stem |
0.034 |
|
0.14 |
|
|
|
root |
0.26 |
|
1.0 |
|
|
Wheat |
|
|
|
|
|
|
|
seed |
0.078 |
0.005 |
0.51 |
0.036 |
|
|
chaff |
0.298 |
0.017 |
1.9 |
0.13 |
|
|
leaf |
0.822 |
0.025 |
4,1 |
0.14 |
|
|
root |
|
1.8 |
|
8.4 |
Nowakowski et al. (1986, 1987) used HPLC to separate and identify the thiram metabolites produced during the growing of soya bean, cotton and wheat seedlings in a glasshouse from seed treated at a fivefold rate as described by Harned and Tortora (1986). They showed that metabolites produced from [14C]thiram in soya bean tissue cultures were similar to those obtained from plant extracts. Tissue culture was used to generate sufficient quantities for identification. They identified dimethyldithiocarbamoyl glycoside and dimethylthiocarbamoyl glycoside as the major metabolites in all the seedlings.
The two glycosides accounted for 70% of the 14C in cotton seedlings and 50% in soya bean and wheat seedlings. A small amount of a cysteine conjugate was also identified. When aqueous wheat extract was treated with 50% sulphuric acid at 65°C only 3.4% of the 14C was liberated as CS2, suggesting that if any remaining metabolites contained the dithiocarbamoyl moiety they were largely unextractable.
Liu and Robinson (1994a) applied [14C]thiram at 0.062 g ai/100 g seed (the label rate) and 3.1 g ai/100 g seed (50 x label rate) to soya bean seeds which were germinated and grown in a glasshouse. Forage, pod, seed and straw samples were taken for measurement of 14C levels and identification of metabolites. The 14C was relatively evenly distributed in the various plant parts (Table 13). There was some evidence that 14CO2 had been evolved since 14C was detected in control plants growing nearby.
Table 13. Distribution of 14C in soya bean plants grown from [14C]thiram-treated seed (Liu and Robinson, 1994a).
|
Sample |
14C as thiram, mg/kg |
|
|
Treatment: 1 x label |
Treatment: 50 x label |
|
|
Forage, 29 days after sowing |
0.61 |
9.3 |
|
Forage, 69 days after sowing |
0.13 |
4.2 |
|
Straw |
0.33 |
9.4 |
|
Pods |
0.22 |
6.9 |
|
Seeds |
0.14 |
4.4 |
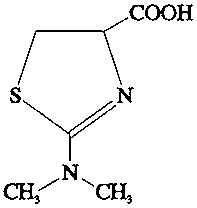
Extensive efforts were made to identify the 14C compounds in the soya bean forage, straw and pods. Much of the 14C had been incorporated into endogenous natural products such as sugars, fatty acids and citric acid, but the dimethyldithiocarbamoyl moiety of thiram had conjugated with amino acids and sugars. Thiram itself was not detected. The main metabolite identified was 2-dimethylamino-4-thiazolinecarboxylic acid which, in the case of the 50-fold treatment, constituted 22% of the 14C in the 69-day forage sample, 18% of that in the straw, 41% in the pod and 11% in the seed.
Direct treatment of homogenized tissue with acidic stannous chloride released some 14CS2, which showed that compounds or conjugates containing the dithiocarbamoyl moiety remained (Table 14).
Table 14. Nature of the volatile 14C released by reacting acidic stannous chloride with homogenised tissue from soya bean plants grown in a glasshouse from seed treated with [14C]thiram at 3.1 g ai/100 g seed (Liu and Robinson, 1994a).
|
Sample |
Volatile 14C as % of total 14C in sample |
|||
|
CS2 |
COS |
CO2 |
CO |
|
|
Forage, 69 days |
8.9 |
n |
15.1 |
1.3 |
|
Straw |
9.3 |
n |
23.8 |
1.3 |
|
Pod |
3.2 |
1.7 |
9.8 |
n |
|
Seed |
3.2 |
n |
3.5 |
6.5 |
n: no detectable residue.
In a metabolism study [14C]thiram at 0.1, 0.5 and 1.3 g ai/100 g seed (1, 5 and 13 times the label rate) was applied to wheat seed which was germinated and grown in a glasshouse (Johnson, 1994a; Liu and Robinson, 1994b). Forage, seed, chaff and straw samples were taken for measurement of 14C levels and identification of metabolites. The 14C was fairly evenly distributed among the various plant parts (Table 15). As in the soya bean study, 14C was detected in control plants growing nearby suggesting that 14CO2 had been produced.
Table 15. Distribution of 14C in wheat plants grown from [14C]thiram-treated seed (Liu and Robinson, 1994b).
|
Sample |
14C as thiram, mg/kg |
|
|
Treatment: 1 x label |
Treatment: 13 x label |
|
|
Forage, 32 days after sowing |
1.9 |
|
|
Forage, 60 days after sowing |
0.47 |
|
|
Straw, 95 days |
1.6 |
6.6 3.21 |
|
Chaff, 95 days |
0.32 |
4.9 |
|
Seed, 95 days |
0.16 |
1.1 |
1 Straw from a 5 x label rate treatment
The metabolism of thiram was similar in wheat and in soya beans. Again, much of the 14C was incorporated into endogenous natural products such as sugars, fatty acids and citric acid, but there was some conjunction of the N,N-dimethyldithiocarbamoyl moiety with amino acids and sugars. Thiram itself was not detected. The main metabolite identified was 2-dimethylamino-4-thiazolinecarboxylic acid which, in the case of the 13-fold treatment, constituted 33% of the 14C in the chaff, 29% in the straw, and 4% in the seed.
Direct treatment of homogenized tissue with acidic stannous chloride released some 14CS2, which showed that compounds or conjugates containing the dithiocarbamoyl moiety remained (Table 16).
Table 16. Nature of the volatile 14C released by reacting acidic stannous chloride with homogenized tissue from wheat plants grown in a glasshouse from seed treated with [14C]thiram at 0.1 (x 1), 0.5 (x 5) or 1.3 (x 13) g ai/100 g seed (Liu and Robinson, 1994b).
|
Sample |
Total 14C as thiram, mg/kg |
Volatile 14C as % of total 14C in sample |
|||
|
CS2 |
COS |
CO2 |
CO |
||
|
Forage (XI), 60 day |
|
n |
n |
n |
n |
|
Straw (x 13) |
6.6 |
2.3 |
n |
21 |
n |
|
Straw (x 5) |
3.2 |
6.8 |
n |
8.4 |
4.7 |
|
Chaff (x 13) |
4.9 |
2.5 |
n |
12 |
n |
|
Wheat grain (x 13) |
1.1 |
8.9 |
n |
8.7 |
n |
n: no detectable residue.
In a metabolism study [14C]thiram at 0.24 and 12 g ai/100 g seed (one and 50 times the label rate) was applied to sugar beet seed which was germinated and grown in a glasshouse (Johnson, 1994b; Liu and Robinson, 1994c). Samples of tops and roots were taken for measurement of 14C levels and identification of metabolites. The 14C levels were generally very low (Table 17).
As in the soya bean and wheat studies, 14C was detected in control plants growing nearby suggesting that 14CO2 had been produced.
Table 17. Distribution of 14C in sugar beet plants grown from [14C]thiram-treated seed (Liu and Robinson, 1994c).
|
Sample |
14C as thiram, mg/kg |
|
|
Treatment: 1 x label |
Treatment: 50 x label |
|
|
Immature tops, 100 days |
0.006 |
0.15 |
|
Mature tops |
0.012 |
0.096 |
|
Mature roots |
0.008 |
0.32 |
Levels of metabolites were generally low. Incorporation of 14C into sucrose, amino acids (such as glutamic acid) and acids of the citric acid cycle was established.
Direct treatment of homogenized tissue with acidic stannous chloride released some 14CS2 from roots produced from seed treated at the 50-fold rate but levels of 14C were generally too low for quantitative analysis (Table 18).
Table 18. Nature of the volatile 14C released by reacting acidic stannous chloride with homogenized tissue from sugar beet plants grown in a glasshouse from seed treated with [14C]thiram at 12 g ai/100 g seed (50-fold rate) Liu and Robinson (1994c).
|
Sample |
Total 14C as thiram, mg/kg |
Volatile 14C as % of total 14C in sample |
|||
|
CS2 |
COS |
CO2 |
CO |
||
|
Roots |
0.32 |
3.2 |
n |
5.4 |
3.8 |
|
Immature tops |
0.15 |
level too low for quantitative analysis |
|||
|
Mature tops |
0.096 |
level too low for quantitative analysis |
|||
n: no detectable residue.
The metabolic pathways of thiram in plants are shown in Figure 2.
![]()
![]()
![]()