Figure 1. Body plan of krill
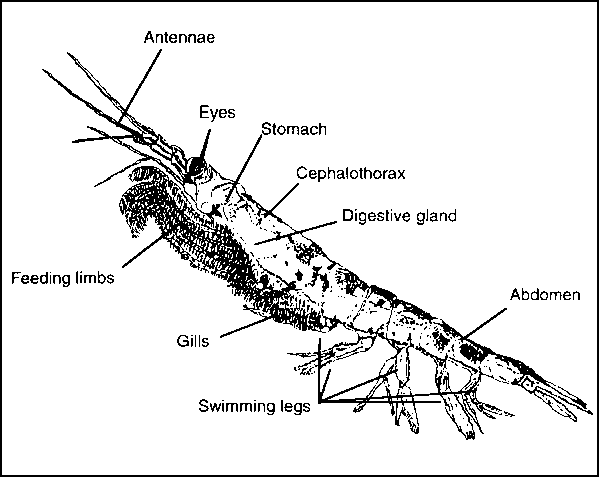
Figure 2. Distribution of Euphausia superba amd Nyctiphanes australis
Figure 4. Euphausiid fisheries in Japanese waters
Figure 5. Proposed krill fisheries on the East coast of Canada
Figure 6. Location of Antarctic krill catches
Figure 8. Reported annual catches of Antarctic krill
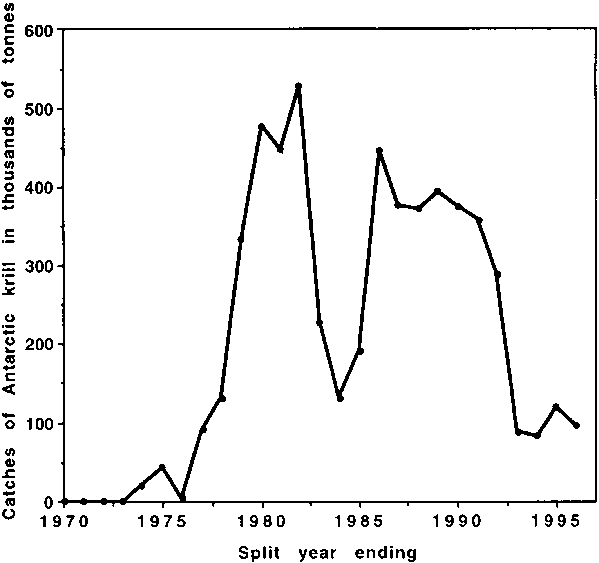
Figure 9. Statistical divisions in the CCAMLR Area
Figure 10. Map of Northern Japan indicating regions mentioned in text
Figure 11. Time series of length-frequency histograms of Euphausia pacifica collected in the coastal waters of Miyagi Prefecture in 1986-1989 (adapted from Odate, 1991)
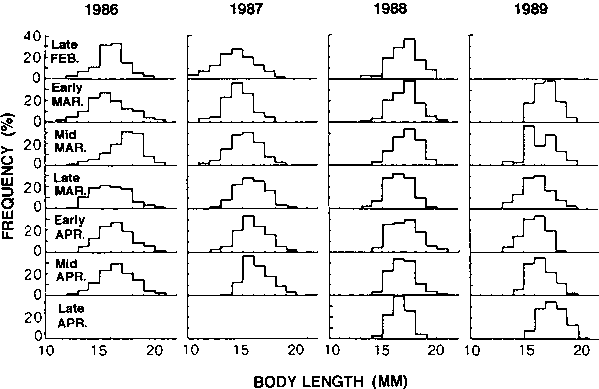
Figure 12a. Changes in the modal body length of Euphausia pacifica commercially landed in Ibaraki Prefecture during the 1992 fishing period (data from Ebisawa and Nemoto, 1992)
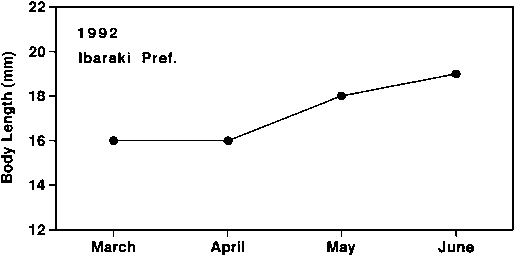
Figure 12b. Changes in the modal body length of Euphausia pacifica commercially landed at Miyako, Ryori (Iwate Prefecture), Onagawa (Miyagi Prefecture), Fukushima Prefecture and Oarai and Otsu (Ibaraki Prefecture) during the 1993 fishing period (data from: Taki, 1993; Watanabe and Suzuki, 1993; Yamazaki and Ebisawa, 1993)
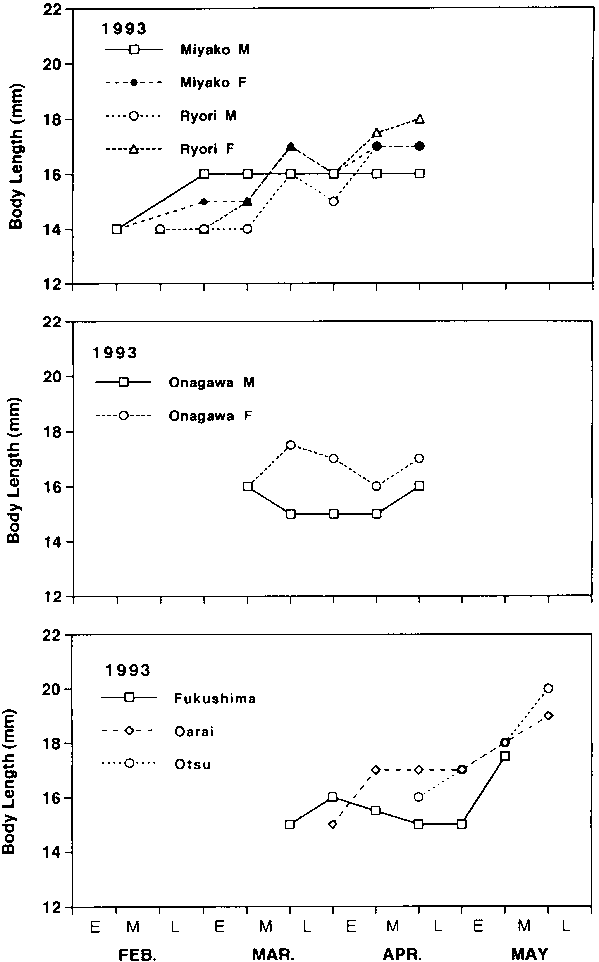
M = male, F = female
Figure 12c. Changes in the modal body length of Euphausia pacifica commercially landed, Ryori (Iwate Prefecture), Onagawa (Miyagi Prefecture), Fukushima Prefecture and Otsu (Ibaraki Prefecture) during the 1994 fishing period (data from: Akiyama, 1994; Ebisawa, 1994b; Taki, 1993)
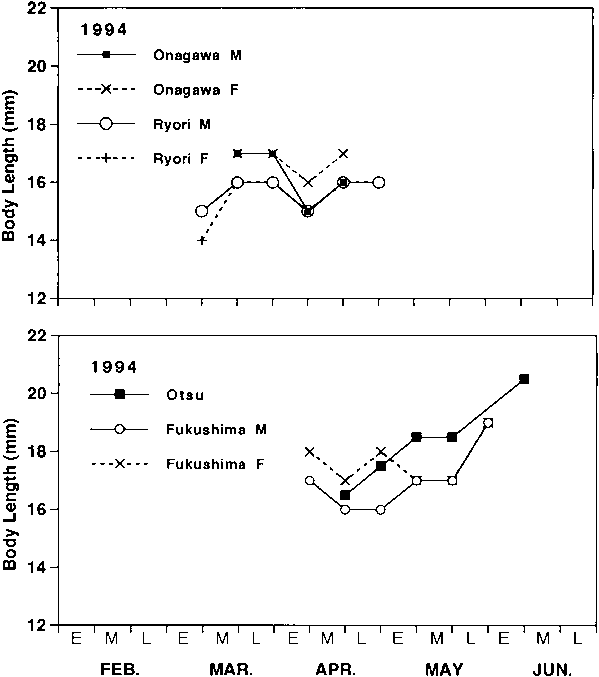
M = male, F = female
Figure 13. Location of Toyama Bay and the sampling station (circled star) (from Iguchi et al., 1993)
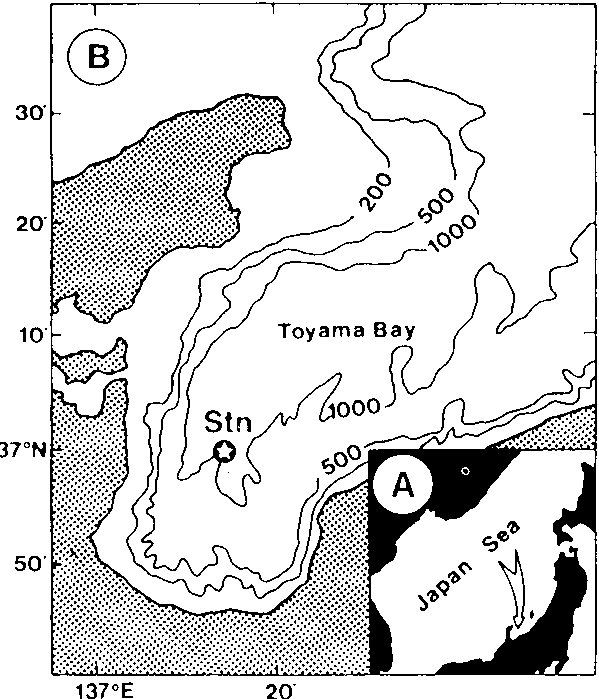
Figure 15. Vertical profiles of water temperature in the years when surface swarms of Euphausia pacifica were found (a) or not found (b), and when benthopelagic swarms were found (c) in Joban coastal waters (from Nakamura, 1992). The fishing grounds are indicated by the dotted area.
(a)
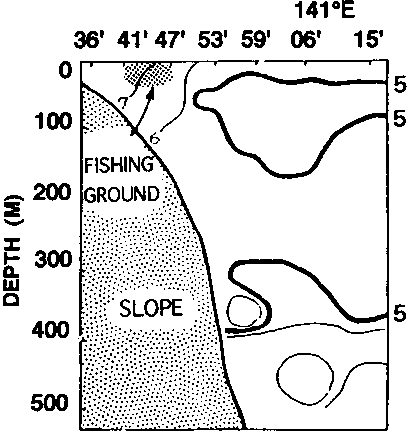
(b)
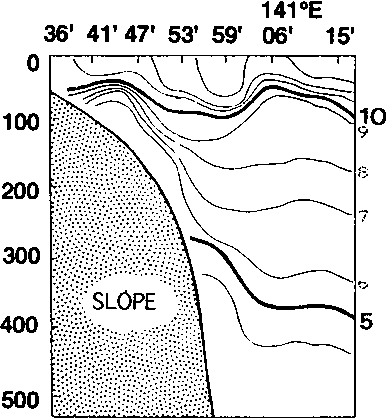
(c)
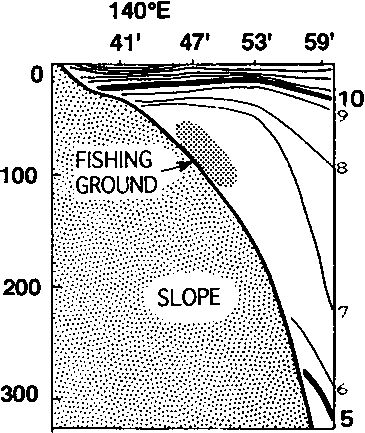
Figure 16. Location of sampling stations off Nakaminato, Ibaraki Prefecture where monthly investigations of benthopelagic populations of Euphausia pacifica have been conducted
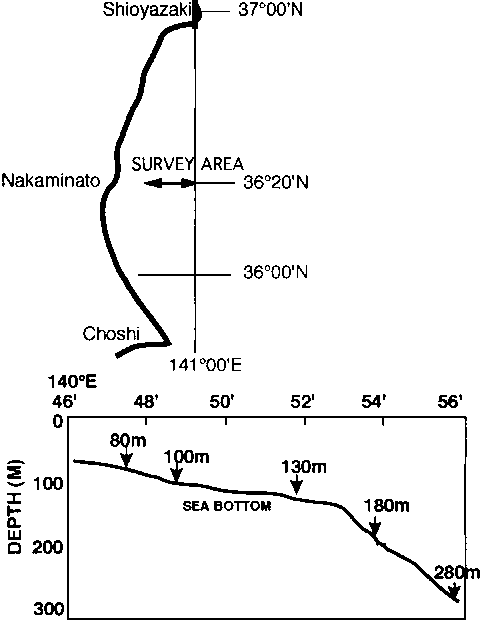
Figure 17. Relationship between the thickness (m) of the water mass < 9oC (m) and the catch of benthopelagic swarms of Euphausia pacifica (g) at three sampling depths (adapted from Nakamura, 1992)
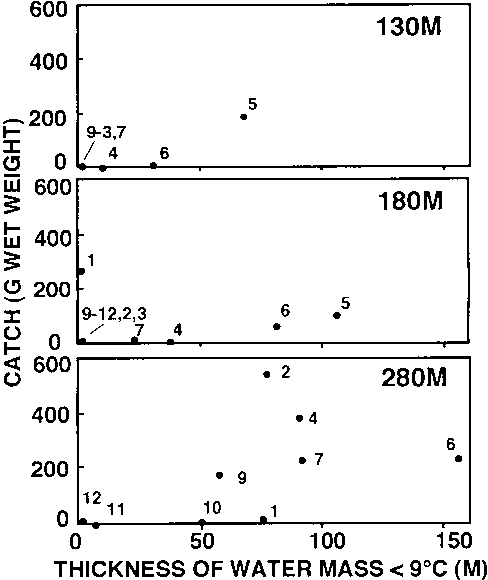
Figure 18. Map of Onagawa and adjacent areas
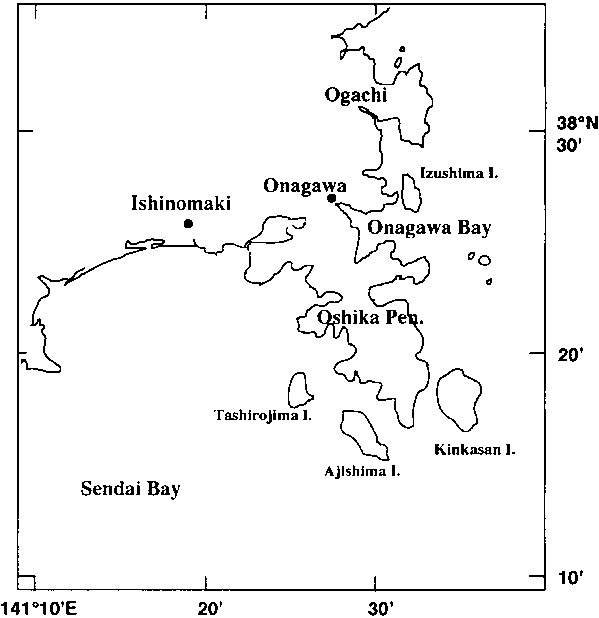
Figure 19. Main fishing periods for Euphausia pacifica in Miyagi, Fukushima and Ibaraki Prefectures in 1969-1989 (adapted from Odate, 1991)
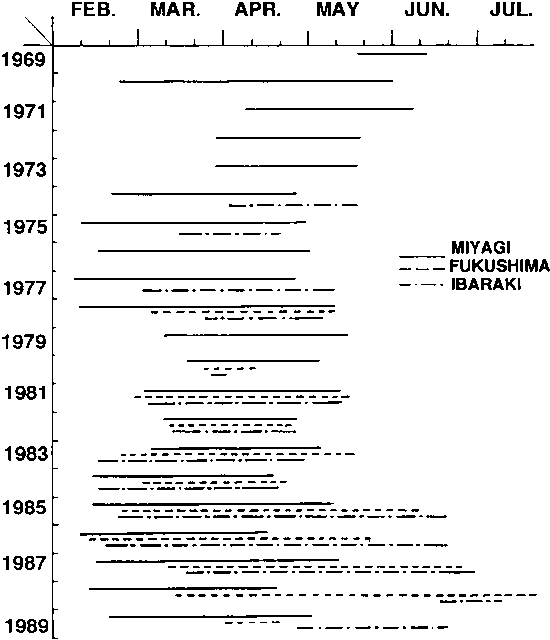
Figure 20. Fishing periods for Euphausia pacifica in 1984-1994. The upper line shows those in Onagawa (solid line) and Sanriku and Joban area (broken line) for each year. The main fishing period is shown in thick lines, the maximum CPUE by dots. (adapted from Kuroda and Kotani, 1994b)
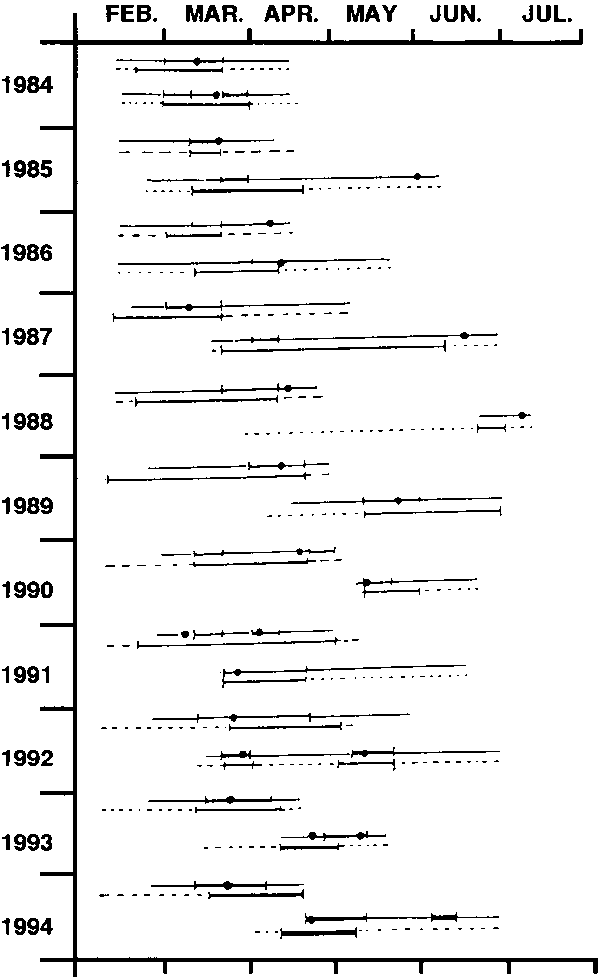
Figure 22. Relationship between the southernmost latitude of the coastal branch of the Oyashio Current (open circles) and the annual catch of Euphausia pacifica (solid circles) (adapted from Odate, 1991)
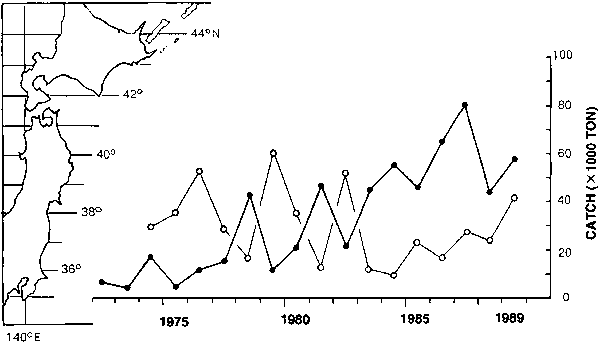
Figure 23. Relationship between the annual catch of Euphausia pacifica and the area of the water mass of < 5o C at 100 m from February to May, 1970-1978, between 35o and 42o N and west of 145o E expressed as the number of one degree latitude by one degree longitude squares covered (adapted from Odate, 1979)
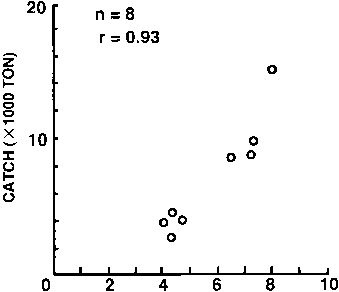
Figure 25. Location of the fishery for Euphausia pacifica in British Columbia
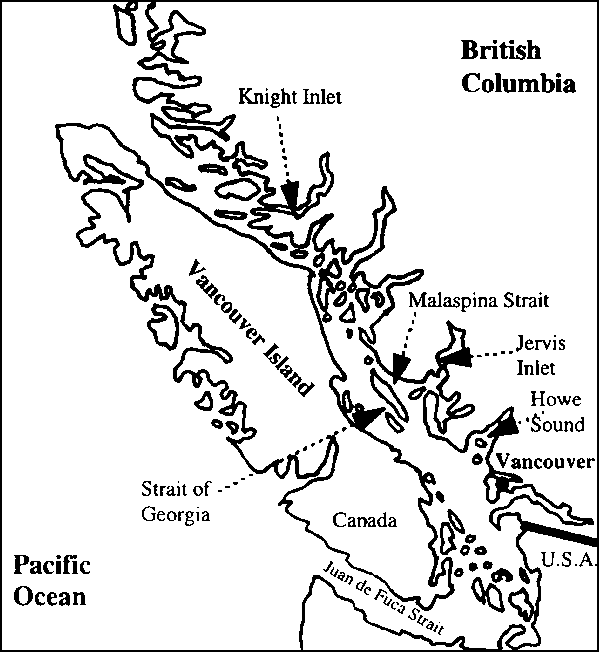
Figure 26. The annual catch of Euphausia pacifica off the west coast of Canada
Figure 28. Catch of Thysanoessa inermis off the western coast of Hokkaido, Japan
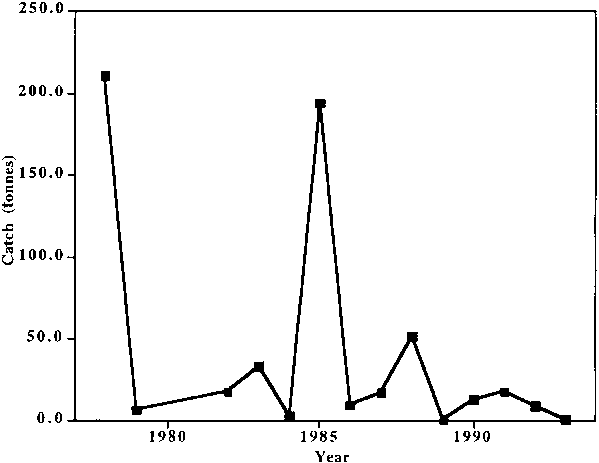
Figure 29. Map of the Uwajima Bay area, Ehime Prefecture where Euphausia nana is commercially exploited (adapted from Hirota and Kohno, 1992)
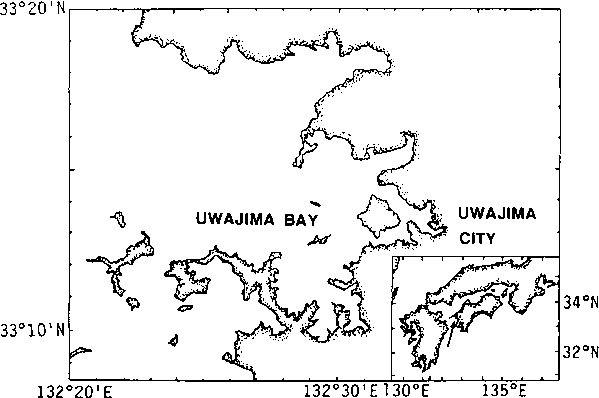
Figure 30. Distribution of Euphausia nana (adapted from Hirota and Kohno, 1992)
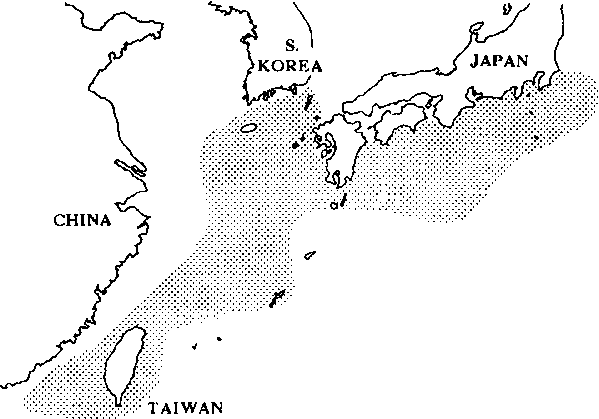
Figure 31. Annual catches of Euphausia nana in Uwajima Bay, Japan
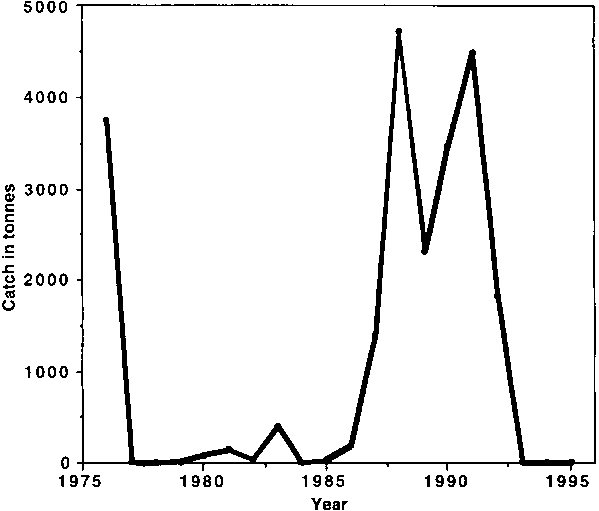
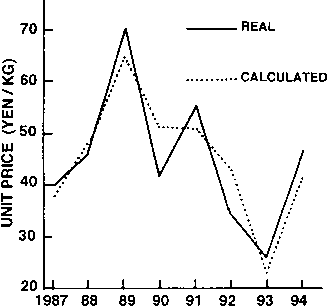
Figure 32. Real and calculated prices (yen per kg) of Euphausia pacifica landed in 1987-1994 (adapted from Yoshida, 1995)
