Recent Trends in Global

Aquaculture Production : 1984 - 1995

Krishen Rana

Fisheries Information, Data and Statistics Unit


INTRODUCTION

The growth of the aquaculture sector and its potential development, as well as changes in the fisheries sector as a whole, is closely monitored by the Food and Agricultural Organization (FAO), the only international agency to hold a global time series database on aquaculture and capture fisheries.

The potential of aquaculture to meet the challenges of food security and to generate employment and foreign exchange is clearly demonstrated by the rapid expansion of this sector which has grown at an average annual rate of almost 10% since 1984 compared with 3% for livestock meat and 1.6% for capture fisheries production. In the wake of this expansion, however, aquaculture, at times has been equated synonymously as shrimp farming and has recently been given a biased negative press both in peer reviewed articles and the popular press. Consequently, the relative importance and contribution to food security of the over 250 aquatic species farmed globally has been blurred.

What have the major production achievements from aquaculture been in the last few years?

In this commentary, the recent production of the major cultured species and the key features of recent developments in aquaculture production are reviewed to provide an overall perspective, based largely on data provided by countries to FAO.


The Contribution of Aquaculture to Total Aquatic Production

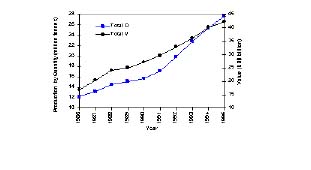
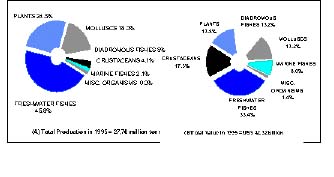
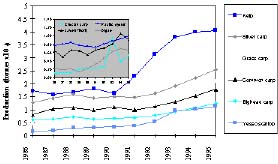
In recent years, the supply of fish has steadily increased and in 1995 total world production of finfish, crustaceans and molluscs from capture fisheries and aquaculture reached 112.9 million tonnes (t). The inclusion of plants to aquatic production raises the total production in 1995 by a further 7.8 million tonnes (t) to 120.7 million t, an increase of around 15.6 million t since 1989 (Figure 1).


Much of the increase in annual global aquatic production, however, is attributable to aquaculture. The actual annual share of aquaculture depends on whether aquatic plants are included or not. For cultured finfish and shellfish the annual contribution to total finfish and shellfish production rose linearly from 11.7% in 1989 to 18.5% in 1995 (Figure 1).

The annual growth rate of cultured finfish and shellfish production over the last 5 years increased from around 5 % over 1990-1991 to

UntiWMF6.JPG (11243 byte)

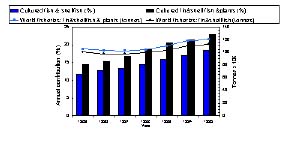
Figure 1. Contribution of aquaculture to annual global aquatic production

UntiWMF7.JPG (10349 byte)

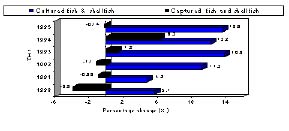
Figure 2. Rate of change over previous year


around 14% in 1994-1995. In contrast, with the exception of the increase in 1993-1994 which is probably attributable to small pelagics, data reported for capture fisheries show near zero or negative growth (Figure 2).

By 1995, the total production of cultured finfish, shellfish and aquatic plants which was valued at US$ 42.3 thousand million (billion) reached a record 27.8 million t, an increase of around 9.6% and 5.2% over 1994 production in quantity and value, respectively (Figure 3).

In keeping with recent trends, the increase over 1994 for finfish and shellfish averaged 13.6% and 7.4% for quantity and value, respectively. Much of the reported increase originated from the Low-Income Food-Deficit Countries (LIFDCs), in particular China, and reflects the continuing national trends of increased use of aquatic resource and management to further diversify production of species and technologies used.

Contribution of Aquaculture to Total National Aquatic Production in Principal Countries

Although the global contribution of aquaculture, by quantity, to total world aquatic production averaged 23% in 1995, the relative importance of aquaculture to national aquatic production varied greatly and ranged from 7-60% for the top 14 producing countries (Figure 4). In keeping with recent trends, the significance of aquaculture in terms of tonnage to national aquatic production in 1995 was greatest in China, accounting for 60% of total national production, nearly twice that of either France, India, Korean Republic or Philippines (Figure 4).

UntiWMF8.JPG (9174 byte)

Figure 3. Global trends in aquaculture production

UntiWMF9.JPG (11435 byte)

Figure 4. Contribution (%) of aquaculture to national aquatic production

UntWMF10.JPG (12118 byte)

Figure 5. Annual global changes in the total aquaculture production in LIFDC's


A considerably lower contribution to national aquatic production was reported by Thailand (13.2%), Norway (9.4%) and USA (7.2%) in 1995 (Figure 4-inset). Global production of aquaculture continues to be dominated by Asia, which in 1995 accounted for over 90% of world output. China, India and Japan accounted for 63.4, 5.8 and 5.1% of total world aquaculture, respectively (Figure 5). Contributions by other

major producers were lower, with Korea, Philippines, Indonesia and Thailand accounting for 3.7 (1 million t), 2.9 (0.8 million t), 2.6% (0.7 million t) and 1.7% (0.5 million t) of world total, respectively.

The ranking of the countries has changed over the last five years. Whilst the position of China (1st), Korea (4th), Philippines (5th),


UntWMF11.JPG (8330 byte)

Figure 6. Contribution of the top 5-6 countries total (A) finfish and shellfish and (B) finfish, shellfish and aquatic plant production within LIFDCs

UntWMF12.JPG (13340 byte)

Figure 7. Contribution of key environments to global aquatic production

UntWMF13.JPG (8902 byte)

Figure 8. Reported use of world marine environment for (A) total aquatic and (B) finfish and mollusc production in 1995

UntWMF14.JPG (5902 byte)

Figure 9. Global use of (A) brackish water and (B) freshwater environment for the production of major groups of aquatic organisms

Indonesia (6th) remained unchanged since 1991, India replaced Japan as 2nd and Thailand displaced USA to take the 7th position in 1995. Although a few developed countries feature amongst top producers (Figure 5), aquaculture production is predominately an activity in the LIFDCs (Figure 5).

By 1995, 21.6 million tonnes, or around 78%, of world total finfish, shellfish and aquatic plant production originated from LIFDCs. The growth rate of the aquaculture sector within LIFDC's between 1984 and 1995 was nearly six times faster than that for non-LIFDCs.

Aquaculture production within the 67 reporting LIFDCs, however, is greatly skewed. Around 98.5 % of all aquatic production within LIFDCs originated from just six countries with China accounting for around 82% (Figure 6). In addition, since the overall average annual growth rate is greatly influenced by the rapid expansion of aquaculture in China, the rate of expansion of the sector within the LIFDCs as a whole is distorted. Between 1984 and 1995 Chinese aquaculture expanded at a average annual rate of 13.6%/yr. In contrast, when China is excluded, the equivalent average annual growth rate for all the other LIFDCs countries was only 5%. In 1995, total aquaculture production from within LIFDCs excluding China was only 4.0 million tonnes an increase of 1.7 million tonnes since 1984 (Figure 5). Whilst showing potential for expansion, this slow growth rate within the LIFDCs is likely to be due to a combination of reasons. Amongst others these may include countries being landlocked, low national priority of aquaculture, small and inappropriate coastline, limited and lack of adequate water supply, poor infrastructure and limited capacity of institutions and technical and financial constraints.


Reported Use of Culture Environments for Aquaculture Production1

Although the controversy on the merits and use of coastal lands for aquaculture continues, data reported to FAO on the global pattern of environment used for culture suggests that aquacultural output from brackish water environments has only increased by 2.6%/yr. in the last five years, compared with an annual average increase of 10.8% and 10.6% for freshwater and marine environments.

In 1995, brackish water environments accounted for only 5.4% and 16.6% of total aquatic production by quantity and value, respectively, compared with around 47% by quantity and 41-42% by value from each of freshwater and marine environments (Figure 7).

Moreover, when aquatic plants are excluded from total aquaculture production, the contribution of finfish and shellfish from freshwater environments continues to dominate output and in 1995 accounted for around 63% of the total tonnage of cultured finfish and shellfish By contrast, culture from brackish and marine environments contributed only 7.1 and 30%, respectively.

The proportion of total aquaculture production by weight and value originating from marine waters is high (Figure 7). The reported data, however, suggest that over 90% of mariculture production is centered around primary users of nutrients (i.e. aquatic plants and filter feeding invertebrates) and only 8% for mainly carnivorous finfish species and 1% for crustaceans (Figure 9-A). When only aquatic animals are considered, around 82% of the production, is accounted for by filter feeding shellfish, and only 17% by mainly carnivorous finfish and only

2% of production from mariculture by crustaceans (Figure 8). In addition to the above groups generating nearly US$ 18 billion in 1995, the predominant use of aquatic plants and filter feeders in mariculture may also contribute to minimizing the levels of nutrient enrichment of coastal waters resulting from agriculture and other human activities.

The world brackish water environment is being used to produce a diverse range of aquatic products (Figure 10-A). Although crustaceans, mainly prawns, acounted for 55% of the production fom brackish waters in 1995, 44% of production was attributable to finfish such as the redfishes, tilapias, various diadromous fishes and molluscs. In contrast, the freshwater bodies were used predominantly to produce low value freshwater species such as carps and tilapias (Figure 9).

Major Reported Culture Groups and Species of Aquatic Organisms

The contribution of major culture groups to aquaculture in 1995 was similar to that in 1994. Production of finfishes continues to be the dominant global aquaculture activity

in 1995, accounting for about 53% by weight and 55% by value (Figure 10).

As in previous years, freshwater finfishes, in particular the Chinese and Indian carps, accounted for the greatest share (45.6%) of total aquaculture production. Although higher in value, the diadromous and marine finfishes collectively accounted for only 7% of total weight. Aquatic plants on the other hand, which were valued at nearly US$ 6 billion, contributed a quarter of total production. As in 1994, crustaceans, whilst only accounting for 4.1% of total aquatic tonnage, were the second most important cultured group accounting for 17.3% of total value (Figure 10).

Recent Developments of Reported Production of Cultured Species and Species Groups

The overall trend of diversifying the number of cultured species and simultaneously increasing the production of mainstream species continued in 1995. The actual number of species utilized for aquaculture may in fact be considerably higher than reported. This is evident from the rapidly growing and undesirable practice of


UntWMF15.JPG (14086 byte)

Figure 10. Production in (A) tonnage and (B) value of major cultured groups of aquatic organisms in 1995


UntWMF16.JPG (11205 byte)

Figure 11. Log frequency distribution for species or species items reported in 1995. Grouped by global production size classes (all entries above one tonne)

UntWMF17.JPG (14879 byte)

Figure 12. Global trends in farmed production of major aquatic species (insert with same units)


monodon was ranked 14th in 1995 (Table 2). In addition, the production of P. vannamei, and P. chinensis, which are predominantly cultured in Ecuador and China, respectively, were ranked 39th and 42nd (Table 2).

A few notable major changes could be discerned between 1994-1995 from the data on aquaculture production collated by ISSCAAP groups. These include an increase of 250% in the total production of turtles (ISSCAAP group no 72) from 5,440 t in 1994 to over 19,079 t. Similarly, the total production of sea spiders and crabs and the miscellaneous marine molluscs groups reported in 1995 increased by 97% and 196%, respectively, compared with 1994. The vast majority of all these increases were attributable to Chinese aquaculture. Chinese production of freshwater turtles, Trionyx spp, rose from 4,400 to 17,500 t and the reporting of unclassified marine crabs and unclassified marine molluscs rose from 10,000 to 48,000 t and 188,000 to 559,000 t, respectively.

Although the overall global production of total finfish and shellfish, has increased by 13.6% between 1994 and 1995, this conceals changes and often declines in national production. Thailand's aquaculture output, for example, declined from 514,000 t in 1994 to 464,000 t in 1995, an overall decrease of 9.7%, mainly of freshwater species. This was mainly due to a 80-90% reduction in reported production of Cyprinus carpio (common carp) and Hypophthalmichthys molitrix (silver carp), a 68% drop in Labeo rohita (rohu), a 40-50% decline in Puntius gonionotus (silver barb), Pangasius pangasius (pangas catfish), Macrobrachiium rosenbergii (giant river prawn) and Oreochromis niloticus (Nile tilapia). These large

reporting unclassified species to FAO.

Of the 300 plus cultured species or species groups that have been reported to FAO since 1984, just over 250 were reported in 1995. Moreover, the world contribution of each species or species group to overall production is far from uniform (Figure 11). In 1995, 65% of all reported species or species groups contributed up to 10,000 t each to global production. Only 32 species contributed between 100,000 and 1 million t and just eight over 1 million t each (Figure 11). The highest rate of growth and reported global production of cultured aquatic organisms for 1995 was the kelp, Laminaria japonica, totalling just over 4 million tonnes (Table 1). Moreover, three of the top ten

aquatic species produced are plants (Figure 13).

Apart from the unknown composition of the unclassified finfishes, all the above species for 1995 and those of the top 10 over the last decade represent organisms low in the food web, i.e. they are either filter feeders, herbivore/ omnivores or plants (Figure 13).

The ranking of the top eight species in 1995 showed little change over the last decade and the ranking of the top 4 species remained unchanged over the last five years (Figure 12). Although highest in value, the production of shrimps and prawns, in terms of tonnage, does not feature amongst the top dozen or so farmed aquatic species. In fact the major species of cultured prawns, Penaeus


decreases, however, were somewhat offset by a 66% increase in production of the green mussel, Mytilus smaragdinus, from 26,000 t in 1994 to 43,500 t in 1995 and a modest rise of 13,000 t or 5% of Penaeus monodon. Other countries reporting noticeable decline in production of finfish and shellfish in the same period included the Philippines, Spain, Netherlands, Faeroe Islands and Japan.

Opportunities for diversification and culturing new species to exploit new national and international markets were also evident from several first time reports of species and rapid increase in production of selected species by countries in 1995. This was most evident in China which reported for the first time, the production of 37,500 t of mandarin fish, Siniperca chuatsi, a carnivorous freshwater perch-like fish which is widely distributed in Chinese reservoirs.

In addition, the reported production of the river crab, Eriocheir sinensis, has increased 4-5 fold in the last five years to 42,000 t in 1995.

Although the production of freshwater turtles, Trionyx spp., was reported for the first time in 1994 (4,400 t), a more significant production of 17,500 t was reported in 1995.

Countries in Europe also reported the production of new species in 1995 for the first time. France reported 197 t of the Japanese carpet shell, Ruditapes philippinarum and Germany 1,200 t of unclassified clams. In addition, the UK and Russian Federation reported 120 and 100 t of the Mozambique tilapia, O. mossambicus and channel catfish, Ictalurus punctatus, respectively.

Rana1.jpg (14543 byte)

Table 2: Production and ranking of penaeid species in 1995. Ranking based on all aquatic species and species groups reported for 1995.

Rana2.jpg (23783 byte)


1For purposes of this article, freshwater culture is the cultivation of aquatic organisms where the end product is raised in freshwater; earlier stages of the life cycle of these species may be spent in brackish or marine waters. Mariculture is the cultivation of the end in sea water; earlier stages in the life cycle of these aquatic organisms may be spent in brackishwater or freshwater. Brackishwater culture is the cultivation of aquatic organisms where the end product is raised in brackishwater; earlier stages of the life cycle of these species may be spent in fresh or marine waters. Brackishwaters are characterized by large seasonal fluctuations in salinity.


The author thanks David Ardill, Richard Grainger, Albert Tacon, Maurizio Perotti and Anton Immink for their helpful comments and suggestions.

1 E-Mail address: [email protected]