![]()
![]()
![]()
The efficiency of the environmentally sound harvesting system applied by Precious Woods in their F2M project and that of the traditional system as generally used in the Amazon-region have been investigated with work and time studies analysing the work performance of the operations.
Work and time studies were done in accordance with the forest work study nomenclature (IUFRO 1995). The study methodology used for all time studies conducted during felling and extraction activities was cumulative timing exclusively, with the time for each work element subsequently obtained by subtraction.
Although the machine operator was studied independent of other harvesting activities, information on the other crew members was collected to support the analysis of time consumption and interpretation of time distribution of work elements.
The environmental impacts of harvesting operations were investigated by a postharvest assessment of soil disturbance, damage to residual vegetation, and canopy gaps. This assessment was done for both the environmentally sound harvesting system and the traditional harvest system. For details see chapters with corresponding headings.
Cutting comprises a set of activities undertaken to fell standing trees and prepare them for extraction. Extraction is defined as the process of moving trees or logs from the felling site to a landing or a roadside where they will be processed into logs or consolidated into larger loads for transport to the processing facility or other final destination (Dykstra & Heinrich 1996).
Depending on the harvesting system applied, these activities vary with respect to their frequency of occurrence. Nevertheless, a sequence of regular work elements can be found for the felling operation that constitutes the work cycle. Work cycle is defined as a sequence of work repeatedly applied to every work object (IUFRO 1995). A work element is considered a sub-division of a given work task and is limited by break points. Depending on the occurrence in every work cycle, a work element can be considered as a repetitive or an occasional element.
Only workplace time, which is defined as the portion of the total time that a production system or part of a production system is engaged in a specific work task (IUFRO 1995), has been considered in estimating production rates and costs. Although meal time is part of the workplace time, it has been excluded from estimations, since its frequency of occurrence differed during observation of harvesting activities.
Table 7 shows the structure of work time elements that occur during time studies.
Table 7. Structure of Workplace Time (WP) concepts
Work Time (WT) |
Productive Work Time (PW) |
Main Work Time (MW) |
||
Complementary Work (CW) |
||||
Supportive Work |
Preparatory Time (PT) |
Relocation Time (RL) |
||
Time (SW) |
Operational Preparatory Time (OP) |
|||
Service Time (ST) |
Repair Time (RT) |
|||
Maintenance Time (MT) |
||||
Refuel Time (RF) |
||||
Ancillary Work Time (AW) |
||||
Non-Work Time (NT) |
Work-Related |
Meal Time (ME) |
||
Delay Time (WD) |
Rest and Personal |
|||
Time (RP) |
||||
Interference Time (IT) |
The classification and the percentage of workplace time consumption excluding meal time observed for each work element in felling operations, whether in the environmentally sound forest harvesting system or in the traditional logging system, can be found in Appendix 2. Data on the time studies on felling operations are stated below for both systems:
subject of observation |
environmentally sound forest harvesting system B/G09 |
traditional logging system B/F09 |
||
Work time |
17 h 15 min |
13 h 34 min |
||
|
Non-work time |
40 min |
26 min |
||
|
Workplace time |
17 h 55 min |
14 h 00 min |
||
|
trees felled |
44 |
43 |
||
|
trees only bucked* |
6 |
2 |
||
|
trees harvested |
50 |
45 |
||
|
trees rejected |
19 |
2 |
||
|
utilisable volume |
353.90 m³ |
250.81 m³ |
||
|
volume/tree |
7.08 m³ |
5.57 m³ |
||
*) B/G09: trees felled during opening of skid trail
B/F09: trees knocked down by felling of neighbouring tree
Note: Workplace time excluding meal time
On average the time required per tree harvested was 24.43 minutes in the environmentally sound forest harvesting system and 18.66 minutes in the traditional logging system. The time required per tree harvested serves as the basis for estimating production rates, treated in chapter 7.2, and is to be distinguished from the time required to fell a single tree, stated in Table 8 for both systems.
In order to compare time distribution of work elements and time required for the felling of a single tree in both systems, the time used per tree rejected and the time used for the bucking of trees that had already been felled during skid trail opening or that had been knocked down by the felling of a neighbouring tree have been excluded from calculations on this matter. The average time of work elements required to accomplish the felling of a single tree and their time distribution is shown in Table 8.
Table 8. Comparison of tree felling in both systems
|
work elements (classification) |
environmentally sound forest harvesting system B/G09 |
traditional logging system B/F09 | |||||
|
[min] |
% |
[min] |
% | ||||
|
Felling |
(MW) |
8.74 |
40.81 |
6.30 |
35.83 | ||
|
Bucking and delimbing |
(MW) |
4.92 |
22.98 |
5.07 |
28.81 | ||
|
Location of tree |
(CW) |
2.13 |
9.96 |
1.13 |
6.41 | ||
|
Felling preparations |
(CW) |
3.52 |
16.42 |
1.71 |
9.71 | ||
|
Productive work time |
(PW) |
19.31 |
90.17 |
14.21 |
80.76 | ||
|
Other saw |
(RL) |
0.06 |
0.26 |
0.15 |
0.85 | ||
|
Consideration |
(OP) |
0.25 |
1.17 |
0.24 |
1.38 | ||
|
Repair time |
(RT) |
0.33 |
1.56 |
0.18 |
1.02 | ||
|
Maintenance time |
(MT) |
0.26 |
1.23 |
0.57 |
3.22 | ||
|
Refuel time |
(RF) |
0.32 |
1.49 |
0.63 |
3.59 | ||
|
Site clearing |
(AW) |
0.20 |
0.92 |
0.58 |
3.33 | ||
|
Skid trail clearing |
(AW) |
0.31 |
1.45 |
--- |
--- | ||
|
Cut free saw |
(AW) |
0.37 |
1.75 |
1.03 |
5.85 | ||
|
Supportive work time |
(SW) |
2.10 |
9.83 |
3.38 |
19.24 | ||
|
Time required for felling a single tree |
21.41 |
100.00 |
17.59 |
100.00 | |||
The comparison of the time distribution of work elements that occurred in felling a single tree with both systems reveals the following:
|
· time spent on felling in the environmentally sound forest harvesting system is higher since it is more difficult to direct a tree being felled than to fell a tree in the direction of its natural lean, even if proper directional felling techniques are applied and wedges are used; |
||
|
· improper cutting techniques result in a higher share of time spent on bucking and delimbing in the traditional logging system; |
||
|
· use of improper felling techniques is also indicated by the time spent on supportive work, namely cutting free the chainsaw, which was more than three times higher than in the environmentally sound forest harvesting system; |
||
|
· time spent on clearing the site of branches from the crowns of previously felled trees in order to facilitate bucking and delimbing was more than three times higher due to the lack of proper felling techniques, which enable a planned alignment of trees; |
||
|
· felling preparations were restricted to the removal of underbrush and palms in the traditional logging system, whereas in the environmentally sound harvesting system felling preparations also included bark removal at the height of the felling cut as well as the time for determination of the best felling direction. Bark removal at the height of the felling cut will increase the longevity of the chain and the chainsaw in general.
|
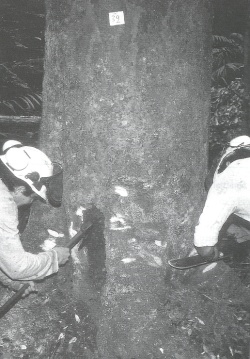
Photo 17. Felling preparations - bark removal at the height of the felling cut
The classification and the percentage of workplace time consumption excluding meal time observed for each single work element in extraction operations can be found for the environmentally sound forest harvesting system in Appendix 3, for the traditional logging system in Appendix 4. Information on the time studies carried out on extraction operations are stated below for both systems:
|
subject of observation |
environmentally sound forest harvesting system B/G09 |
traditional logging system B/F09 |
||
|
Pre-skidding |
||||
|
Work time |
10 h 48 min |
|||
|
Non-work time |
47 min |
|||
|
Workplace time |
11 h 35 min |
|||
|
logs winched |
69 |
|||
|
logs only handled |
6 |
|||
|
utilisable volume |
359.73 m³ |
|||
|
volume/load |
4.80 m³ |
|||
|
Skidding |
||||
|
Work time |
5 h 21 min |
7 h 19 min |
||
|
Non-work time |
16 min |
6 min |
||
|
Workplace time |
5 h 37 min |
7 h 25 min |
||
|
logs skidded |
79 |
43 |
||
|
utilisable volume |
367.83 m³ |
184.63 m³ |
||
|
volume/load |
4.66 m³ |
4.29 m³ |
The figure for concentrated utilisable volume differs from that of skidded utilisable volume since four logs were neither winched nor handled by the crawler tractor due to already correct alignment with respect to the skidding route.
The figures for utilisable volume extracted from cutting unit B/G09 differ from that given for the utilisable volume felled since four trees were felled after completion of the particular felling operation observed during the establishment of the landing.
In case of cutting unit B/F09, the figures for volume felled and volume extracted differ since the sample of trees observed during felling and extraction operations was not exactly the same due to the simultaneous use of two Cat wheeled skidders on the area under examination.
Since productivity is defined as the rate of product output per time unit for a given production system, the production rates of a studied system can easily be estimated if time studies combined with measurements of the output of production have been completed.
The estimated production rates for felling operations in both systems are based on the total time used to provide a certain volume of timber, regardless of whether a particular tree has been felled or rejected. Volume per tree harvested has been calculated by multiplying the average cross-sectional area of the stem by the stem length measured at the felling site. The cross-sectional area is based on diameter measurements, including bark, made at each end of the stem at the felling site. Time calculations are based on workplace time excluding meal time.
Table 9. Estimated felling production rates
|
method cutting unit |
number of observations |
volume per tree felled [m³] |
time required per tree [min] |
productivity [m³/h] |
|
environmentally sound |
||||
|
forest harvesting system |
50 |
7.08 |
21.50 |
19.76 |
|
B/G09 |
||||
|
traditional |
||||
|
logging system |
45 |
5.57 |
18.67 |
17.92 |
|
B/F09 |
||||
Note: 1) volume per tree felled refers to utilisable volume including bark
2) productivity in terms of utilisable volume (including bark) per hour of workplace time
(excluding meal time)
The average utilisable volume per tree felled in cutting unit B/G09 is considerably higher than that in cutting unit B/F09. This is mainly caused by the fact that in the environmentally sound forest harvesting system only the most mature trees of commercial interest are selected to be felled, whereas in the traditional logging system all commercial tree species with dbh above the threshold value of 50 cm are removed.
The comparatively high utilisable volume per tree felled as a feature of the environmentally sound forest harvesting system makes this system more favourable than the traditional logging system with respect to the felling production rates.
Based on the hourly productivity found by the studies and an effective workplace time excluding lunch break of 7 hours per day, the average production rate amounted to 134-141 m³ per
felling crew per day for the environmentally sound forest harvesting system, which is 19-20 felled trees/crew/day.
The corresponding figures on the average production rate of a felling crew using the traditional logging system were 123-128 m³ per day, which is 22-23 felled trees/crew/day.
The estimated production rates for extraction operations in both systems are based on the total time used to provide a certain volume of timber, regardless of whether a particular tree has been concentrated to the skid trail or was already lying along the skid trail. Volume per load has been calculated by multiplying the average cross-sectional area of the stem by the stem length. If the stem to be extracted had to be cut into pieces, the cross-sectional area is based on diameter measurements, including bark, made at each end of the log at the landing site. Time calculations are based on workplace time excluding meal time.
Table 10. Estimated extraction production rates
|
method cutting unit |
number of observations |
volume per load [m³] |
time required per log [min] |
productivity [m³/h] |
|
environmentally sound |
||||
|
forest harvesting system B/G09 |
||||
|
pre-skidding phase |
75 |
4.80 |
9.27 |
31.04 |
|
skidding phase |
79 |
4.66 |
4.27 |
65.53 |
|
traditional |
||||
|
logging system |
43 |
4.29 |
10.35 |
24.90 |
|
B/F09 |
||||
Note: 1) volume per load refers to utilisable volume including bark
2) productivity in terms of utilisable volume (including bark) per hour of workplace time
(excluding meal time)
Based on the hourly productivity found by the studies and an effective workplace time excluding lunch break of 7 hours per day, the average production rate for pre-skidding amounted to 216-221 m³ per pre-skidding crew per day in the environmentally sound forest harvesting system, which is 45-46 logs/crew/day. The corresponding figures for the average production rate for the skidding phase were 457-461 m³ per skidding crew per day, which is 98-99 logs/crew/day.
With the same effective workplace time per day, the average production rate for skidding with the traditional logging system amounted to 172-176 m³ per skidding crew per day, which is 40-41 logs/crew/day.
Since in both systems the same operator was operating the wheeled skidder the estimated production rates are comparable for both systems. However, as the operator in question had two years' experience, his production rate was above that to be expected from a less skilled operator.
In order to allow a comparison with the traditional logging system, a derived productivity per hour of workplace time for extraction has been calculated for the environmentally sound forest harvesting system and amounts to 20.96 m³/h. This figure on extraction productivity is derived by multiplying the average volume per load by the sum of time required per log in both phases of extraction. The extraction production rate amounts to 146-151 m³ per day, which is 31-32 logs/day. Considering this daily production rate for extraction in the environmentally sound forest harvesting system, one has to keep in mind that it is a derived figure since pre-skidding and skidding are never carried out simultaneously within a cutting unit.

Photo 18. High extraction productivity since only the most mature trees are harvested in the environmentally sound forest harvesting system
The estimation of production costs is based on the productivity for harvesting operations stated in previous chapters and the hourly costs for the harvesting workforce and equipment involved in harvesting activities. The hourly cost estimates are based upon information obtained from the company.
Table 11 shows the share of costs for each activity carried out in timber harvesting with both systems. For the environmentally sound forest harvesting system the cost effects of the planned changes concerning the felling and pre-skidding crews, stated in chapter 3.3 and 3.4.1, are considered as well.
Table 11. Estimated cost distribution of harvesting activities
|
Harvesting |
environmentally sound forest harvesting system B/G09 |
traditional timber harvesting system B/F09 | |||||||||
|
Activities |
actual |
planned |
|||||||||
|
productivity [m³/h] |
production cost [%] |
productivity[m³/h] |
production cost [%] |
productivity[m³/h] |
production cost [%] | ||||||
|
Commercial inventory |
15 |
16 |
|||||||||
|
Forest road |
24 |
26 |
27 | ||||||||
|
Road maintenance |
6 |
7 |
|||||||||
|
Trail pre-opening |
4 |
3 |
|||||||||
|
Felling |
19.76 |
12 |
19.76 |
9 |
17.92 |
10 | |||||
|
Pre-skidding |
31.04 |
29 |
31.04 |
28 |
|||||||
|
Skidding |
65.53 |
10 |
65.53 |
11 |
24.90 |
63 | |||||
|
Total |
10.20 |
100 |
10.20 |
100 |
10.42 |
100 | |||||
|
Note: |
Pre-opening of skid trails within a cutting unit is carried out by the felling crew prior to the felling of trees selected to be harvested. During the pre-opening of the skid trails all trees will be removed which might cause problems to the crawler tractor, and so delay the work's progress. Time required and costs for opening the skid trails of a cutting unit are included in the figures for the pre-skidding operation. The figures on the systems' productivity are derived figures since harvesting activities are never carried out simultaneously within a cutting unit. |
Referring to the costs of the traditional logging system per cubic metre of saw log at landing site as the basis of 100%, the costs of the environmentally sound forest harvesting system, as applied at the time when the study was carried out, come to 109% and would amount to 101.5% if the environmentally sound forest harvesting system had been carried out according to the planned changes.
Since an estimate of the damage to residual trees and regeneration caused by the harvesting operations is of particular interest for the development of sustainable harvesting technologies, emphasis was given to a comprehensive postharvest assessment, which will provide information on short-term changes in stand structure due to harvesting operations. The results might also be indicative for the medium-term future crop and might give an idea of conditions for establishment of regeneration of the areas under review.
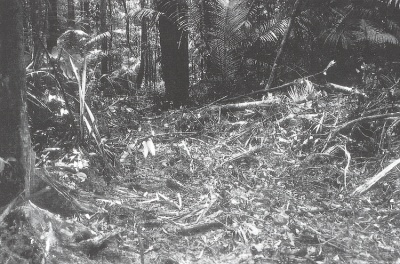
Photo 19. Postharvest assessment provides feedback about the quality of the harvesting operations
Unless the forest is left in a condition that will permit the attainment of a desired future condition, sustainability cannot be assured (Dykstra & Heinrich 1996). Therefore, harvesting assessments are an essential requirement of sustainable forest management since they provide feedback about the quality of the harvesting operations.
In order to obtain information on damage to residual trees of commercial interest, namely PCTs, stem, and crown damages due to harvesting operations have been recorded and evaluated for each PCT on subplot B/G09 and subplot B/F09.
To separate damages according to their cause, the potential crop inventory was undertaken three times:
|
· |
prior to felling |
since stem and crown damages also occur in primary forests when overmature trees break down; |
|
|
· |
after felling |
in order to check the effectiveness of proper felling techniques and directional felling; |
|
|
· |
after skidding |
this is considered to be the phase where damages most often occur through negligence, ignorance, or carelessness rather than unavoidable circumstances. |
Stem (bark and cambium wounds) and crown damages were ocularly estimated and recorded according to the following classes:
|
classification |
crown damage |
stem damage |
||||||
|
Class I |
slightly damaged |
up to 1/3 crown volume damaged |
some spots where bark is removed |
|||||
|
Class II |
seriously damaged |
more than 1/3 crown volume damaged |
major parts of bark removed (up to 1/3 of girth) |
|||||
|
Class III |
almost killed / killed |
only few branches left / no branches left |
tree is not expected to survive / stem broken |
|||||
Table 12. Stand characteristics prior to and after harvesting
|
commercial trees > 50 cm dbh |
potential crop trees (PCT) | |||||||||
|
study area |
||||||||||
|
volume [m³] |
% |
trees |
% |
volume [m³] |
% |
trees |
% | |||
|
subplot B/G09 |
||||||||||
|
prior to harvesting |
322.4 |
100.0 |
61 |
100.0 |
151.8 |
100.0 |
113 |
100.0 | ||
|
removed by harvesting |
86.7 |
26.9 |
10 |
16.4 |
4.2 |
2.7 |
3 |
2.6 | ||
|
after harvesting |
235.7 |
73.1 |
51 |
83.6 |
147.6 |
97.3 |
110 |
97.4 | ||
|
subplot B/F09 |
||||||||||
|
prior to harvesting |
326.6 |
100.0 |
67 |
100.0 |
179.7 |
100.0 |
130 |
100.0 | ||
|
removed by harvesting |
257.8 |
78.9 |
52 |
77.6 |
--- |
--- |
--- |
--- | ||
|
after harvesting |
68.8 |
21.1 |
15 |
22.4 |
179.7 |
100.0 |
130 |
100.0 | ||
Since only PCTs were examined, the inventory on felling and skidding damages is a medium-term assessment only, the results stated below might nevertheless be indicative for the future commercial value of the area under review.
Detailed information on all classes of stem and crown damage to PCTs and residual commercial trees can be found in Appendix 5; whereas Table 13 shows only severe damage to PCTs due either to natural causes or to harvesting comprising the classes II and III of stem and crown damage.
Table 13. Natural and harvesting damages to Potential Crop Trees
|
environmentally sound forest |
traditional logging system | |||
|
Potential Future Crop |
harvesting system - subplot B/G09 |
subplot B/F09 | ||
|
number |
% |
number |
% | |
|
PCTs tallied |
113 |
100.0 |
130 |
100.0 |
|
damaged PCTs prior felling |
4 |
3.5 |
1 |
0.8 |
|
damaged PCTs after felling |
26 |
23.0 |
43 |
33.1 |
|
damaged PCTs after skidding |
29 |
25.7 |
68 |
52.3 |
|
PCTs without severe damage |
84 |
74.3 |
62 |
47.7 |
|
Natural damage |
4 |
3.5 |
1 |
0.8 |
|
Harvesting damage |
25 |
22.2 |
67 |
51.5 |
|
PCTs harvested |
3 |
2.6 |
--- |
--- |
|
PCTs remaining |
81 |
71.7 |
62 |
47.7 |
Severe harvesting damage to PCTs was more than two times higher in cutting unit B/F09, harvested in the traditional way, than in cutting unit B/G09. The directional felling emphasis was given to the correct alignment of the tree stems with respect to extraction routes rather than to PCTs and regeneration. A deviation of actual felling direction from that proposed was found in about 40% of trees felled. Damage to PCTs caused by extraction was reduced to about 1/10 of the total harvesting damage occurring in cutting unit B/G09, whereas about 1/3 of harvesting damage in cutting unit B/F09 was caused by extraction.
The figures in Table 13 reveal that proper felling techniques in combination with directional felling will reduce but not eliminate felling damage.
It is noteworthy that the natural damage in cutting unit B/G09 was about the same as the damage caused by extraction.
The figures found in the literature on logging damage in natural tropical forests as in Verissimo et al. (1992) and Scharai-Rad et al. (1997) are difficult to compare with those stated in Table 13. The reason is that either the selection criteria for trees that served as the basis for further calculation were different or the damage indices used in the papers mentioned are considered inappropriate for a comparison of different systems.
Damage indices like `trees damaged per tree extracted' might be useful for comparison between extraction crews using the same system, whereas applied in the case under review they are unable to reflect the actual conditions. This index value for environmentally sound forest harvesting would be more than twice as high as in traditional logging.
In general, it is recommended that postharvest assessments be carried out 8 to 12 months after harvesting operations have been completed (Dykstra & Heinrich 1996). This would include a full rainy season, so that sufficient time has elapsed for major impacts to appear. Therefore, cutting unit F03 and G03 in compartment A2 Block 308/9672 harvested in July/August 1995, referred to here as cutting unit A2/F03 and cutting unit A2/G03, were chosen. Another advantage of selecting these cutting units was that access to cutting unit A2/F03 was only provided by a skid trail that had already served for skidding logs from cutting unit A2/G03. Impacts on regeneration due to soil compaction should be more likely to appear on that skid trail with a higher number of skidder passes.
Regeneration on skid trails
Regeneration on skid trails was investigated by an inventory of 2 m wide strips across the trail at 30 m intervals. Particular attention was paid to the fact that a skid trail normally consists of sidestrips, ruts, and the middle part. Therefore, distribution of regeneration may vary across a skid trail. A subdivided strip of 4 m x 2 m enabled coverage of all three soil conditions. All skid trails were oriented east-west.
All seedlings and saplings greater or equal to 10 cm tall in the plots were identified, tallied, and recorded. Tree species of commercial interest, given present-day criteria, were recorded separately; other plants were grouped by trees and by vines.
Regarding the total number of woody plants per m², Verissimo et al. (1992) found 5.6 plants greater or equal to 1 m tall per m² in abandoned skid trails 2 years following logging. Assuming these plants greater than 1 m tall as the ones that were already established during the first year after logging, the findings of the skid trail inventory (see Table 14) agree with Verissimo et al. (1992).
Table 14. Regeneration on skid trails in cutting unit A2/F03 and A2/G03
|
average from 36 plots |
side strip |
rut left |
middle part |
rut right |
side strip |
plot |
|
[0.8mx2m] |
[0.7mx2m] |
[1mx2m] |
[0.7mx2m] |
[0.8mx2m] |
[4mx2m] | |
|
trees species/m² |
5.1 |
3.7 |
5.0 |
5.8 |
4.7 |
4.9 |
|
commercial trees/m² |
0.2 |
0.2 |
0.2 |
0.3 |
0.5 |
0.3 |
|
vines/m² |
0.6 |
0.5 |
1.2 |
0.8 |
0.8 |
0.8 |
|
woody plants/m² |
5.7 |
4.2 |
6.2 |
6.6 |
5.5 |
5.7 |
Detailed information on the skid trail survey can be found in Appendix 6.
Regarding soil compaction, there did not seem to be any obvious trend with respect to plant density, since the highest number and the lowest number of trees were found in the ruts most compacted by the skidding equipment (see Table 14). Plant density (plants/m²) was about two times higher in skid trails than in gap openings (see Verissimo et al. 1992 and Jonkers 1988 for similar findings).
Regeneration in gap openings
Regeneration in gap openings was investigated in cutting unit A2/G03 by using small plots of 2 m x 2 m at 10 m spacing, following the assumed felling direction within the felling gap. Within that part of the gap opening caused by the removed stem, only one plot was established; in the area of the crown, plots were established to both sides following the stem direction (see Figure 6).
Figure 6. Location of plots within gap opening
Data on regeneration can be provided for only a few gap openings since in most cases plots could not be established due to debris of harvested trees. These gap openings were also characterised by a lack of established regeneration due to insufficient light for its development.
All seedlings and saplings found greater or equal to 10 cm tall in the plots established were identified, tallied, recorded, and grouped by trees, palms, and vines. Tree species of commercial interest, given present-day criteria, were recorded separately.
Table 15. Regeneration in gap openings in cutting unit A2/G03
|
Tree |
plots |
trees |
palms |
vines |
plants |
plants/m² |
gap size | |
|
No. |
[2x2m] |
all |
comm. |
[m²] | ||||
|
116 |
5 |
60 |
(3) |
17 |
10 |
87 |
4.35 |
214 |
|
141 |
3 |
29 |
(4) |
5 |
7 |
41 |
3.42 |
168 |
|
NN1 |
5 |
25 |
(1) |
18 |
16 |
59 |
2.95 |
138 |
|
108 |
5 |
28 |
(0) |
6 |
9 |
43 |
2.15 |
113 |
|
52 |
3 |
11 |
(1) |
6 |
8 |
25 |
2.08 |
110 |
|
NN3 |
3 |
15 |
(2) |
9 |
6 |
30 |
2.50 |
103 |
|
115 |
3 |
23 |
(0) |
5 |
10 |
38 |
3.17 |
99 |
|
NN2 |
3 |
9 |
(2) |
3 |
11 |
23 |
1.92 |
90 |
|
110 |
3 |
13 |
(0) |
4 |
1 |
18 |
1.50 |
87 |
|
total |
33 |
213 |
(13) |
73 |
78 |
364 |
1122 | |
|
plants/m² |
1.6 |
0.1 |
0.6 |
0.6 |
2.8 |
mean |
124.7 | |
The densities (plants/m²) of trees, palms, and vines regenerating in gap openings observed indicate that sufficient time for regeneration to establish had not elapsed. This is reinforced by the fact that about 2/3 of the gap opening sampling plots could not be established because of the undecayed debris of harvested trees.
Postharvest assessments of regeneration in gap openings created by tree felling should probably be carried out 2 years after harvesting operations have been completed as done by Verissimo et al. (1992). Interestingly, the total number of plants/m² found in this current gap inventory was higher than the figure of 2.4 plants/m² stated in Verissimo et al. (1992). However the number of commercial trees was only about 1/3 of the number found by Verissimo et al. (1992).
Another reason for the low density of tree species found in the gap openings of cutting unit A2/G03 might be the size of the gap openings, that is, a lack of sunlight. The average size of the gap openings observed was 124.7 m², whereas Verissimo et al. (1992) found larger gaps of 150-300 m² for natural tree falls. One cause of the small size of gap openings in this cutting unit is the smaller trees occurring in this area of compartment A2. Another cause is that by proper felling techniques and using directional felling, residual stand damage and gap size are reduced. This direct relationship between gap size and number of plants found per m² is underscored by the trend found with this inventory (see Table 15).
Given present-day utilisation criteria, only 6% of all regenerated trees inventoried are of commercial interest and 1/3 of the gap openings entirely lack trees of commercial interest. With only an average of about one tree of commercial interest per gap opening, it is advisable that assessments be made on the future development of regeneration.
Silvicultural treatments, cutting vines, girdling undesired tree species, and thinning, will correct undesired effects of canopy openings. on the regeneration process, stimulate tree growth of commercial tree species, and permit the attainment of the desired future forest condition.
Within the scope of the postharvest assessments, information has been gathered to estimate environmental impacts associated with felling and ground-skidding operations of the environmentally sound forest harvesting system as compared to the traditional logging system.
Survey of skid trails
The skid trail systems in cutting units B/G09 and B/F09 were mapped to obtain information on the skid trail pattern (see Figures 7 and 8). The skid trail system was investigated with regard to primary and secondary trails. Width of skid trail and degree of soil disturbance were recorded at significant points of the skid trails. In addition, randomly distributed measurements on soil compaction were obtained by means of infiltrometer on the skid trails and on the undisturbed forest floor within the cutting units.
The features of each skid trail system surveyed in the above mentioned cutting units are stated in Table 16. All skid trails were designated with soil disturbance class I. This class is characterised by the occurrence of only slightly exposed or unexposed mineral soil. Soil disturbance class II, characterised by mineral soil partly or fully exposed and often in combination with gullying, did not appear during the skid trail survey.
Table 16. Skid trail system in cutting unit B/G09 and B/F09
|
classification of skid trail |
environmentally sound forest harvesting system (B/G09) |
traditional logging system (B/F09) | ||||||
|
width |
length |
area |
width |
length |
area | |||
|
[m] |
[m] |
[m²] |
[m] |
[m] |
[m²] | |||
|
primary |
3.50 |
1200 |
4200 |
4.94 |
2855 |
14104 | ||
|
secondary |
--- |
--- |
--- |
3.50 |
1317 |
4610 | ||
|
total |
1200 |
4200 |
4172 |
18714 | ||||
In the environmentally sound forest harvesting system the area used for skid trails amounts to 4.2% of the total area of the cutting unit, whereas in the traditional system the corresponding figure amounts to 18.7. For comparison, in Moura-Costa (1997) figures of 30-40% of logged areas traversed by bulldozers are reported for timber harvesting operations in the traditional way in tropical rain forests in Sabah, Malaysia.
The average area used for forest infrastructure per cutting unit (Table 17) to facilitate timber harvesting, as outlined in previous chapters, has been calculated taking into account the following considerations. Since each landing serves as collection area for 4 cutting units and landings are planned to be established 500 m apart on both sides of the forest road, the 500 m of forest road between adjacent landings provide access to 8 cutting units. Furthermore, each third skid trail serves as the extraction route for two adjacent cutting units (see Figure 5). Therefore, the calculation of the average area used for forest infrastructure per cutting unit is based only on the proportional area used for the establishment of landings, forest road and skid trails.
Figure 7. Permanent skid trail pattern in cutting unit B/G09
Figure 8. Skid trail pattern in cutting unit B/F09
Table 17. Average area affected by forest infrastructure per cutting unit
|
type of forest infrastructure |
environmentally sound forest harvesting system |
traditional logging system | ||||||
|
features |
area affected |
features |
area affected | |||||
|
[m²] |
[m/ha] |
[%] |
[m²] |
[m/ha] |
[%] | |||
|
forest road |
625 |
12.5 |
0.63 |
625 |
12.5 |
0.63 | ||
|
skid trails |
||||||||
|
+ primary |
3500 |
100.0 |
3.50 |
14104 |
285.5 |
14.10 | ||
|
+ secondary |
--- |
--- |
--- |
4610 |
131.7 |
4.61 | ||
|
landing |
400 |
0.40 |
625 |
0.63 | ||||
|
total |
4525 |
112.5 |
4.53 |
19964 |
429.7 |
19.97 | ||
In the environmentally sound forest harvesting system an average area of about 4.5% per cutting unit is affected by permanent forest infrastructure as indicated in Table 17. By contrast, the average area affected by forest infrastructure came to about 20% in the traditional logging system. The lack of information on the location of felled trees and unplanned skidder driving inside the stand of the cutting unit results in the high skid trail density observed.
Since logging in the traditional way was done in a cutting unit of the F2M project area, where the forest road had already been established after comprehensive planning of the transportation system designed for the entire forest property, the figures stated in Table 17 for the area affected by road and by landing are not truly representative for the traditional logging system. Figures on this matter reported by Mauro (1996) for tropical rainforests are 3.3% of logged area used for roads and 103 m²/ha used for landings.
The importance of a significant reduction in the average area affected by skid trails per cutting unit as provided by the environmentally sound forest harvesting system, where only 3.5% of the area is used for skid trails, is underscored by the investigations on soil compaction. A very simple infiltrometer, locally prepared from plastic pipe, was used to get an idea of the compaction of the soil on skid trails and in cableways as compared to the undisturbed forest floor. The randomly distributed measurements were carried out with separate tests for primary and secondary skid trails.
The measurements, carried out one week after extraction operations had been completed, showed that there was no measurable infiltration of water into the ground after several skidder passes on a primary skid trail. On the undisturbed forest floor the water usually disappeared while the cylinder was being filled. Even on secondary skid trails with few skidder passes a measurable infiltration rate was restricted to small areas of the skid trail where the pushed-down palms and brush provided a protective mat over which the skidder travelled. The measurements in cableways indicate that the infiltration rate is diminished considerably if the uppermost soil is affected by the dragging of heavy logs.
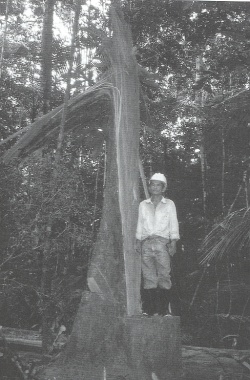
Photo 20. Even on skid trails where pushed-down palms and brush provided a protective mat the infiltration rate was greatly reduced after several skidder passes
. Even on skid trails where pushed-down palms and brush provided a protective mat the infiltration rate was greatly reduced after several skidder passes
Therefore the implementation of environmentally sound harvesting methods, where the skidding machines remain on the designated skid trails at all times, is deemed highly necessary to permit the attainment of a significant reduction in soil disturbance and soil compaction. Unnecessary damage to residual trees and advance regeneration is also avoided.
Timber losses of the environmentally sound harvesting system applied by Precious Woods in their F2M project and of the traditional system as generally used in the Amazon region, have been estimated by a wood recovery study analysing sources of timber losses in felling and extraction operations.
Wood recovery has been calculated in terms of volume of extracted saw logs at the landing in relation to utilisable stem volume at the felling site. The utilisable stem volume is considered to be that part of the harvestable stem volume where topping is carried out in such a way that unnecessary removal and transport of wood are avoided. The stem is expected to be hauled in one piece from the forest to the mill-site whenever possible. In cases of crosscutting necessary due to weight of the stem, it is assumed to have been carried out in such a way as to best meet the requirements of further processing at the sawmill.
The harvestable volume was calculated by multiplying the average cross-sectional area of the stem based on diameter measurements made at each end of the stem by the possible stem length. The possible stem length means that a stump height of 30 cm is considered to be the maximum and the uppermost, optimum point for cutting off the crown was chosen. The reference point for measurement of the possible stem length was moved above the end of the buttress in order to obtain a circular cross-section.
Losses caused by splitting of logs during the felling operation, unsatisfactory bucking of the stem, and undiscovered decay of the stem were recorded. Losses due to skidding or caused by forgotten, unextracted felled trees in the study area did not occur. The latter probably did not occur since all felled trees had been numbered with number-plates on both cutting units.
Table 18. Characteristics of timber harvest for wood recovery estimation
|
study area |
volume harvested |
number of trees harvested |
volume/tree harvested |
average stem length |
average stump height |
|
[m³] |
[m³] |
[m] |
[m] | ||
|
cutting unit B/G09 |
339.7 |
49 |
6.9 |
18.90 |
0.31 |
|
cutting unit B/F09 |
343.7 |
61 |
5.6 |
19.00 |
0.51 |
The estimate of wood recovery for both systems is stated in Table 19; all calculations are based on diameter measurements including bark.
Table 19. Timber losses in harvesting
|
Wood recovery |
environmentally sound forest harvesting system B/G09 |
traditional logging system B/F09 | ||||
|
[m³] |
% |
[m³] |
% | |||
|
Harvestable stem volume |
343.8 |
101.7 |
357.8 |
101.4 | ||
|
Utilisable stem volume |
338.0 |
100.0 |
352.7 |
100.0 | ||
|
Losses due to |
||||||
|
+ unsatisfactory topping |
4.3 |
1.3 |
13.7 |
3.9 | ||
|
+ splitting of logs |
2.9 |
0.9 |
11.1 |
3.1 | ||
|
+ bucking for extraction |
5.9 |
1.7 |
--- |
--- | ||
|
+ undiscovered decay |
--- |
--- |
5.1 |
1.5 | ||
|
Total of losses |
13.1 |
3.9 |
29.9 |
8.5 | ||
|
Extracted volume of saw logs |
324.9 |
96.1 |
322.8 |
91.5 | ||
The figures in Table 19 show that the total timber losses of 8.5% in the traditional logging system are more than twice those found in the environmentally sound harvesting system (3.9%). The most important cause of timber loss in the environmentally sound harvesting system was unsatisfactory crosscutting. This kind of loss could have been avoided by using a measuring tape prior to crosscutting. The same applies to avoidance of losses caused by unsatisfactory topping.
On cutting unit B/F09 the comparably high timber loss of 3.9% due to unsatisfactory topping was caused by not having used a measuring tape and because crosscuts to separate the crown from the stem had to be done where possible rather than where desired due to tangled tree crowns and mass of debris.
Since in cutting unit B/F09, where harvesting was carried out in the traditional way, damage to the residual stand was ignored, the skidder was driven as close as possible to the stem to be skidded and logs were pulled by cable only short distances. Therefore crosscutting to aid skidding was done only occasionally and did not occur for the observed sample.
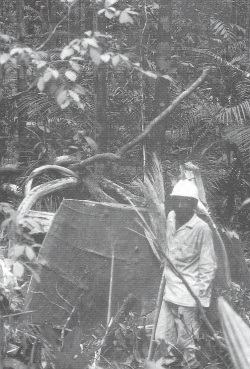
Photo 21. Lack of proper felling techniques results in losses due to the splitting of logs during tree felling, and increased danger to the felling crews
The importance of proper felling techniques as used by the well-trained felling crews is emphasised when the loss due to splitting of logs during felling operations is compared for both systems (Table 19).
As expected, losses caused by undiscovered decay occurred in the traditional logging system since acoustic explorations with axe or hammer to detect decay are considered unreliable (Panzer 1991).
Photo 22. Improper felling operations result in low utilisation rates in the traditional logging system - stump heights of up to 1.20 metres were found
Figures on avoidable waste of commercial timber reported by Gerwing et al. (1996) on traditional logging done in the state of Para, Brazil are as follows:
Felled trees never located by the bulldozer 6.6 m³/ha (17.4%)
Poor felling and bucking practices 1.7 m³/ha (4.5%).
In analysing and comparing the two systems, the following needs for training and supervision of felling crews to maximise the volume and value of wood recovered from each tree felled became obvious:
|
· chainsaw operators should be trained to follow proper felling and crosscutting techniques in order to increase the utilisable volume of the tree stem by reducing splitting of logs; |
|||||
|
· chainsaw operators should be advised to keep the stump height as low as possible; |
|||||
|
· chainsaw operators should have guiding rules to be followed so that log lengths are determined according to sawmill requirements; |
|||||
|
· no crosscut without accurate tape measurement of length desired; |
|||||
|
· crosscutting is to be avoided if weight and damage expected during extraction will allow. |
|||||
Assessments of canopy gaps caused during harvesting operations were carried out in subplots B/G03 and B/F03. All gaps were measured in width along the stem and further measurements of that part of the gap caused by the tree crown were conducted. The gaps, individually drawn to scale on the map of the subplot areas (Figures 9 and 10), include not only the opening caused by the felled tree itself but also that caused by neighbouring trees that are pulled or knocked down as a consequence of the felling operation.
Table 20. Canopy gaps and canopy opening after harvesting
|
harvesting system |
size of |
number |
size of individual |
canopy | |
|
study area |
study area |
of trees |
canopy gap |
opening | |
|
[ha] |
mean [m²] |
max. [m²] |
[%] | ||
|
environmentally sound |
|||||
|
forest harvesting system |
2.25 |
14 |
173.98 |
532.0 |
10.8 |
|
subplot B/G09 |
|||||
|
traditional logging |
|||||
|
system |
2.25 |
45 |
149.2 |
317.0 |
24.7 |
|
subplot B/F09 |
|||||
Note: Only trees or parts of them within the subplot area of 2.25 ha were considered for the calculation of the
canopy affected by harvesting operations.
On average, the size of a canopy gap caused by felling of a single tree was about 175 m² for the environmentally sound forest harvesting system, whereas for the traditional logging system the average size was about 150 m².
With the environmentally sound forest harvesting system only the most mature trees are selected to be harvested. So although individual canopy gaps were larger, both the average and maximum, this system is still favoured because the total impact with respect to canopy openings is reduced.
The canopy openings in the environmentally sound forest harvesting system came to 10.8% of the cutting unit area and can be considered akin to the natural tree fall disturbance of canopies. The value of 24.7% found for the traditional logging system, however, is beyond the upper limit of 20% reported by Uhl & Vieira (1989) for Amazonian forests, which normally have 5-20% of their area in a gapped condition at any one time.
Apart from the total amount of area opened by harvesting operations, the opening pattern is also an important impact consideration. The individual canopy gaps with the traditional logging system are small compared to the sizes for natural tree falls of 150-300 m² reported by Verissimo et al. (1992). Because of the high number of harvested trees per area, several neighbouring felled trees may form gaps of considerable size (see Figure 10).
|
|
Figure 9.Opening pattern on subplot area B/G09 |
|
Figure 10.Opening pattern on subplot area B/F09 |
If the forest is left in a relatively open, fragmented state, the residual trees are vulnerable to being toppled by wind blasts. Furthermore, the large canopy gaps are likely to favour the germination of vine seeds in response to elevated light and temperature levels (Uhl & Vieira 1989). The harvesting debris, which is abundant in these large gaps, provides the climbing structures that vines require to grow (Putz 1984). Tree seedlings and saplings may be replaced by vines, which are considered good competitors. They invest heavily in resource procurement surfaces (leaves and roots) while relying upon the provision of supportive tissue (Uhl & Vieira 1989).
Silva & Whitmore (1990) reported that in a study area where harvesting operations removed 75 m³/ha with an average of 16 trees/ha the canopy was already opened to an extent that impeders, namely vines and palms, were found spread over the area six years after harvesting started. Four years before logging commenced 81% of the sampling quadrates (10 m x 10 m) were free of vines and 93% free of palms. After an elapsed period of ten years, in the second assessment of the quadrates six years after logging, only 12% were found free of vines and 57% free of palms. The assessments also revealed an increase in the number of quadrates impeded by fallen trees and branches, probably caused by the mortality of injured and windblown trees (Silva & Whitmore 1990).
Fire is another, so far unknown, threat to natural rain forests and appears with harvesting in the traditional way. The debris, left in large gap openings in considerable amounts, is considered a fire risk. The increased amount of radiation reaching the forest floor dries the debris and therefore increases the potential fuel loads (Kauffman et al. 1988). These logged ecosystems were found to represent an entirely new and unique fire environment in Amazonia (Uhl & Vieira 1989) by providing increased fuel loads from forest debris, a decidedly drier microclimate, and anthropogenic ignition sources, since fire is commonly used for pasture establishment and weed control (Uhl & Buschbacher 1985).

Photo 23. High amount of debris left in canopy gap
![]()
![]()
![]()
![]()