![]()
![]()
![]()
Figure 1. Map of the Philippines
Figure 2. Location of selected cities in the Philippines
Figure 3. Provinces with the highest population density
Note: units in persons/sq. km.Figure 4. Climate map of the Philippines
Figure 5. Administrative regions
Figure 6. Monetary accounts (1980-1995)
Source of basic data: Bangko Sentral ng Pilipinas (1980 and 1996)Figure 7. Geographical distribution of major agricultural crops
Source: Ketelaar (1990)
Figure 8a. Volume of fisheries production (1985-1994)
Source: Bureau of Agricultural Statistics (1995a)Figure 8b. Value of fisheries production (1985-1994)
Source: Bureau of Agricultural Statistics (1995a)Figure 9. Total capture fisheries production (1985-1994)
Source: Bureau of Agricultural Statistics (1995a)
Figure 10a. Aquaculture production (1994) - Total Volume - 791,444 mt
Source of basic data: Bureau of Agricultural Statistics (1995b)
Figure 10b. Major cultured finfish and crustaceans (1994) - Total Volume = 364,536 mt
Source of basic data: Bureau of Agricultural Statistics (1995b)
Figure 11. Major brackishwater farming provinces
Note: Major provinces indicated account for 60% of total area.
Figure 12. Major freshwater farming areas
Figure 13. Provincial distribution of commercial poultry and livestock feed manufactures
Note: numbers indicate feedmills operating in the province; shaded provinces represent 80% of total feedmilling capacity
Figure 14. Geographical location of aquaculture feedmills
Figure 15. Geographical distribution of fish landing centres
Note: numbers indicate municipal fish landing centers in the provinceFigure 16. Soybean oil meal imports (1990-1994)
Source: National Statistics Office (1991, 1992, 1993a, 1994a and 1995a)Figure 17. Major rice farming provinces in the Philippines
Note: data are based on average annual production from 1992-1994
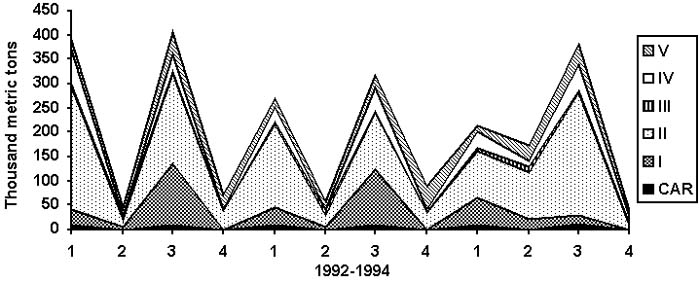
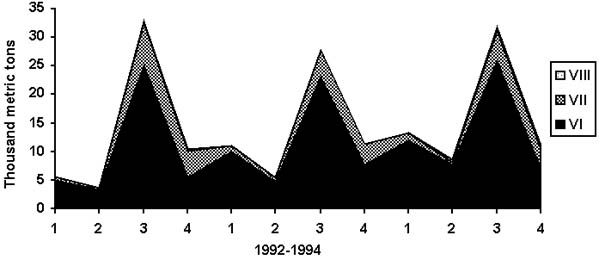
* computed based on 10% of paddy productionFigure 19a. Rice bran production: Luzon - By quarter, 1992-1994Source of basic data on rice production: Bureau of Agricultural Statistics (unpublished data)
computed based on 10% of paddy productionFigure 19b. Rice bran production: Visayas - By quarter, 1992-1994
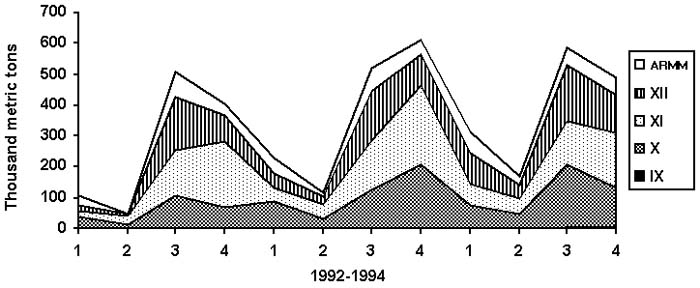
computed based on 10% of paddy productionFigure 19c. Rice bran production: Mindanao - By quarter, 1992-1994
computed based on 10% of paddy productionFigure 20. Major corn growing provinces
Note: data are based on average annual production from 1992-1994
Figure 22a. Yellow corn production: Luzon - By quarter, 1992-1994
Figure 22b. Yellow corn production: Visayas - By quarter, 1992-1994
Figure 22c. Yellow corn production: Mindanao - By quarter, 1992-1994
Source of basic data: Bureau of Agricultural Statistics (unpublished data)Figure 23. Yellow corn production and imports (1989-1994)
Source of basic data: Bureau of Agricultural Statistics (unpublished data)Figure 24. Copra and copra meal exports (1989-1994)
National Statistics Office (1991, 1992, 1993a, 1994 a and 1995a)
Source of basic data: United Coconut Associations of the Philippines, Inc. (1995)Figure 25. Geographical location and crushing capacities of coconut oil mills
Note: numbers indicate coconut oil mills operating in the provinceFigure 26. Wheat imports (1990-1994)
Source of basic data: National Statistics Office (1991, 1992, 1993a, 1994a and 1995a)
Figure 27. Geographical location of flour mills
Figure 28. Geographical location of tuna canneries
Figure 29. Major cassava growing provinces and distribution of procesiing plants
Note: numbers indicate cassava processing plants in the province
Figure 30. Marketing channels for feed ingredients
Figure 31. Monthly sales of 46-0-0, 16-20-0, and 18-46-0 (1992-1994)
Source of basic data: Fertilizer and Pesticide Authority (unpublished data)Figure 32. Monthly sales of 21-0-0, 14-14-14, and 0-0-60 (1992-1994)
Source of basic data: Fertilizer and Pesticide Authority (unpublished data)
Figure 33. Geographical location of fertilizer manufacturers
Figure 34. Major chicken growing provinces
Figure 35. Geographical location og sugar mills
Figure 36. Marketing and distribution channels for fertilizer products
Adapted form Villa-Real (1990)
Figure 37. Provincial distribution of fertilizer distributors
Note: numbers indicate fertilizer distributors in the province
Figure 38. Port management unit, major fertilizer ports, and intermediate handling ports
Source: CHEMONICS (1998)
Figure 39. Typical pond preparation procedure for growing lab-lab
![]()
![]()
![]()