Arc-Info: a tool for the computation of the irrigation water requirements at continental level
Mathieu Bousquet, Jean-Marc Faurès, Karen Frenken, Luc Verelst
Land and Water Development Division, FAO, Rome, Italy
Dans le cadre de l'estimation du potentiel d'irrigation pour l'Afrique, la FAO a adopté en 1995 une approche par bassin versant. L'intégration des données sur les ressources en eau et les terres aptes à l'irrigation est réalisée sur chacun de ces bassins en fonction des besoins en eau d'irrigation. Arc-Info est l'outil utilisé pour définir les unités géographiques de calcul, qui sont homogènes en termes de précipitations moyennes, d'évapotranspiration potentielle, de calendrier et d'intensité de culture, et d'efficience de l'irrigation. En associant les informations sur les besoins en eau d'irrigation bruts, les superficies de sols adaptés à l'irrigation et les disponibilités d'eau par bassin, on peut estimer le potentiel réel d'irrigation en Afrique.
In 1995, FAO undertook a study to assess the irrigation potential of Africa, based on a river basin appoach. To integrate information on land and water at the river basin level, knowledge of irrigation water requirements per unit of land area is necessary. Arc-Info was used to define the geographical computation units, which are homogeneous regarding average rainfall, potential evapotranspiration, cropping pattern (calendar, intensity) and irrigation efficiency. Combining information on gross irrigation water requirements, area of soils suitable for irrigation and available water resources by basin eventually results in an estimation of the physical irrigation potential for Africa.
There is growing concern over food security in Africa and especially sub-Saharan Africa. While the aggregate food supply/demand picture is relatively good, there will be a worsening in food security in sub-Saharan Africa, and cereal imports are projected to triple between 1990 and 2020, for which it will not be able to pay. Although the food situation is not as severe in North Africa, projections also indicate increasing cereal imports to 2020. To tackle this worsening situation, an increase in food production in Africa is necessary, and irrigation is one important and, in many areas, indispensable input to obtain this increase.
FIGURE 1
Assessment of irrigation potential
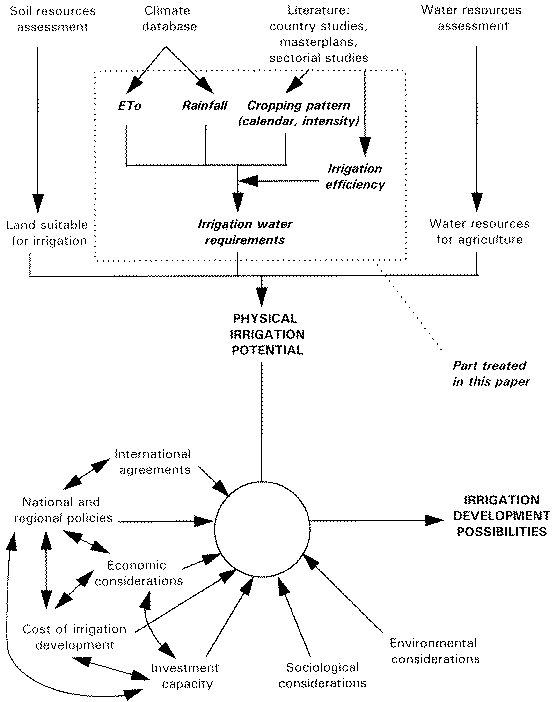
At present in Africa, of the total cultivated area estimated at 143.3 million hectares, about 12.2 million hectares benefit from irrigation. While it is true that considerable potential still exists for future expansion of irrigation, it is also true that water is becoming scarcer in those regions where the need for irrigation is most important.
In order to plan the development of these water resources carefully, especially for agriculture which is by far the biggest user of water, a re-assessment of the irrigation potential for the African continent has been judged necessary. The definition of irrigation potential is not straightforward and implies a series of assumptions about irrigation techniques, investment capacity, national and regional policies, social, health and environmental aspects, and international relationships, notably regarding the sharing of waters (IFPRI, 1995).
The most logical research unit for the computation of irrigation potential is the river basin, as only at this level can the water availability be evaluated. However, as most of the information is available at country level, and as information at country level may also be important for planning purposes, both these research units have been used to define the base on which irrigation potential is assessed (FAO, in preparation).
When combining the available land resources suitable for irrigation, expressed in hectares, and the available water resources, expressed in m3 per year, for assessing the irrigation potential, knowledge of the irrigation water requirements, expressed in m3/ha per year or in mm per year, is necessary.
Figure 1 shows the computation process for the assessment of physical irrigation potential in a first step, and the identification of possibilities for irrigation development in a second step, after taking into consideration the non-physical factors. This article deals with the computation of the irrigation water requirements, as a part of the first step of the process, and the use of a Geographical Information System (GIS) in that context1.
Crop water requirements (CWR) are calculated on the basis of monthly effective rainfall (Peff) and reference evapotranspiration (ETo), the first being calculated from average rainfall following the USDA Soil Conservation Service method and the latter being calculated following the Penman-Monteith approach (FAO, 1992). For a given crop, i, and a given cropping period:
![]() unit: mm (1)
unit: mm (1)
where kcit is the crop coefficient of the given crop, i, during the growth stage, t, and where T is the last growth stage.
Each crop has its own water requirements. Net irrigation water requirements (NIWR) in a specific scheme for a given year are thus the sum of individual crop water requirements (CWRi) calculated for each irrigated crop, i. Multiple cropping (several cropping periods per year) is thus automatically taken into account by separately computing crop water requirements for each cropping period.
![]() unit: m3 (2)
unit: m3 (2)
where Si is the area cultivated with the crop, i.
Dividing by the area of the scheme (S, in ha), a value of irrigation water requirements is obtained, expressed in m3/ha or in mm (1 mm = 10 m3/ha).
 unit: m3/ha (3)
The cropping intensity of the scheme can be defined as:
![]() (4)
(4)
To account for losses of water incurred during conveyance and application to the field, an efficiency factor should be included when calculating the irrigation water requirements for a scheme. The efficiency (E) of water distribution covers the efficiency of water conveyance, the field canal efficiency and the field application efficiency. It results in the gross irrigation water requirement (GIWR) per unit of area.
![]() unit: mm (5)
unit: mm (5)
In order to compute irrigation water requirements at continental level, assumptions have to be made on the definition of areas which will be considered as homogeneous in terms of rainfall, ETo, cropping pattern, cropping intensity and irrigation efficiency. A GIS is used in the process of defining such homogeneous areas, and for computing the values over the whole continent once calculations have been carried out for each area.
The validity of the process relies completely on the representativeness of the areas chosen as homogeneous for irrigated cropping pattern and characteristics, ETo and rainfall. Should they be too large, the differences between several points of the same zone would be too important to allow the area to be considered as homogeneous. On the other hand, should they be too small, the needed basic information would not be available for each of them.
Two maps have to be obtained and combined: a map of irrigated cropping patterns and characteristics, and another of homogeneous areas for climate characteristics (P, ETo).
The first step consists thus of determining homogeneous cropping pattern zones for irrigated agriculture. The irrigation cropping pattern area means that each point of the area, should it be irrigated, would be cultivated following the irrigation cropping pattern. It does not reflect the status of present irrigation, but describes what would be the cropping pattern if water and soil resources were allowing the development of irrigation. It is therefore rather theoretical, and explains why an irrigated cropping pattern is also assigned to some parts of the Sahara desert where irrigation is obviously not feasible everywhere. It should also be mentioned that this irrigation cropping pattern is different from the actual rainfed cropping pattern. The available literature (country studies, masterplans, sectorial studies, etc) gives generally figures for this cropping pattern at the scheme level or at the country level, but rarely at the regional level and almost never at the river basin level. The available information (FAO, 1987, 1995b) is nevertheless used to define an average irrigated cropping pattern, based on the cropping pattern in irrigated schemes spread over the continent.
In order to improve the definition of the homogeneous areas for irrigated cropping patterns, other factors are also considered: topographic slopes which may prevent development of specific crops; rainfall trends and rainfall patterns which have a direct influence on cropping patterns; presence of wetland such as the Sudd marshes land in Sudan or rivers such as the Nile River in Egypt or the Niger River in Mali which affect the kind of crops which are cultivated under irrigation; population pressure which may affect both actual and potential cropping intensity; technological differences which may affect the kind of crop cultivated.
Furthermore, the cropping pattern computed on the basis of actual irrigated agriculture shows a diversity of crops which would not exist if irrigation was developed on a larger scale. When drawing the map of cropping pattern, it was decided to retain only the main crops, which represent together at least 85% of the total irrigated area. Land occupation by the remaining 15% or less of secondary crops is assigned to the main crops.
For the specific case of irrigated vegetables, their cultivated area may represent a large percentage of total irrigated crops because of the low development of irrigation, but would not be much more developed in real terms if irrigation development covered the whole potential, due to market limitations.
Two other variables significantly affect the water requirements: (1) the cropping intensity, and (2) the water distribution efficiency. Little information exists on global irrigation efficiency (FAO, 1977). It was decided to assess the efficiency on the base of the irrigated cropping pattern and of regions since irrigation efficiency may vary critically according to the level of intensification of irrigation techniques, traditional cultivation, management practices. One figure for both variables was obtained for each cropping pattern zone.
Because the study should serve the purpose of assessing both current and future water use, two scenarios are developed: one with the actual situation, meaning the actual cropping intensity and the actual irrigation efficiency, and the other with potential values for those two variables. Potential cropping intensity is generally estimated by increasing current values by 10 to 20%, while potential efficiencies are estimated to be only 5 to 10% higher than the actual figures.
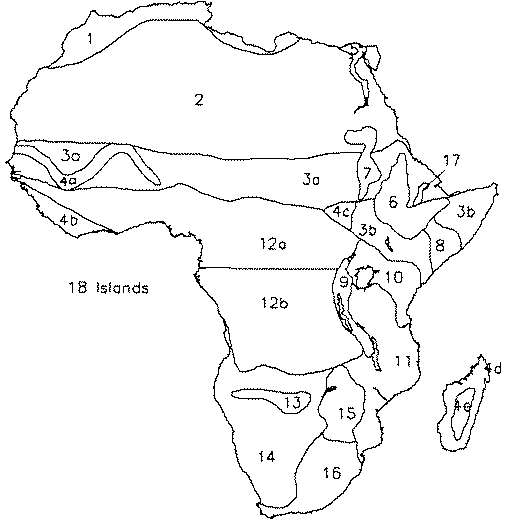
This process results in the definition of 24 zones for the African continent, subsequently digitized and stored in Arc-Info (Figure 2). For each of them, a typical crop calendar is developed for all major crops (see example in Figure 3).
FIGURE 2
Irrigation cropping pattern zones. List of cropping pattern zones.
1. Mediterranean coastal zone
2. Saharan oases
3a. Semi-arid to arid savannas in West-East Africa
3b. Semi-arid/arid savanna (Somalia, Kenya, Southern Sudan)
4a. Rice - Niger/Senegal rivers
4b. Rice - Gulf of Guinea
4c. Rice - Southern Sudan
4d. Rice - Madagascar tropical lowland
4e. Rice - Madagascar highland
5. Egyptian Nile and delta
6. Ethiopian highlands
7. Sudanese Nile area
8. Shebelle-Juba river area in Somalia
9. Rwanda-Burundi-southern Uganda highland
10. Southern Kenya - Northern Tanzania
11. Malawi/Mozambique/Southern Tanzania
12a. West and Central African humid areas above the equator
12b. Central African humid areas below the equator
13. River affluents on Angola-Namibia-Botswana border
14. South Africa - Namibia - Botswana desert and steppe
15. Zimbabwe highland
16. South Africa - Lesotho - Swaziland
17. Awash river area in Ethiopia
18. All islands (Comores, Mauritius, Seychelles, Cape Verde)
FIGURE 3
Example of cropping calendar for the Egyptian Nile and delta

The second step consists of computing evapotranspiration; long-term average rainfall and potential evapotranspiration data were used. Using the climatic database FAOCLIM, data for 1 025 stations spread over Africa were used. Ideally, to obtain a spatial coverage of the continent, the best solution would have been to interpolate rainfall and ETo data among the existing stations, considering the agro-ecological variations that exist among the stations. Another simpler solution is preferred: each station is assigned an area of influence using Thiessen polygons (Figure 4). This method assumes linear variation of precipitation among stations and assigns each segment of area to the nearest station. On average, because of the low density of climate stations in several parts of Africa, a climate station is thus representative for the climate over 29 330 km2, but it ranges from 18 000 to 485 000 km2. The method leads to the result that the more isolated a station is, the higher its relative importance becomes.
As the quality of climatic data appears decisive for the quality of the results, it is decided to verify them by plotting them against thematic maps of yearly average rainfall and ETo data. Quality of data is obviously linked to the density of climate stations, which is much lower in the desert areas (Sahel, Sahara, Kalahari). Rainfall data are compared with raster maps prepared by the Australian National University (Figure 5). This results in some corrections to the climate database, but generally not more than one month correction for only a few stations.
The third step consists of combining the cropping pattern zones and the Thiessen polygons and results in the definition of 1 437 basic map units. Each unit is thus characterized by one irrigation cropping pattern and one climate.
For all these units, the CROPWAT model - a computer program for crop water requirement calculations developed by FAO (FAO, 1995a) - is used during the fourth step to compute net irrigation water requirements. Inputs for the model are climatic parameters - rainfall and ETo - and crop coefficients. Output from CROPWAT includes monthly net irrigation water requirements by crop. Using the cropping pattern, and the actual and potential cropping intensity, net irrigation water requirements per year are calculated for a theoretical hectare of irrigated land in each area, as explained earlier. For each scenario (potential and actual), a figure for gross irrigation water requirements is obtained for each of the 1 437 units. Those results are subsequently plotted on Arc-Info (Figure 6). A manual adjustment leads finally to the identification of 84 areas of relatively homogeneous cropping pattern and gross irrigation water requirements, which are subsequently digitized (Figure 7).
These results are then combined with water resources on one side, and soils suitable for irrigation on the other, for the assessment of the physical irrigation potential.
The method that was used is based on a combination of GIS and water balance calculation programs at regional level. For the regional assessment of irrigation water requirements, as far as possible the information available through GIS was used. The major constraint observed is the limited amount of available information, on the basis of which irrigation cropping pattern zones have been nevertheless defined. While the definition of irrigation cropping pattern zones can be considered as satisfying at the continental level, which is the purpose of the present study, it would not be precise enough at a country level. Furthermore the cropping pattern which is defined is an average one, based on the actual situation of irrigation development, and cannot presume what would be the cropping pattern in each irrigated scheme for a larger irrigated area.
Figure 4
Theissen polygons for climate stations
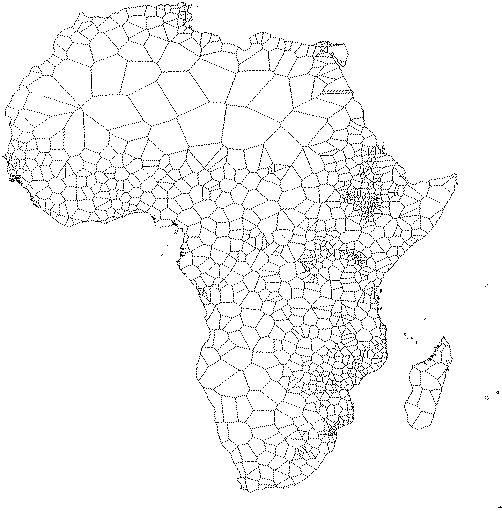
FIGURE 5
Comparison of average rainfall between FAOCLIM and Australian National University data
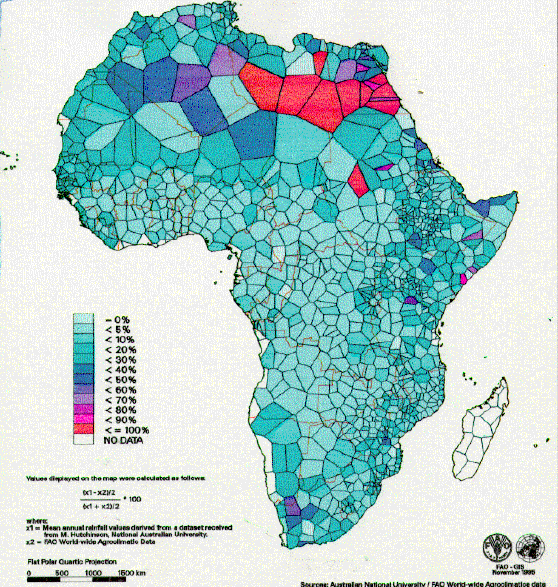
FIGURE 6
Gross irrigation water requirements (before adjustments)
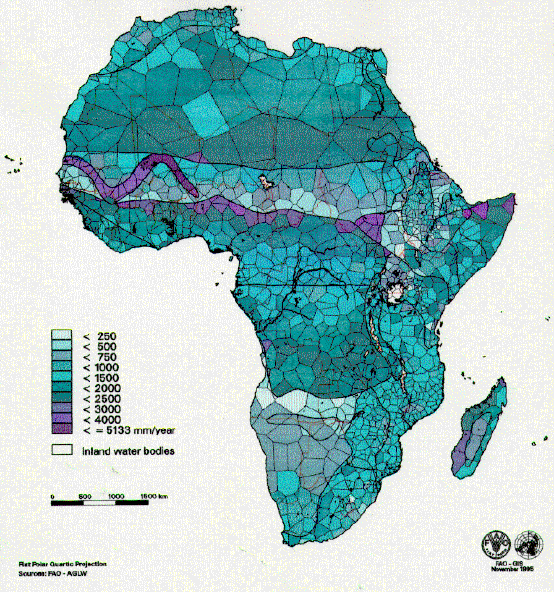
FIGURE 7
Gross irrigation water requirements (after adjustment)
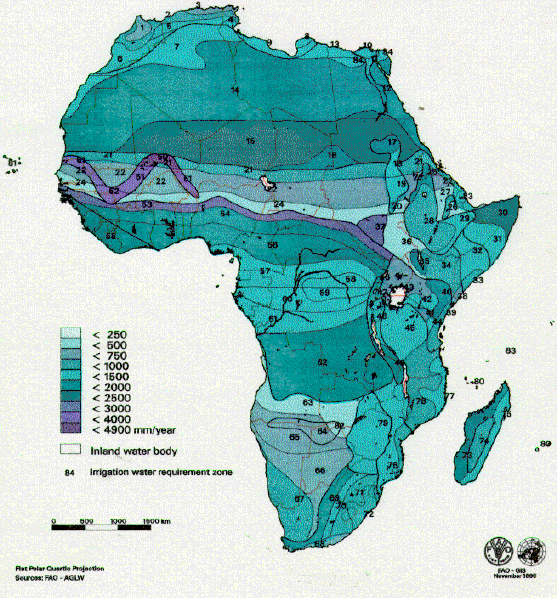
The influence of the cropping pattern zones on the quality of the output is of prime importance. Extreme differences in irrigation water requirements can be observed in adjacent zones, as a consequence of this approach. For instance, in Burkina Faso, areas located north of the 1 000 mm isohyet line have a gross potential water requirement of 500 mm per year while areas located just south of this line need more than 2 800 mm per year. This is mainly due to the definition of irrigated cropping pattern zones, where it was decided that no rice was cultivated under 1 000 mm of rainfall per year. Within the cropping pattern zones, the boundaries of irrigation water requirements zones follow rainfall trends.
A second constraint is the low density of climate stations in several parts of the continent, notably the desert areas. The Thiessen polygons method leads there to major approximations. This results in a higher variation in net irrigation water requirements. The difference between two adjacent zones within the same irrigated cropping pattern zone may be as high as 600 mm/yr (in the Sahara for example), while the difference in other parts of Africa does not exceed 200 mm/yr. Resolution of climatic data could also be improved by developing monthly maps of P and ETo on the basis of interpolations among existing stations.
Other critical assumptions are those of the cropping patterns, actual and potential cropping intensities, and irrigation efficiencies. Nevertheless, country studies on this specific matter generally give figures for irrigation water requirements close to those assessed by this study.
The methodology has been developed on a large scale: the African continent. It could also be used on a smaller scale, a river basin for example, in which case a better definition of irrigation cropping pattern zones as well as a better estimation of irrigation efficiency and cropping intensity would give better results. Development of monthly maps of P and ETo would also significantly improve the resolution of the work.
FAO. 1977. Crop water requirements. FAO Irrigation and Drainage Paper 24. Rome. 144 p.
FAO. 1987. Irrigation and water resources potential for Africa. FAO AGL/MISC/11/87. Rome. 127 p.
FAO. 1992. Expert consultation on revision of FAO methodologies for crop water requirements. Rome, 28-31 May 1990. 60 p.
FAO. 1995a. CROPWAT, a computer program for irrigation planning and management. FAO Irrigation and Drainage Paper 46. Rome. 126 p.
FAO. 1995b. Irrigation in Africa in figures. FAO Water Report 7. Rome. 336 p.
FAO. 1995c. Study of the irrigation potential for Africa. Report on the computation of irrigation water requirements at continental level. Internal report AGL/FAO. Rome. 36 p.
FAO (in preparation). Assessment of irrigation potential in Africa. Internal report AGL/FAO. Rome.
IFPRI. 1995. Water resources development in Africa: a review and synthesis of issues, potentials and strategies for the future. Washington. 113 p.
1 This article presents results already reported in: "Study of the irrigation potential for Africa. Report on the computation of irrigation water requirements at continental level" (FAO, 1995c).