![]()
![]()
![]()
Coniferous sawnwood consumption in the Asia-Pacific region totalled 55 million m3 in 1992, 18% of the global consumption (Table 25). Japan (33 million m3) and China (12 million m3) were the largest consumers, comprising over 80% of the region's total consumption. Japan's consumption fluctuated with its economic cycles over the last three decades, and had a generally declining trend. China's consumption had grown steadily until the late 1980s, when it stagnated due to lack of forest resources and substitutions of other materials such as metals and concrete. In recent years, consumption has tended to decline, even though the construction industry has been booming. This phenomenon was not due to market forces, rather it resulted from government policies that required increased use of wood substitutes. In contrast to Japan and China, consumption in the Republic of Korea, India and Australia increased substantially in the 1980s, and together these countries accounted for about 14% of the region's total consumption in 1992.
Table 24. Direction of trade in chips, particles and wood residues, in thousand m3, 1999,
Table 25. Consumption of coniferous sawnwood, in thousand m3, 1962-1992.
|
Country |
1962 |
1972 |
1982 |
1992 |
|
Australia |
1341 |
1572 |
2142 |
2578 |
|
Bangladesh |
|
|
|
|
|
Bhutan |
|
|
|
|
|
Cambodia |
|
|
|
|
|
China |
6370 |
9549 |
14482 |
11780 |
|
Fiji |
11 |
28 |
9 |
-47 |
|
French Polynesia |
11 |
26 |
32 |
50 |
|
Hong Kong |
8 |
19 |
18 |
-3 |
|
India |
571 |
742 |
1915 |
2502 |
|
Indonesia |
26 |
32 |
3 |
111 |
|
Japan |
22593 |
34479 |
30750 |
32853 |
|
Korea Dem People's Rep |
185 |
185 |
185 |
185 |
|
Korea Rep |
398 |
683 |
1994 |
2846 |
|
Laos |
|
|
|
|
|
Macau |
0 |
0 |
0 |
0 |
|
Malaysia |
1 |
8 |
48 |
-11 |
|
Myanmar |
|
|
|
|
|
Nepal |
28 |
10 |
10 |
20 |
|
New Caledonia |
6 |
17 |
31 |
23 |
|
New Zealand |
1415 |
1488 |
1743 |
1573 |
|
Pakistan |
36 |
223 |
99 |
577 |
|
Papua New Guinea |
10 |
18 |
46 |
43 |
|
Philippines |
0 |
0 |
0 |
5 |
|
Samoa |
5 |
4 |
16 |
2 |
|
Singapore |
11 |
14 |
36 |
22 |
|
Solomon Islands |
0 |
0 |
0 |
0 |
|
Sri Lanka |
3 |
0 |
5 |
0 |
|
Thailand |
|
|
|
|
|
Tonga |
0 |
0 |
2 |
1 |
|
Vanuatu |
4 |
3 |
1 |
0 |
|
Viet Nam |
30 |
69 |
53 |
-50 |
|
Asia Pacific |
33063 |
49169 |
53620 |
55060 |
|
World |
269714 |
333923 |
311121 |
315386 |
|
Share |
12% |
15% |
17% |
18% |
Production of coniferous sawnwood in the region totalled at 46 million m3 in 1992, or 15% of the world's total (Table 26). The largest producers in the region were Japan, China, the Republic of Korea, India, New Zealand, and Australia. Of the region's total production, Japan accounted for more than 52%, while China had nearly 25%. Inmost countries, production rose in concert with consumption. In Japan and China, however, production decreased. In Japan, production peaked at 33 million m3 in 1978 and fluctuated around 25 million m since then. In China, production increased steadily until 1985 to a high of 18 million m3. After that, China's production decreased to a low of 12 million m3 in 1992.
Table 26. Production of coniferous sawnwood, in thousand m3, 1962-1992.
|
Country |
1962 |
1972 |
1982 |
1992 |
|
Australia |
859 |
918 |
1285 |
1558 |
|
Bangladesh |
|
|
|
|
|
Bhutan |
|
|
|
|
|
Cambodia |
|
|
|
|
|
China |
6400 |
9660 |
14488 |
11452 |
|
Fiji |
0 |
15 |
13 |
40 |
|
French Polynesia |
|
|
|
|
|
Hong Kong |
|
|
|
|
|
India |
567 |
742 |
1914 |
2500 |
|
Indonesia |
26 |
32 |
23 |
138 |
|
Japan |
22036 |
32434 |
26480 |
24423 |
|
Korea Dem People's Rep |
185 |
185 |
185 |
185 |
|
Korea Rep |
360 |
770 |
2153 |
2810 |
|
Laos |
|
|
|
|
|
Macau |
|
|
|
|
|
Malaysia |
1 |
53 |
91 |
69 |
|
Myanmar |
|
|
|
|
|
Nepal |
28 |
10 |
10 |
20 |
|
New Caledonia |
2 |
2 |
0 |
0 |
|
New Zealand |
1447 |
1737 |
2242 |
2465 |
|
Pakistan |
34 |
208 |
68 |
577 |
|
Papua New Guinea |
14 |
32 |
46 |
43 |
|
Philippines |
0 |
0 |
0 |
4 |
|
Samoa |
|
|
|
|
|
Singapore |
|
|
|
|
|
Solomon Islands |
|
|
|
|
|
Sri Lanka |
|
|
|
|
|
Thailand |
|
|
|
|
|
Tonga |
0 |
0 |
2 |
1 |
|
Vanuatu |
0 |
2 |
0 |
0 |
|
Viet Nam |
30 |
69 |
52 |
102 |
|
Asia Pacific |
31989 |
46869 |
49052 |
46387 |
|
World |
270027 |
334232 |
312985 |
320986 |
|
Share |
12% |
14% |
16% |
15% |
Imports and exports of coniferous sawnwood have concerned a few countries in the region. Tables 27 and 28 summarize the import and export trends by country and territory, between 1962 and 1992. Total imports roughly doubled every ten years over the last three decades, and reached 10 million m in 1992, about 13% of the world's total imports. The largest importers in 1992 were Japan with 8.4 million m3 and Australia with 1 million m3. China's imports have also gradually increased since 1980.
Table 27. Imports of coniferous sawnwood, in thousand m3, 1962-1992.
|
Country |
1962 |
1972 |
1982 |
1992 |
|
Australia |
515 |
665 |
868 |
1030 |
|
Bangladesh |
|
|
|
|
|
Bhutan |
|
|
|
|
|
Cambodia |
|
|
|
|
|
China |
1 |
2 |
6 |
367 |
|
Fiji |
11 |
15 |
0 |
0 |
|
French Polynesia |
11 |
26 |
32 |
50 |
|
Hong Kong |
8 |
22 |
18 |
23 |
|
India |
4 |
0 |
1 |
2 |
|
Indonesia |
0 |
0 |
0 |
0 |
|
Japan |
658 |
2072 |
4276 |
8433 |
|
Korea Dem People's Rep |
|
|
|
|
|
Korea Rep |
38 |
13 |
8 |
121 |
|
Laos |
|
|
|
|
|
Macau |
0 |
0 |
0 |
0 |
|
Malaysia |
0 |
1 |
3 |
16 |
|
Myanmar |
|
|
|
|
|
Nepal |
|
|
|
|
|
New Caledonia |
4 |
15 |
31 |
23 |
|
New Zealand |
45 |
13 |
14 |
20 |
|
Pakistan |
2 |
15 |
31 |
0 |
|
Papua New Guinea |
0 |
1 |
0 |
0 |
|
Philippines |
0 |
0 |
0 |
1 |
|
Samoa |
3 |
4 |
18 |
2 |
|
Singapore |
0 |
0 |
17 |
11 |
|
Solomon Islands |
0 |
0 |
0 |
0 |
|
Sri Lanka |
3 |
0 |
5 |
0 |
|
Thailand |
|
|
|
|
|
Tonga |
|
|
|
|
|
Vanuatu |
4 |
1 |
1 |
0 |
|
Viet Nam |
0 |
0 |
1 |
16 |
|
Asia Pacific |
1307 |
2865 |
5330 |
10115 |
|
World |
38225 |
57138 |
59924 |
77280 |
|
Share |
3% |
5% |
9% |
13% |
The Asia-Pacific countries exported very little coniferous sawnwood. The total exports in 1992 were 1.5 million m3, or only 2% of the world's total. New Zealand was the only important exporter: nearly 1 million m3 in 1992, or 62% of the region's total.
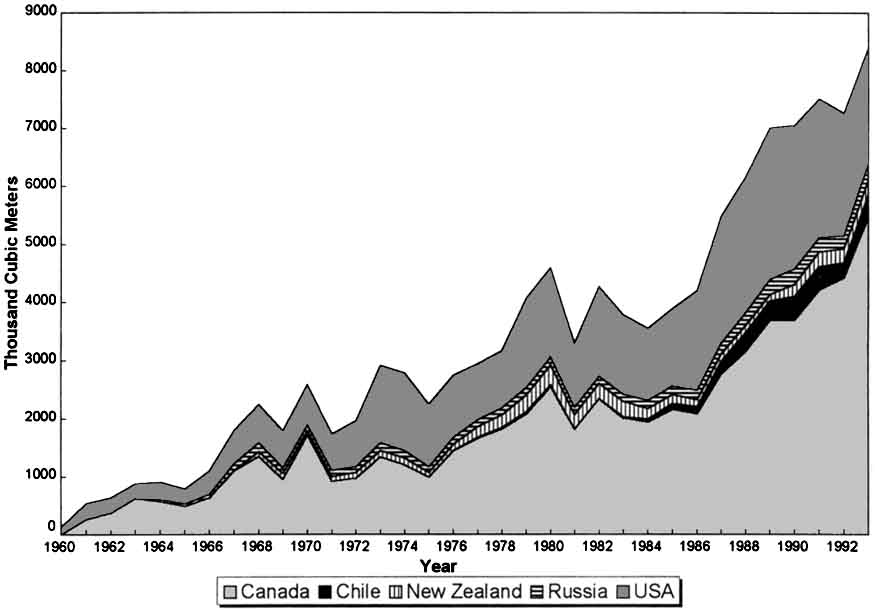
Table 29 shows the direction of trade in coniferous sawnwood in 1992, among the Asia-Pacific countries and with other parts of the world. The region has been a net importer of coniferous sawnwood. In 1992, the major importers in the region for New Zealand's sawnwood were Australia with 694 thousand m, Japan with 272, China with 66, and Republic of Korea with 42. Outside the region, the United States has been the main destination of New Zealand's coniferous sawnwood. In contrast, the region imported almost one-fifth of the total coniferous sawnwood it consumed from other regions of the world, mostly from North America. In 1992, the region imported 5.6 million m3 from Canada and 2.1 million m from the USA. Japan (8.4 million m) has been the leading importer of the region, followed by Australia (1.5 million m3), China (528 thousand m3) and the Republic of Korea (184 thousand m3). Figure 7 illustrates the historical trend of Japanese imports of coniferous sawnwood from the major suppliers. The imports from Canada and USA have increased significantly since 1986. However, since 1990, USA's exports have declined after making steady gains during the 1980s, due to the harvest restrictions related to the Spotted owl and other environmental concerns, meanwhile, Canadian exports have seen strong increases.
Table 28. Exports of coniferous sawnwood, in thousand m3, 1962-1992.
|
Country |
1962 |
1972 |
1982 |
1992 |
|
Australia |
33 |
11 |
11 |
10 |
|
Bangladesh |
|
|
|
|
|
Bhutan |
|
|
|
|
|
Cambodia |
|
|
|
|
|
China |
31 |
113 |
12 |
39 |
|
Fiji |
0 |
2 |
4 |
87 |
|
French Polynesia |
|
|
|
|
|
Hong Kong |
0 |
3 |
0 |
26 |
|
India |
0 |
0 |
0 |
0 |
|
Indonesia |
0 |
0 |
20 |
27 |
|
Japan |
101 |
27 |
6 |
3 |
|
Korea Dem People's Rep |
|
|
|
|
|
Korea Rep |
0 |
100 |
167 |
85 |
|
Laos |
|
|
|
|
|
Macau |
|
|
|
|
|
Malaysia |
0 |
46 |
46 |
96 |
|
Myanmar |
|
|
|
|
|
Nepal |
|
|
|
|
|
New Caledonia |
|
|
|
|
|
New Zealand |
77 |
262 |
513 |
912 |
|
Pakistan |
|
|
|
|
|
Papua New Guinea |
4 |
15 |
0 |
0 |
|
Philippines |
|
|
|
|
|
Samoa |
|
|
|
|
|
Singapore |
11 |
14 |
19 |
11 |
|
Solomon Islands |
|
|
|
|
|
Sri Lanka |
|
|
|
|
|
Thailand |
|
|
|
|
|
Tonga |
|
|
|
|
|
Vanuatu |
|
|
|
|
|
Viet Nam |
0 |
0 |
0 |
168 |
|
Asia pacific |
257 |
593 |
798 |
1464 |
|
World |
38538 |
57447 |
61788 |
82880 |
|
Share |
1% |
1% |
1% |
2% |
Table 29. Direction of trade in coniferous sawnwood, in thousand m3, 1992.
![]()
![]()
![]()