![]()
![]()
![]()
M.L. Brzozowski1, S.D. Lukefahr2, A. Frindt1, H. Jasiorowski3 and J. DeVries4
1Fur Animal Division, Warsaw Agricultural University, 05-840
Brwinow, Przejazd 4, Poland;
2Department of Animal and Wildlife Sciences, Texas A&M University-Kingsville
78363, USA;
3Representative for Central and Eastern Europe, Heifer Project International, 02-528
Warsaw, Poland; and
4Heifer Project International, PO Box 808, Little Rock, AR 72203, USA.
Acknowledgements. The authors wish to express their gratitude to the State
Committee for Scientific Research (KBN), Poland, and to the Andrew Mellon Foundation, USA,
for grants that supported this research project.
En 1992, Heifer Project International a lanc� un important projet de production de lapins en Pologne. Aujourd'hui, 5 175 familles rurales dans les r�gions de Kielce et de Radom ont re�u une formation de base sur la reproduction des lapins d'�levage. La production de lapins a �t� �valu�e sur 110 petites exploitations (comprenant 7 102 lapereaux n�s de 955 port�es) afin de d�terminer l'importance de techniques vari�es de s�lection, d'habitat et de nourriture pouvant avoir une incidence potentielle sur la production. Les traits caract�ristiques pris en compte �taient la taille des port�es � la naissance et au sevrage, le taux de survie avant le sevrage, et le nombre annuel total de lapereaux et de port�es produits par femelle. Le principal facteur limitant identifi� �tait le petit nombre de port�es (<2) produit annuellement par femelle. Ce document pr�sente les r�sultats d�taill�s de cette �tude. De mani�re g�n�rale, il est recommand� de placer les cages sous couvert, d'installer de petits r�teliers � fourrage, des abreuvoirs et de fournir un suppl�ment d'alimentation, et d'encourager un programme de reproduction plus intensif afin d'augmenter la production et la consommation int�rieure de viande de lapin.
En 1992, Heifer Project International puso en marcha un importante proyecto de cunicultura en Polonia. Hasta el momento han recibido capacitaci�n b�sica en la cr�a de conejos 5 175 familias rurales de las regiones de Kielce y Radom. Se evalu� la cunicultura en 110 peque�as explotaciones (con 7 102 cr�as nacidas en 955 camadas) para determinar la importancia de las diversas t�cnicas de ordenaci�n de la reproducci�n, el alojamiento y la alimentaci�n que pueden afectar a la producci�n. Las caracter�sticas examinadas fueron el tama�o de las camadas nacidas y destetadas, la tasa de supervivencia antes del destete y el n�mero total de cr�as y de camadas producidas por coneja. Un obst�culo limitante importante identificado fue el peque�o tama�o de las camadas (<2) producidas anualmente por coneja. En el art�culo se presentan los resultados detallados. En general, se recomienda colocar las jaulas en el interior y el uso de pesebres para el forraje, bebederos y alimentaci�n adicional, as� como el fomento de un programa m�s intensivo de reproducci�n, a fin de aumentar la producci�n y el consumo dom�stico de carne de conejo.
Kielce and Radom are among the poorest regions in Poland. In 1993, the average monthly worker's income was only $175, and the rate of unemployment exceeded 15 percent. The size of the average family is seven members and the food they consume comes mostly from the home farm (average farm size is 2 ha) with crops and vegetables being grown on poor-quality soils (Statistical Yearbook, 1995). In general, traditional rabbit breeding in Poland involves small-scale home production (Niedzwiadek, 1988).
Since 1992, the "Family Farm Rabbit Production" programme, run
by Heifer Project International, has provided basic training and coordinated distribution
of rabbit stock to about 5 175 rural families in 212 villages in the Kielce and Radom
regions, the main objective being to encourage families to produce inexpensive rabbit meat
for consumption and so improve diet quality. A secondary objective was to supplement
family income through the collective marketing of surplus fryers. In 1992, an initial
batch of 5 104 breeding rabbits was distributed to 1 017 families. In 1993, these
first-cycle recipient families returned surplus offspring to the programme for shared
distribution to a further 556 families. Several such cycles of redistribution of breeding
stock have since occurred (Lukefahr and Jasiorowski, 1995).
Few development programmes have investigated the factors that influence levels of rabbit
production on small farms. Such information would, however, be useful to enterprises aimed
at small-scale rabbit production and to the managers of such projects. Therefore, our
objectives were to: assess rabbit production levels; determine the importance of the
various factors affecting reproduction and their possible interactions; investigate the
influence of husbandry practices on doe and fryer production; and thus recommend breeding
and management practices that could improve production levels.
Starting in early 1994, a totally random sample of 110 family farms in 12 counties of Kielce and Radom regions were visited monthly to observe management practices and to collect rabbit production data (Table 1). Rabbit breeds used were Californian (CAL) and New Zealand White (NZW) pure-breds, and cross-breds of either specific (CAL x NZW) or unknown origin. Only 24 pure-bred litters from CAL does were produced, whereas 487 and 444 litters were produced by NZW and cross-bred does, respectively (Table 1). Most does in production were older than one year. Traditionally, farmers first breed their does in late February to early March. Breeding was repeated usually only once or twice during the year. However, does were seldom bred between October and January.
1
Number of observations by region, breed and parity class
Nombre d'observations par r�gion, race et classe de
N�mero de observaciones por regiones, razas y clases de paridad
Item |
Region |
||
Kielce |
Radom |
Total |
|
Number of farms sampled |
53 |
57 |
110 |
Number of litters by breed type |
|||
Californian |
11 |
13 |
24 |
New Zealand White |
230 |
257 |
487 |
Cross-bred |
251 |
193 |
444 |
Total litters born |
492 |
463 |
955 |
Total litters weaned |
467 |
402 |
869 |
Total kits born |
3 588 |
3 514 |
7 102 |
Total kits weaned |
2 992 |
2 707 |
5 699 |
All farmers sampled had at least one year of previous experience in
rabbit husbandry. Basic practices observed included the primary feeding of fresh forages,
weeds, garden wastes and other hand-gathered herbage to rabbits during the approximate
220-day growing season, as similarly reported by Niedzwiadek (1988). Cages were usually
home-made from a variety of materials (e.g. wooden planks, rough wood, metal bars and wire
netting).
Each farmer received data collection sheets during the initial interview. Production data
were recorded over a one-year period by the farmer, who was supervised on a monthly basis
by field staff. Data collection sheets were collected in early 1995. Data consisted of
records from 110 farms, involving 7 102 kits born to 955 litters and 449 does.
To assess individual litter traits, the parameters recorded included litter size born (LSB) and weaned (usually between 49 to 56 days of age, LSW), and preweaning survival rate (proportion of kits weaned divided by litter size born, SR). These were subjected to statistical analyses according to a mixed model using the General Linear Mixed Models (GLMM) package (Blouin and Saxton, 1990). Model effects included region, farm nested within region, doe breed type, month of birth of the litter, doe parity (primiparous versus multiparous), two-way interactions and residual error. Random effects, farm nested within region and residual error were assumed to be normally and independently distributed. Cumulative litter production traits, involving records from 449 does, were: total number of litters born (CNLB) and weaned (CNLW) and total number of kits born (CNKB) and weaned (CNKW). These traits were analysed using a similar model as described above but without month of birth, doe parity and month x parity interaction.
In preliminary analyses, doe parity was not important (P>.05) for all
traits investigated, and so was excluded from final models. A significant breed x month
interaction was detected only for LSB. Therefore, interaction sources were appropriately
eliminated from final models for all other traits analysed.
Regression analyses were also performed to determine the influence of certain housing
systems and feeding management practices. Our working hypothesis was that cages kept
indoors might have protected the stock better against the elements and predators; single
tiering of cages and non-solid floors may have been easier to sanitize and might have
minimized disease problems; cage floor areas should have been neither restrictive nor
excessive; and the provision of feeders, forage racks and waterers increased production
and/or reflected better management practices overall. As indicator variables (Netter,
Wasserman and Kutner, 1990): cage placement outside (0) or inside (1) a building, cage
tiering style (single = 0 or multitiered = 1), floor style (solid with straw bedding = 0
or slatted or wire floors = 1) and regular absence (0) or presence (1) of feeders, forage
racks or waterers were added to final models as described above for individual and
cumulative production traits. Cage floor area was also added to models as a continuous
variable (mean of 7 060 cm2 and range of 3 200 to 20 000 cm2) and
tested for linearity. Backward regression procedures were employed involving the testing
(P<.10) of indicator and continuous variables to produce "best fit"
prediction equations.
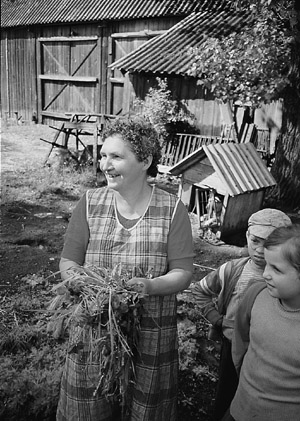
Family involvement in the feeding of forage to rabbits
Participation de la famille � l'alimentation en fourrage des lapins
Participaci�n familiar en la administraci�n de forraje a los conejos
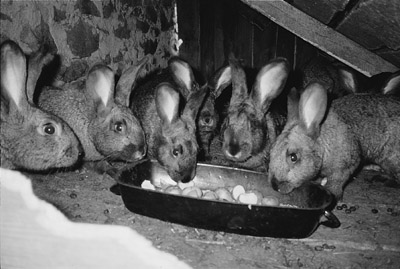
Feeding cull potatoes to fryers inside a barn attic
Petits lapins nourris de pommes de terre de rebut sous les combles d'une �table
Administraci�n de papas desechadas a conejos peque�os en el �tico de un establo
According to region, most farmers maintained four does with a range of one to eight does (Fig. 1). This supports the general recommendation of a small (three- to five-doe) subsistence-level operation in developing countries (Owen, 1976; Lukefahr and Cheeke, 1991). There were two, bimonthly litter production peaks: March-April and June-July (Fig. 2). In May, presumably, most does were still rearing their first litter of the breeding season. For over 73 percent of all litters recorded, seven or eight kits were born. For LSW, 69 percent of all litters recorded had six, seven or eight kits present. These averages for LSB and LSW are quite good for subsistence production (Owen, 1976; Lebas et al. in FAO, 1986; Lukefahr and Cheeke, 1991).
1
Number of does on farms in Kielce and Radom districts
Nombre de femelles sur les exploitations dans les districts de Kielce et Radom
N�mero de conejas en las explotaciones en los distritos de Kielce y Radom
2
Number of litters born in different months
Nombre de port�es n�es selon les mois
N�mero de cr�as nacidas en diferentes meses
The LSB was smaller (P<.05) by .58 kits in Radom than in Kielce (Table 2). Furthermore, in the same comparison, LSW tended to be larger (P<.10) by .49 kits and SR was higher (P<.01) by 12.1 percent in Kielce. The higher mortality rate in Radom could be explained by the greater number of entire litter losses (71 versus 29 percent in Radom and Kielce, respectively). There may have been differences in feeding and/or management practices between regions. For example, some farmers tended to feed only one forage variety without supplementation, whereas other farmers offered a much wider forage choice with the addition of kitchen refuse and cull vegetables.
Among-farm variation (within region) accounted for 47, 52 and 45 percent of total random variation for LSB, LSW and SR, respectively. In other words, among- versus within-farm productivity was nearly equally variable. According to the literature, these are lowly heritable traits (Lebas et al. in FAO, 1986; McNitt et al., 1996) and, therefore, are chiefly influenced by the environment which can only be controlled to a certain extent.
2
Least-squares means (SE) for litter traits by region, breed and month of birth1
Moyennes des moindres carr�s des traits caract�ristiques des port�es par r�gion, race
et mois de naissance
Medias de los m�nimos cuadrados para las caracter�sticas de las camadas por regiones,
razas y meses de nacimiento
Item |
Trait2 |
||
LSB |
LSW |
SR |
|
Region |
|||
Kielce |
8.00 " .13 |
5.83 " .31 |
.808 " .04 |
Radom |
7.42 " .12 |
5.34 " .29 |
.687 " .04 |
Breed type |
|||
Californian |
7.30 " .21 |
5.41 " .49 |
.736 " .06 |
New Zealand White |
7.38 " .10 |
5.59 " .22 |
.754 " .03 |
Cross-bred |
7.51 " .09 |
5.76 " .21 |
.762 " .03 |
Month of birth |
|||
February |
7.99 " .19 |
5.62 " .44 |
.690 " .06 |
March |
7.62 " .16 |
5.21 " .28 |
.677 " .04 |
April |
7.21 " .15 |
5.79 " .27 |
.778 " .03 |
May |
7.48 " .12 |
5.95 " .30 |
.783 " .04 |
June |
7.37 " .16 |
5.55 " .28 |
.759 " .04 |
July |
7.36 " .14 |
5.71 " .27 |
.795 " .03 |
August |
7.40 " .14 |
5.81 " .32 |
.783 " .04 |
September |
7.26 " .17 |
5.61 " .35 |
.758 " .04 |
October |
7.50 " .20 |
5.57 " .47 |
.719 " .06 |
December |
6.88 " .37 |
5.06 " .88 |
.760 " .12 |
1 Based on ANOVA results, region and month means were different
for LSB (P<.05); also a breed x month interaction was observed (P < .05). Only
region tended to affect LSW (P<.10). The SR was influenced by region (P<.01) and
month (P<.05).
2 Trait abbreviations: LSB and LSW = total litter size born and weaned (49 to
56 days); SR = survival rate (birth to weaning).
Because a breed x month interaction was detected (P<.05) for LSB, it is not appropriate to discuss breed and month main effects. An explanation for this interaction is not available since no clear pattern was observed. There were no significant differences between doe breed types for LSW or SR (Table 2), although cross-breds had the numerically larger means for these traits. Other European investigations (Partridge, Foley and Corrigall, 1981; Coudert and Brun, 1989; Nofal and Toth, 1996) involving both CAL and NZW have shown non-significant or minor breed differences for litter size traits. The influence of birth month of the litter was significant for LSB and SR (Table 2). However, there was no consistent monthly trend.
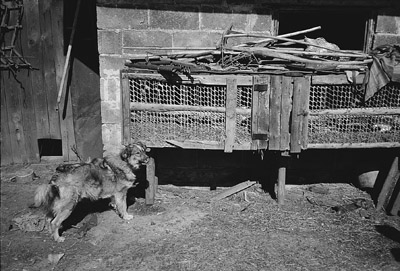
Outdoor rustic hutch protected against predators and thieves by the
family dog
Clapier rustique ext�rieur prot�g� contre les pr�dateurs et les voleurs par le chien
familial
Caba�a r�stica exterior protegida contra los depredadores y los ladrones por el perro de
la familia
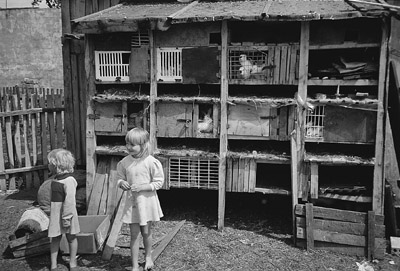
Tiers of hutches built from inexpensive or scrap materials
Rang�es de clapiers construits avec des mat�riaux bon march� ou de r�cup�ration
Filas de chozas construidas con material poco costoso o de desecho
The differences between regions were not significant for CNLB, CNKB or CNKW (Table 3). However, CNLW was higher (P<.05) by .34 units in Kielce region. On small farms, most does produced only two litters annually (69.60 and 59.46 percent of does in Kielce and Radom regions, respectively). On only 13 and 14 farms in Kielce and Radom regions, does were recorded to have produced three to four parities. In developing countries, the norm is four litters per doe in a year (Lukefahr and Cheeke, 1991).
3
Least-squares means for cumulative kit and litter production by region and breed1
Moyennes des moindres carr�s de la production cumul�e des lapereaux et des port�es par
r�gion et race
Medias de los m�nimos cuadrados para la producci�n acumulativa de cr�as y camadas por
regiones y razas
Item |
Trait2 |
|||
CNLB |
CNLW |
CNKB |
CNKW |
|
Region |
||||
Kielce |
2.13 " .09 |
1.99 " .12 |
15.63 " .77 |
12.79 " .89 |
Radom |
2.01 " .09 |
1.66 " .11 |
15.09 " .75 |
11.15 " .85 |
Breed type |
||||
Californian |
2.01 " .14 |
1.75 " .17 |
15.11 " 1.14 |
11.53 " 1.27 |
New Zealand White |
2.16 " .06 |
1.89 " .08 |
15.80 " .52 |
12.29 " .60 |
Cross-bred |
2.04 " .06 |
1.83 " .08 |
15.18 " .53 |
12.09 " .61 |
1 Breed means were different for CNLB (P<.05) and region means
were different for CNLW (P<.05), based on ANOVA results.
2 Trait abbreviations: CNLB = cumulative number of litters born; CNLW =
cumulative number of litters weaned (49 to 56 days); CNKB = cumulative number of kits
born; CNKW = cumulative number of kits weaned.
Among-farm (within region) variation accounted for 79, 80, 80 and 82
percent of total random variation in CNLB, CNLW, CNKB and CNKW, respectively. Hence,
intensity of breeding and/or total litter production tended to be more consistent among
does on the same farm versus among farms, as expected.
The CNLB was higher (P<.05) by only .12 litters for NZW compared with cross-bred does
(Table 3). There were no significant differences between breed types for CNLW, CNKB or
CNKW. One French study (Coudert and Brun, 1989), reported no significant differences
between CAL and NZW and reciprocally cross-bred does for cumulative average number of kits
weaned from does that survived and reproduced over a one-year period. The overall average
of 54.6 kits in the cited study is considerably larger than the average of 12.0 kits in
our study.
Total annual litter production was much lower than the target of four litters produced
annually per doe under extensive or subsistence conditions (Lukefahr and Cheeke, 1991).
However, this is the traditional practice of rabbit production on small farms in Poland
(Niedzwiadek, 1988). During the growing season, farmers feed mostly fresh forage and breed
for about two litters (Frindt, 1979; Jarosz, 1993). Breedings cease when fresh forage is
no longer available. It was observed that farms attaining three or four litters per doe
had adopted certain unconventional but inexpensive practices (e.g. planting alfalfa,
clovers or grasses to produce fresh feed and also hay as well as carrots, rape and turnips
as winter feedstuffs). Owing to high costs, there are few companies in Poland that
manufacture complete pelleted feed for rabbits.
The total number of offspring born annually per doe ranged from five to 35 kits.
Interestingly, more than half (53.45 percent) of all does recorded ranged from only 13 to
17 kits born. Also, number of offspring weaned annually per doe ranged from three to 31
kits; more than half (55.87 percent) of all does recorded ranged from ten to 15 kits
weaned. This is less than the projections of 20 to 35 marketable fryers per doe per annum
under extensive conditions (Lebas et al. in FAO, 1986; Lukefahr and Cheeke, 1991).
Linear covariates of cage tiering and floor styles were never significant. In general, small producers tend to invest more time in management activities that reduce disease incidence than do large producers (Owen, 1976), such that good hygiene may have been maintained regardless of cage tiering or floor styles. The indoor placement of cages was associated with increases of .92 kits in LSW (P<.05) and .09 in SR (P<.10). For cumulative traits, indoor versus outdoor cages yielded .35 higher CNLW (P<.10) and 3.1 higher CNKW (P<.05).
The regular use of both a forage rack and a waterer corresponded to
significant increases in LSB by .35 and .74 kits, and in LSW by .93 and 1.29 kits,
respectively. Hence, these simple provisions appeared to have dramatic effects on
production of kits. In addition, SR was increased (P<.10) by .25 and .11 units when a
feeder and a forage rack were regularly supplied. Waterers tended to be related (P<.10)
to 3.5 higher CNKW.
The influence of cage space area approached significance (P<.10) only for LSW and CNKW.
However, the regression coefficients obtained were negative (-.000108 and -.000036 kits/cm2),
which seemingly suggests that cage space may have generally been excessive. However, in
most cases, cage floor space was fairly uniform across farms. If real, an explanation for
this trend is not available.
Interestingly, housing management factors (cage placement, floor area and/or waterer)
affected only cumulative number of surviving kits and litters weaned but not kindling
performance, reflecting the well-recognized vulnerability of kits. Eighty-six (9 percent)
entire litters succumbed prior to weaning age, although litter size was normal (range of
five to eight kits). In Kielce and Radom, 29 and 71 percent of these losses of entire
litters occurred. Sixty percent of lost litters were kindled by primiparous does. Also, 90
percent of these litters were reared in cages outside. Because the majority (80 percent)
of cages surveyed were placed outdoors, a c2 test for independence was
conducted to determine if cage placement and mortality were related. Litter mortality was
not independent of cage placement (c2 = 6.58; P<.05); more losses than
expected occurred outdoors and vice versa. While 94 and 87 percent of the cages involved
were supplied with feeders and waterers, only 6 percent had forage racks. These values
relate to 98, 93 and 22 percent of all observed cages that had a feeder, waterer and
forage rack. A relationship existed between litter mortality and presence of a forage rack
(c2 = 13.35; P<.001). Actual death rate was 20 percent higher than expected
(80 versus 66.4 deaths) when a forage rack was not present and 69 percent lower than
expected (6 versus 19.5 deaths) when a forage rack was present. In the absence of a forage
rack, forages were usually placed directly on the cage floor which might have become
contaminated with pathogenic microorganisms. In retrospect, it would appear that litters
from predominately inexperienced does that were exposed by being reared outdoors, coupled
with poor feeding practices, were subjected to a greater mortality risk.
Based on present results, a major limiting constraint pertaining to management between regions is the low number of litters produced annually per doe. Breeding stock quality appears to be adequate since only minor differences were observed. Besides placing cages indoors and providing forage racks and waterers, special attention should also be paid to diet quality. Those farmers that attempted four litters per doe were successful in extending the breeding season by improving feeding practices (e.g. planting of legumes or grasses, making hay, and growing winter crops such as carrots, rape and turnips for human food as well as for forage). The efforts of such farmers were certainly rewarded with more inexpensively produced rabbit meat for family consumption. Extra feeding and a more intensified breeding schedule should be encouraged to increase the productivity of subsistence rabbit enterprises.
Blouin, D.C. & Saxton, A.M. 1990. General Linear Mixed Models
(GLMM) User's Manual. Louisiana State Univ., Baton Rouge, USA.
Coudert, P. & Brun, J.M. 1989. Production et morbidit� des lapines
reproductrices: �tude comparative de quatre genotypes. G�n�t. Sel. Evol., 21:
49-65.
FAO. 1986. The rabbit: husbandry, health and production. By F. Lebas, P.
Coudert, R. Rouvier. & H. De Rochambeau. Rome. (rev. 1997)
Frindt, A. 1979. Przydomowy chow krolikow. Warsaw, Poland, CRZZ Ed. (in
Polish)
Government of Poland. 1995. Statistical Yearbook. Warsaw, Poland, Central
Statistical Office.
Jarosz, S. 1993. Hodowla zwierzat futerkowych. Krakow, Poland, PWN. (in
Polish)
Lukefahr, S.D. & Cheeke, P.R. 1991. Rabbit project development strategies in
subsistence farming systems. 1. Practical considerations. World Anim. Rev., 68(3):
60-70.
Lukefahr, S.D. & Jasiorowski, H. 1995. Rabbit project design, implementation
and present status in rural voivodeships in Poland. J. Anim. Sci., 73(Suppl. 1:153)
(Abstr.).
McNitt, J.I., Patton, N.M., Lukefahr, S.D. & Cheeke, P.R. 1996. Rabbit
production. (7th ed.). Danville, IL, USA, Interstate Publishers, Inc.
Netter, J., Wasserman, W. & Kutner, M.H. 1990. Applied linear statistical
models. (3rd ed.) Boston, MA, USA, Irwin, Inc.
Niedzwiadek, S. 1988. Rabbit breeding and production in Poland.In Proc. 4th
World Rabbit Congr., Budapest. p. 50-56. WRSA.
Nofal, R.Y. & Toth, S. 1996. Evaluation of seven genetic groups of rabbits for
some reproductive traits in the first three parities. Arch. Tierz., Dummerstorf,
39(6): 623-631.
Owen, J.E. 1976. Rabbit production in tropical developing countries: a review. Trop.
Sci., 18(4): 203-210.
Partridge, G.G., Foley, S. & Corrigall, W. 1981. Reproductive performance in
purebred and crossbred commercial rabbits. Anim. Prod., 32: 325-331.
![]()
![]()
![]()