![]()
![]()
![]()
D.W. Japp
Sea Fisheries Research Institute
Private Bag X2, Roggebaai, Cape Town, Republic of South Africa
1. INTRODUCTION
South Africa has a coastline of almost 3000km extending from the mouth of the Orange River on the southern African west coast to Ponta do Ouro on the Mozambique border on the East African coast. The 200 n.m. fishing zone (EEZ), declared in 1977, covers an area of approximately 1 155 000km2. South African major industrial fisheries are however located in the Benguela Region on the west coast (east of 20°E) on the Agulhas Bank on the southern tip of the Continent (Japp et al. 1994). Chondrichthyans are caught around the whole Southern African coast, although distributions of both target and bycatch species may extend beyond the limits of known commercially exploited grounds. The distribution and taxonomy of chondrichthyan species found in South African waters have been comprehensively described with approximately 79 known endemic species reported (Compagno 1994). Target fisheries for sharks are limited to commercial grounds and include three major bottom-trawling areas. These are the west coast extending from Cape Agulhas (20°E) north and west to approximately 30°S, the south/east coast, including the Agulhas Bank extending east from Cape Agulhas to approximately 27°E and the Natal coast extending north along the east coast from approximately 29°S (Figure 1). These areas encompass three major commercial fisheries that have significant shark bycatches, i.e. the deep-sea trawl hake-directed fishery, the inshore sole/hake-directed fishery and the Natal crustacean fishery. Shark catches differ significantly between these areas and fisheries as a result of different bathymetric and oceanographic characteristics. The shark fauna on the east coast of South Africa, for example, is subtropical in character and is influenced by the warm Mozambique Current. The fauna on the west coast is more temperate and is influenced by the cool Benguela Current system with its pulsed seasonal upwelling regime.
Figure 1
Area and reference points described in paper (after Smale 1991)
All known forms of exploitation of sharks in South African waters are presented in Table 1. including target fisheries for shark, shark bycatch in other target fisheries, incidental shark catches (protective nets) or, more recently, as tourist attractions (cage diving). Clearly few direct target fisheries for shark exist in South Africa, and those that do, such as the gill net and local shark longline industries, are probably more appropriately described as multi-species fisheries, having evolved from the original intention of targeting sharks.
| Activity | Area | Nature | Key reference |
|---|---|---|---|
| Offshore trawl | West Coast, Agulhas Bank to shelf edge (600m depth) | Bycatch only | Compagno et al. 1991 Japp et al. 1994 |
| Prawn trawl | Natal East Coast to 600m | Bycatch only | Fennessey 1994b |
| Inshore trawl | South and East Coast to 200m | Bycatch only | Smale et al. 1993 Japp et al. 1994 Kroese et al. 1995 |
| Hake longline | West and South Coast to 500m | Bycatch only | Japp et al. 1995 |
| Shark longline | West and South Coast | Targeted | Penny and Punt 1992 Kroese et al. 1995 |
| Domestic tuna longline | Offshore to EEZ | Bycatch | Penny and Punt 1992 Kroese et al. 1995 |
| Foreign tuna longline | Offshore to beyond EEZ | Targeted/bycatch | Penny and Punt 1992 Kroese et al. 1995 |
| Recreational line | Inshore to 200m | Bycatch | Kroese et al. 1995 Penny et al. 1997 |
| Commercial handline | Inshore to 200m | Bycatch/targeted | Kroese et al. 1995 Penny et al. 1997 |
| Gill net | West Coast | Targeted | Freer 1992 Kroese et al. 1995 |
| Beach seine | West and South Coast | Targeted/Bycatch | Lamberth et al. 1994 Kroese et al. 1995 |
| Protective nets | East Coast | Incidental | Dudley and Cliff 1993 |
| Cage diving/tourism | South Coast | Cage diving | Various mimeos 1993-1997 (unpubl.) |
2. THE RESOURCE AND THE FISHERIES
2.1 Species composition of the fisheries
Several longline-directed fisheries exist (Table 1). These include the bottom hake-directed longline fishery (Japp 1994), the pelagic longline (local fleet) shark-directed fishery and the tuna-directed (foreign and local fleets) pelagic longline industry. These fisheries, with respect to the proportions exploited, have the highest level of shark targeting. Details of the shark catches in each of these fisheries have been published by Kroese et al. (1995).
Target species caught primarily for overseas markets, are the soupfin shark (Galeorhinus galeus), the houndsharks (Mustelus spp.), the blue shark (Prionace glauca), cowsharks (Notorhynchus cepedianus) and the mako (Isurus oxyrhincus). In the domestic pelagic (tuna-directed) longline fishery it has been possible to identify the target species (reference to targeting is somewhat ambiguous as tuna are the primary species, but shark are also targeted and are highly valued). Foreign pelagic tuna-directed catches have been more difficult to assess than the domestic fleet as large-scale under-reporting is known to occur. The foreign vessels (mostly from Japan and the Republic of China) catch species of a more oceanic nature such as the mako, blue, silky (Carcharinus falciformes), oceanic white tip (C. longimanus), threshers (Alopias vulpinus) and porbeagle sharks (Lamna nasus) ie. the inshore species such as the hound sharks and soupfin are excluded. Discard ratios are estimated to be high (Bonfil 1994, Kroese et al. 1995) if compared to known catch rates in other areas of the world. A more recent fishery in which small quantities of shark are also known to be caught is the longline fishery in Antarctic waters for patagonian toothfish (Dissosotichus eleginoides). However, no details of the shark bycatch in this fishery are available but are reported to include mostly chimaeras, greenland sharks, porbeagles and some skate species.
Potentially the greatest impact on condrichthyans in South African waters is from the large bottom-trawl fisheries directing at the Cape hakes Merluccius paradoxus and M. capensis. The offshore and inshore fisheries target hake (TAC 151 000t), sole (TAC 872t) and horse mackerel (upper catch limit of 55 000t). Annual demersal landings, including all shark and other bycatch in the South African trawl fisheries varies from year to year and in 1995 approximated 180 000t (In recent years this figure has been reported to be well above 200 000t). Japp (1997) estimated discards of elasmobranchs in South African bottom trawl operations at between 80–98% (depending on the area), i.e. between 2–20% of the sharks caught in trawl nets are processed. Shark is therefore rarely processed on trawlers despite the often large quantities caught. More recently however, export prices for shark have increased (along with a favourable rand-$ exchange rate) making shark products more attractive. Species processed on trawlers include the biscuit skate (Raja straeleni), the soupfin and the St Joseph (Callorhinchus capensis). The most common trawl-caught shark on the Agulhas Bank is the dogshark (Squalus megalops), whose stock has been estimated to have a relatively high biomass (Japp et al. 1994). Landings of this species have increased, but they are generally considered too small for processing and marketing. Clearly the trawl catch of shark landed is a small proportion of the actual total chondrichthyan catch with many species discarded [see Compagno et al. (1991) for other sharks species caught in trawls]. The prawn-directed trawl fishery differs somewhat in their species catch composition to the larger industrial bottom-trawl fisheries. Fennessey (1994b) reported extensively on the elasmobranch bycatch in the Natal prawn fishery, and pointed out that catches were dominated by small rays. Smale (1997) reported that the annual shark catch in Natal waters (all fisheries) is insignificant compared to the larger hake-directed trawl fisheries, with the dominant species landed being grey sharks, of which the most common is Carcharhinus obscurus (dusky shark).
Gill and beach-seine net fisheries have operated on the South African west coast since 1652 and a directed gill-net fishery for St Joseph shark (C. capensis) was initiated in 1980. Other elasmobranchs caught in gill nets (not necessarily bycatch as they are also an important economic component of the multi-species shark-directed fishery) include soupfin and hound sharks and also, depending on location, sandsharks (Rhinobatus annulatus). Beach Seine Net fisheries target mostly bony fish species, although significant quantities of elasmobranchs are frequently caught (Lamberth et al. 1994), comprising on average 70% skates and rays including sandshark, bull rays (Myliobatis aquila), and blue rays (Dasyatus chrysonata). These are usually not retained.
Recreational line fisheries occur around the entire South Africa coast and include shore anglers (rod and line), skiboats (rod and line), estuarine fishermen (light tackle, rod and line) and spearfishermen. Sharks are generally not desired by recreational fishermen although they are targeted extensively in competitions. In Natal, the sharks most commonly targeted by recreational fishermen include dusky sharks (and the closely related bronze whaler C. brachyurus), sandsharks, milksharks (Rhizoprionodon acutus) and skates (Dasyatidae). Houndsharks (Mustelus spp.) are also often caught in large numbers in estuaries.
Commercial line fisheries have historically targeted sharks. Due to highly variable markets, shark catches have fluctuated dramatically in the past, although since 1991 there has been a steady increase in catches. Preferred species include the soupfin and houndsharks, and also the dusky sharks (C. obscurus), copper sharks or bronze whaler, spotted gully sharks (Triakus megalopterus), threshers, cowsharks (Hexanchidae), dogfish (Squalus spp.), catsharks (Poroderma spp.) and skates (Dasyatidae). With the exception of the soupfin, hound and bronze whalers, most other species are discarded.
Two other non-directed fisheries exist which require management. These are the protective shark nets around the popular bathing beaches on the east coast and the growing tourist shark cage-diving industry on the southern and western Cape Coast. The incidental bycatches in the protective nets have been well documented (Dudley and Compagno 1994) and raised some interesting management issues. These fisheries are reviewed by Dudley and Gribble (this volume). Further, the cage-diving issue has introduced new perspectives in the shark industry with some obvious management implications. Appropriate legislation and enforcement is in the process of being formulated. The concerns re the potential impact (e.g. mortality, behavioural changes feeding adaptation) on the white shark (Carcharodon carcharius) as well as the lucrative financial returns have resulted in heated debate and questions of appropriate management and where controlling authority responsibility should be (exploitation, tourism, conservation, etc). Shark cage diving is likely to become a big tourist attraction, but a significant recent (1998) increase in the number of shark attacks resulting in a spate of deaths (bathers, surfers and divers) has highlighted user conflict (is shark cage diving and chumming attracting more sharks? etc.).
Continued deployment of the shark barrier nets as well as the shark cage diving industry is likely to affect the coastal tourist industry and both issues present new and exciting management challenges which will ultimately need to be integrated with other resource control measures.
2.2 Development, current status and means of prosecuting the fisheries
2.2.1 The harvesting process
Early evolution of the shark fisheries: There has been interest in shark fishing in South African waters since the arrival of the early settlers, but only after the beginning of this century has commercial exploitation been recorded. Fishing for sharks and the potential for greater exploitation was first reported by Von Bonde (1934) who estimated that at the time, shark fishing and associated by-products could generate up to £100 000. Directed shark fishing started in the early 1930s off Durban in Natal (using gill nets). These early catches are poorly documented, although Kroese (pers com.) estimated an annual production of 136t in 1931 and over 1000t by 1940 (Table 2). The Second World War gave rise to demand for vitamin A as a health supplement for soldiers and led directly to an increase in shark fishing as the regular supply of cod liver oil from the Northern Hemisphere was severely disrupted by the war (Von Bonde 1934, Kroese et al. 1995). A shark fishery was initiated in 1941, exploiting primarily soupfin shark. However, data on catches are sparse for the 1939–1945 period and the earliest documentation on shark catches is reported in Lees (1969) who gave total annual production estimates of shark liver oil towards the end of the war. Later, the Division of Sea Fisheries (1949, 1950) documented shark catches for 1948 (25000 sharks caught). Gear deployed included boats of up to 288 ton displacement using handlines, gill nets and short longlines. Catches as high as 1500t per trip were made and increased sharply from 1951 (Figure 2). Concern for the resource led to the formation of a Sea Fisheries Shark Advisory Committee in 1948 to investigate the soupfin shark fishery which resulted in the introduction of a minimum mesh size of 9" in 1948 (Division of Fisheries 1950).
| Year | Traw | Net | Line & longline | Other | Total |
|---|---|---|---|---|---|
| 1931 | - | - | 136.0 | 136.0 | |
| 1941 | - | - | 1367.6 | 1367.6 | |
| 1942 | - | - | 3100.0 | 3100.0 | |
| 1943 | - | - | 5674.3 | 5674.3 | |
| 1944 | - | - | 4607.3 | 4607.3 | |
| 1945 | - | - | 5145.6 | 5145.6 | |
| 1946 | - | - | 4109.2 | 4109.2 | |
| 1947 | 56. | - | - | 5931.4 | 5987.4 |
| 1948 | 49. | - | - | 6250.0 | 6299.7 |
| 1949 | 41. | - | - | 2500.0 | 2541.4 |
| 1950 | 39. | - | - | 1100.0 | 1139.0 |
| 1951 | 36. | - | - | 1826.3 | 1863.2 |
| 1952 | 35. | - | - | 3555.0 | 3590.9 |
| 1953 | 88. | - | 1351.3 | 1149.7 | 2589.7 |
| 1954 | 97. | - | 3040.5 | 1162.8 | 4300.4 |
| 1955 | 133. | - | 1163.4 | 1259.4 | 2556.6 |
| 1956 | 184. | - | 1496.1 | 1310.7 | 2991.5 |
| 1957 | 93. | - | 2096.0 | 1508.7 | 3697.9 |
| 1958 | 106. | - | 2594.2 | 1649.1 | 4349.6 |
| 1959 | 168. | - | 1665.0 | 1201.9 | 3035.3 |
| 1960 | 82. | - | 2861.0 | 1779.1 | 4722.3 |
| 1961 | 39. | - | 3209.0 | - | 3248.6 |
| 1962 | 84. | - | 2964.6 | - | 3049.1 |
| 1963 | 239. | - | 2172.5 | - | 2411.6 |
| 1964 | 75. | - | 2623.0 | - | 2698.6 |
| 1965 | 25. | - | 2424.4 | - | 2450.2 |
| 1966 | - | 3424.6 | - | 3424.6 | |
| 1967 | 111. | - | 2848.9 | - | 2960.8 |
| 1968 | 56. | - | 905.3 | - | 962.2 |
| 1969 | 39. | - | 406.1 | 20.0 | 645.5 |
| 1970 | 108. | - | 383.7 | - | 492.3 |
| 1971 | 124. | - | 221.8 | - | 346.1 |
| 1972 | 71 | - | 477.2 | - | 548.4 |
| 1973 | 52. | - | 217.5 | - | 270.2 |
| 1974 | 70. | - | 162.0 | - | 232.4 |
| 1975 | 143. | - | 161.0 | 284.5 | 588.5 |
| 1976 | 373. | - | 198.0 | 59.5 | 63.2 |
| 1977 | 700. | - | 195.3 | 298.6 | 1194.0 |
| 1978 | 1277. | - | 1196.7 | 842.3 | 3316.6 |
| 1979 | 1859. | - | 680.0 | 106.0 | 2645.0 |
| 1980 | 1659. | - | 595.0 | 106.0 | 2360.0 |
| 1981 | 1772. | 263.0 | 206.3 | 106.0 | 2347.3 |
| 1982 | 2305. | 156.0 | 145.1 | 106.0 | 2712.1 |
| 1983 | 2102. | 542.0 | 62.4 | 106.0 | 2812.4 |
| 1984 | 2155. | 478.1 | 42.2 | 106.0 | 2781.3 |
| 1985 | 2012. | 687.0 | 103.2 | 106.0 | 2908.2 |
| 1986 | 1664. | 485.6 | 178.3 | 106.0 | 2433.9 |
| 1987 | 1622. | 509.4 | 250.4 | 106.0 | 2487.8 |
| 1988 | 1728. | 409.7 | 232.8 | 106.0 | 2476.5 |
| 1989 | 1720. | 478.3 | 249.5 | 106.0 | 2553.8 |
| 1990 | 2061. | 221.3 | 230.7 | 106.0 | 2619.0 |
| 1991 | 1765. | 294.4 | 376.1 | 106.0 | 2541.5 |
| 1992 | 1876. | 208.3 | 697.0 | 106.0 | 2887.3 |
| 1993 | 1969. | 346.0 | 688.9 | 106.0 | 3109.9 |
| 1994 | 1257. | 39.0 | 556.1 | 106.0 | 1958.1 |
| 1995 | 1015. | 114.0 | 305.3 | 106.0 | 1540.3 |
| 1996 | 1125. | 78.0 | 233.5 | 106.0 | 1542.5 |
| 1997 | 1408. | 91.0 | 315.9 | 106.0 | 1920.9 |
Figure 2
Reported landings of chondrichthyans in South African separated by fishery type
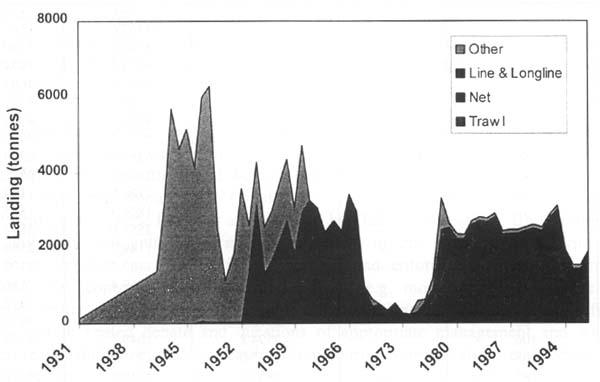
Production of Vitamin A gradually became unprofitable, although fishing continued until 1975 with the last reported production of Vitamin A in 1975 (Director of Sea Fisheries 1980). These trends are illustrated in Figure 2 where the estimates of total catch, based on Vitamin A production from 1941–1951, are shown and include line and gill net estimates between 1951–1975 (data supplied by Kroese) At its peak in 1948, the Vitamin A fishery was estimated to have caught over 6000t of shark (mostly soupfin) and from 1951–1970 fluctuated between 1000 – 3000t/yr. Up to this point little or no trawl catches were reported. Prior to the declaration of the 200 nautical mile fishing zone in 1977, massive over exploitation by foreign trawl fleets took place in South African waters, particularly in the Benguela Region, where hake catches were reported to have exceeded over 1 000 000t. The shark industry began moving away from oil production to selling shark as food fish with the first reports of 200t of dried shark being sent to Central Africa in 1954. Sales of frozen shark to Europe, the Far East and Australia gradually increased. A significant drop in sales of dried meat occurred in 1968–1972 as a result of concern over the high mercury levels in shark meat. However demersal trawlers began landing shark again in 1979. Only since the declaration of the EEZ was a measure of management and control in the large industrial trawl fisheries introduced. The first TACs in the trawl fishery were introduced in 1978 (for hake and sole) and it is only since then that reliable reports of elasmobranch catches in trawls have been submitted.
2.2.2 Recent catch, effort and fleet characteristics
2.2.2.1 The trawl fishery
The historical growth of the shark fisheries in South Africa is illustrated in Figure 2. Clearly, the largest sector exploiting shark is the large-scale commercial bottom-trawl fishery. As noted before, the actual impact on the stock from these fisheries is significantly higher if the discard proportions are also considered. The Inshore Trawl Fishery based on the south coast (Japp et al. 1994) has a relatively small total catch (14 000t approximately) compared to the 180 000t (average) of the Offshore Trawl Fishery. However, the inshore sector lands the highest proportion of shark. This can be attributed to several factors of which availability is the most important. Inshore fisheries generally are limited to inside of the 110m isobath and fish almost exclusively on the Agulhas Bank. Abundance of shark, particularly the preferred species, (including soupfin shark and biscuit skate) is high in these areas. The Agulhas Bank is known for its high species diversity, mixture of temperate and sub-tropical waters and highly variable substrate (Japp et al 1994.)
Since the 200 n.m. EEZ declaration, trawl fleet characteristics have changed significantly. The large foreign factory trawler freezers of the former communist bloc states (e.g. Russia, Bulgaria, Poland) as well as some European fleets (e.g. Spanish and Portuguese) were banned from fishing within South African territorial waters. Fishing effort declined sharply and was followed by a conservative management strategy aimed at rebuilding the hake stocks, the primary commercial species. This process continues and the hake TAC has gradually increased from under 100 000t to its present level of 151 000t (1997). Under this management regime, little control was placed on non-quota bycatch species, of which shark comprised a relatively small part of the total landings (<1%).
Vessels in the offshore fleet (an average of 100 vessels in the fleet) range from the smaller wet-fish stern trawler (30–50m in length, <1000grt) to the larger factory freezer vessels (>50m and >1000grt). Mostly otter trawls are used and operations are conducted almost entirely from the west coast ports of Cape Town and Saldanha Bay. Mesh regulations aimed at hake (110mm minimum stretched mesh) probably have no selection effect on sharks, i.e. all sizes and species are retained Effort levels are controlled by vessel licensing only, with as far as possible, limitation on the build up of excess capacity (aimed at optimising the effort levels required to catch the hake TAC). The application of F0.2 was intended to rebuild hake biomass to 60% of its estimated pristine stock size and to simultaneously increase catch rates. This has to some extent been achieved, but not only have catch rates improved slowly, but increasingly greater quantities of bycatch have been landed. Several factors are believed to have caused this, such as increased vessel efficiency, greater abundance of non-target species, increased targeting on non-quota species and, most importantly, retention of a greater proportion of bycatch. This is believed to be a result of more efficient utilisation and increased demand (with improved returns) for bycatch. Although a major portion of the bycatch is shark, they have been a relatively minor component of the total trawl landings since 1976, i.e. discarding is high.
The smaller inshore fishery has been affected in a similar way to the deep-sea fleet. Inshore vessels are generally smaller than their offshore counterparts with the majority between 20—30m (33 vessels in total). Most are stem trawlers, although historically the bulk of the fleet were side-trawlers. Operations are conducted mostly from the smaller south coast ports of Mossel Bay, Gansbaai and Port Elizabeth. Inshore vessels are not limited to depth (the offshore fleet are not permitted to fish shallower than 110m) and also only have a 75mm stretched mesh restriction. This may account in part for the higher shark catch, but generally the reasons outlined before are assumed to be the major contributing factor. The largest portion of the inshore shark catch comprises the biscuit skate (wings and hound sharks) are being increasingly retained. In 1995, shark comprised 0.6% (84t), and skate 6.1% (934t) of the total inshore landings (15 265t). By comparison in the same year, the deep-sea fishery landed only 39t of shark species, which was <1% of the total landings (159 311t).
Compared to the inshore and offshore hake-directed fisheries, the Natal prawn fishery is relatively small, landing 511t in 1995, of which no shark landings were reported (consisting of small <1m long sharks discarded at sea). Records of early shark catches are poor with some reports in 1931/32 when catches comprised mostly of large tiger (Galeocerdo cuvieri) and zambezi sharks (Carcharhinus leucas). Thereafter effort is reported in the 1940s and shifted to the Western Cape (Saldanha Bay, False Bay and Gansbaai) targeting soupfin shark for the Vitamin A market.
2.2.2.2 The line and longline fisheries
The “line gear sector” component of the total shark landings is shown in Figure 2. This group, if combined, makes up the second largest gear sector (after trawls) exploitating sharks. Specific permits (“L” or “Shark Permits”) are issued for the directed targeting of shark using longlines by the South African Department of Sea Fisheries. Between 1991–1994, 31 permits were issued annually, and in 1995 the number increased to 35. No effort, or quota control, is enforced, although permits are limited to smaller “tuna” with the intention of augmenting the out-of-season activities of these vessels. Generally, vessels are <30m in length and deploy bottom longlines with up to 3000 hooks per set in water depths from 50–450m. South African shark permit holders target predominantly large pelagic shark species, including the mako, blue shark and soupfin. Vessels operate mostly from Cape Town, although activity is directed seasonally on the South Coast (Mossel Bay landings). A recent development is an attempt to reduce the number of foreign tuna longline permit holders and to increase the permits issued to local fishermen. In 1998 thirty tuna permits were issued to “locals” for tuna directed longlining. Although sharks are still caught, the issue of these permits is highly contentious since most of the effort is directed at the lucrative swordfish market.
Foreign tuna-directed longline fishers also exploit sharks (assumed bycatch). Effort is seasonal, following the migration routes of the target tuna species, i.e. with vessels moving into and out of the South Africa fishing zones, mostly from August to November. In 1997, foreign tuna permits were issued to 90 Japanese and 30 Republic of China vessels, although not all were active inside the South Africa fishing zone. Of the estimated 10 000t total catch reported by these vessels in 1994, only 1.7 – 6.7% was shark (Japanese figures only). A 115t live weight (shark) catch was reported by foreign vessels in 1994. Kroese et al. (1995) estimated that 753t is probably a more representative catch, i.e. an 85% discard proportion.
Hake and kingklip (Genypterus capensis) bottom-directed longlining has a small shark bycatch. In the period 1983–1989 during when an experimental kingklip-directed fishery operated, Japp (1993) recorded mean annual shark landings in this fishery of 73t. This was an obvious gross underestimate because of extensive under-reporting and discarding at the time. Similarly, the hake-directed experimental fishery from 1994–1997 (using demersal lines) reported only small quantities of shark landings. Gear deployed in these two fisheries was similar with vessels operating in depths from 100–600m and shooting from 2000 to 17 000 hooks per day (depending on vessel size and area). The most heavily fished areas were off the southwestern tip of the Cape of Good Hope in approximately 300–400m water depth, and on the south—east coast off plettenberg Bay in 250–350m water depth (Japp 1995). The potential for this fishery to take larger quantities of shark is high although bycatch is limited to 10% kingklip and 10% other species (including shark). At the time of submission of this report the hake-directed fishery became a managed fishery and a 6400t hake longline quota granted. Assuming a 10% bycatch, the demersal longline-directed shark catches are unlikely to exceed 640t though an amount this high is improbable.
Recreational and commercial line fishers also exploit shark. Operations are mostly shore-based or from small ski-boats (<10m) operating from small boat harbours and beaches out along the entire coastline. These fisheries traditionally targeted bony fish species, but with the sharply declining catches of the popular “linefish” species, as well as the improved market for shark meat, targeting on sharks has become more frequent since 1991 (Penney et al. 1991). Operators with small boats are generally limited to short distances from their home base, although some larger commercial vessels fish more widely and for longer periods (up to a week). Gear is limited to rod/hand line and to a maximum of 15 hooks per line. The main species targeted are the soupfin, hound and bronze whalers sharks. Catches of line-caught shark vary from area to area and seasonally with the largest proportion landed in the Cape (90%) area and the remainder in Natal. Between 1991 and 1993 reported landings of shark in the line fishery varied between 183 – 524t. In 1995 and 1996 a total of 503t and 299t respectively was landed. However, the catch returns of this sector are extremely unreliable and it can be assumed that significant under-reporting occurs.
2.2.2.3 Net fisheries (shore-based)
Commercial net fisheries are found mostly around the Cape coast and are essentially low-effort subsistence fisheries. Shark-directed gill netting for St Joseph is done on the Cape west coast, for example, and in numerous estuaries and river mouths. Nets are of different types and construction and include surface drift nets, anchored set-nets and beach-seine nets. Beach seine nets are deployed either by dragging the net through the surf, or using a small boat, and then hauling by hand or vehicle. Bottom-set gill nets used for St Joseph are 75m long, 2.28m deep with a stretched mesh of 17.6cm. Catches of sharks in both the gill and seine net fisheries are low and in 1993 included 309t of St Joseph, 2t of soupfin, 26t of rays and 9t of other shark species. Catches in seine nets comprise mostly juveniles (Lamberth et al. 1994). Sharks are also caught incidentally in the protective nets on the Natal coast, with landings estimated at 106t/yr since 1989.
3. ECONOMICS AND MARKETS
3.1 Historical markets
The economic potential of shark fishing was first noted by von Bonde (1934) who noted that virtually the whole shark carcass could be used for various products such as meat, skin (shagreen), fins, fertilizer and oils. As noted earlier, the advent of the Second World War and the demand for Vitamin A was perhaps the single biggest stimulus for exploiting shark in the past. Towards the end of the Second World War South Africa was producing 6 million vitamin A units per year valued at £300 000 (Lees 1969). Thereafter, in the 1950s, shark meat (trunks) was exported to other countries in Africa. Markets in Australia and the Medittereanean countries also opened up in the 1960s until the “mercury scare” in 1968. Shark exports overseas and to Africa subsequently declined and by 1972 were minimal although shark fin exports to the Far East continue to be a valuable export product. Generally shark fishing has never enjoyed a high profile, competing in South Africa with an abundance of other marine resources, particularly the large commercial trawl operations focussing on the whitefish market (local and export). During the last ten years shark exports from South Africa have begun to increase again. This may be attributed to several factors, including:
3.2 Local markets
At present, most of the shark processing is done in and around Cape Town in areas where most of the fish are landed. Estimated landings, landed value and wholesale value for 1994 and 1995 by species and fishery is given in Table 3 (compiled by the economics unit of Department of Sea Fisheries - Cape Town).
Generally the big commercial trawl operations do not process much shark which is done mainly by small localised factories that have developed specific overseas markets and joint venture arrangements. Many of these factories are located near to the landing points, such as in St Helena Bay (near the gill-net fisheries), in Cape Town (near many of the “line and longline” catchers) and Gansbaai (small localised line and net fishers). The exact size of the markets is difficult to judge. Locally, small amounts are sold throughout the country in the form of frozen fish, dried fish (“biltong”) or smoked. Most of the inshore trawled shark is also sold locally, including skate wings (“Ocean Fillets”) and St Joseph (“Silver Flake”); however, the main market is for export product.
| Fishery | Nominal catch (t) 1994 & 1995 | Species | Landed value (rand/t) 1994 & 1995 | Total value (rand-wholesale) |
|---|---|---|---|---|
| Offshore trawl | 37 & 33 | St Joseph & shark | 430 & 460 | 13 000 & 13 000 |
| Inshore trawl | 1121 & 934 | Skate | 800 & 860 | 224 000 & 201 000 |
| Inshore trawl | 116 & 84 | Shark | 430 & 460 | 21 000 & 16 000 |
| Inshore trawl | 234 & 227 | St Joseph | 430 & 460 | 101 000 & 104 000 |
| Line & longline | 498 & 298 | Shark | 2200 & 2500 | 109 800 & 745 000 |
| Nets (gill & seine) | 32 & 139 | St Joseph | 600 & 1000 | 43 000 & 200 000 |
| Nets (gill & seine) | 6 & 9 | Shark | 1500 & 2000 | 9 000 & 19 000 |
| Total | 2044 & 1724 | All | - | 1 509 000 & 1 298 000 |
3.3 Export markets
Frozen shark meat (trunks mostly) and dried fins are exported. The main buyers of frozen shark are Australia, Greece and Italy where a healthy demand for shark meat has persisted. Other smaller markets exist, e.g. one South African processor purchases St Joseph from the net fishers at R1–10/kg ($0.23/kg) and exports fillets to the Democratic Republic of Congo at R8–00/kg ($1.66/kg). Other shark species exported include fillets of the soupfin and hound sharks. Belly flaps are removed and the fish are filleted. Import and export amounts and estimated revenues are given in Table 4.
| Country | Imports | Exports | Exchange | ||||
|---|---|---|---|---|---|---|---|
| Weight (t) | Value (rand) | Value ($) | Weight (t) | Value (rand) | Value ($) | rate (rand/$) | |
| Product: Frozen shark | |||||||
| Australia | 16.56 | 181 927 | 40 428.22 | 4.50 | |||
| Belgium | 4.44 | 35 106 | 7 801.33 | 4.50 | |||
| Germany | 7.46 | 20 808 | 4 624.00 | 4.50 | |||
| Greece | 65.18 | 279 473 | 62 105.11 | 4.50 | |||
| Hong Kong | 5.00 | 5 357 | 1 190.44 | 4.50 | |||
| Italy | 57.24 | 416 797 | 92 621.56 | 4.50 | |||
| Japan | 0.95 | 1 428 | 317.33 | 4.50 | |||
| Netherlands | 12.36 | 61 775 | 13 727.78 | 4.50 | |||
| Taiwan | 21.35 | 32 027 | 7 117.11 | 4.50 | |||
| Product: Shark fins | |||||||
| Hong Kong | 14.60 | 1 657 866 | 568 930.14 | 4.50 | |||
| Japan | 26.07 | 172 838 | 38408.44 | 3.30 | 403 235 | 89 607.78 | 4.50 |
| Singapore | 0.07 | 15 494 | 3 443.11 | 4.50 | |||
| Taiwan | 10.09 | 74 090 | 16464.44 | 4.50 | |||
Note: The latest available import and export figures are for 1995 only. Recent (1997/97/98) exports markets aresimilar but with more emphasis on the Australian market for frozen shark and the east for shark fins.
Because of the mercury content, fish over 7 kg are not exported as stringent tests for mercury in Australia are likely to reject fillets from the larger fish. Product is exported at approximately R11-50kg ($2.39/kg). Larger fish (>7kg) are exported to Italy and Greece, after quality control tests are done in South Africa. Another smaller company based in Cape Town exports almost entirely to Australia. Preferred species are the soupfin (R4–50 landed price) and the hound sharks (R5–50 landed price). This same company exports larger shark as well, including the carcharhinids, mako, blue and cow sharks. Export prices obtained approximate Au$2.60 to Au$4.00. Other shark products include a small market for jaws and teeth and fins.
3.4 Revenue, profitability and the workforce
Economic evaluations of sharks fisheries in South Africa have generally not being given a high priority. Annual economic reviews of the different fisheries sectors conducted by the South Africa Department of Sea Fisheries have not previously considered shark catches separately. The 1994 and 1995 economic assessments are presented in Table 3 (after De Swardt 1997). Import and export masses with local and $US estimated values from 1990 to 1995 are shown in Table 5 below (after Stuttaford 1993–1997).
The value of exported frozen shark peaked in 1993 at just over 1 million rand ($283 000) and for shark fin at 4.1 million rand ($907 000) in 1995. The difference between the two is significant as it illustrates the huge disparity in value between the two products and the Japanese demand for fins. It is also worth noting that the market for shark fin has caused repeated demands for increased monitoring and control of the shark fishery as the industry has been perceived as wasteful with misreporting high (only a fraction of the presumed catch is reported and on the basis of the known quantities of shark fins exported the catch is assumed to be significantly higher than that reported).
The returns of the different fisheries in which shark are either targeted or are a bycatch is somewhat variable. For example in the directed tuna longline fisheries (foreign) the shark bycatch is a small, but profitable, component of the total catch and as indicated in Table 5 shark fin commands a high price. The two directed shark fisheries in South Africa (local fishermen only) are economically marginal. Several factors influence the profitability of the local shark fisheries. These include:
The declining value of the South African rand in recent years has increased the viability of exploiting shark for export;
Development of overseas markets and a more favourable political climate (South African products are now politically acceptable overseas);
Development of local processing facilities and greater awareness of the value of shark by local fishers;
Effective use of vessels permitted to fish with different licences. Seasonality of many of the smaller fisheries in South Africa is a major factor in profitability. For example expansion in the 1960s and 1970s of the tuna pole-directed fishery resulted in a build up of excessive vessel capacity. As the tuna catches declined and the season shortened many boat owners began desperately sought alternative stocks to exploit to maintain year-round income and to keep vessels and crew active. Many vessels now carry permits enabling longline tuna and shark, handline and more recently hake-directed bottom longline fishing.
No subsidizes are given to the gear sectors exploiting shark (either as target or bycatch species). In the past a Fisheries Development Unit was established that provided financial assistance for the development of fishing capacity (boats, harbours, etc). More recently, this function has been taken over by the Small Business Development Corporation (SBDC), which provides favourable terms for financing and training for the establishment of small businesses and has been extensively used by entrepreneurs to purchase their own boats (which resulted partly in the growth of the excess capacity describe above). The SBDC continues to function (1998) and provide support for new or potential boat-owners or holders of new access rights.
The Fisheries Workforce is somewhat diluted and integrated into the different fishing sectors. In most cases, due to the seasonal nature of many of the fisheries, the workforce is transient or semi-permanent. Most shark fishing vessels vary in length from 15–30m, averaging 22m overall. Shark fishing operations using longlines and handlines are labour intensive and most vessels have to increase their crew limit safety certification to enable them to carry more workers. On average each vessel carries 15–22 crew of which only 4–5 may be permanent. Recent changes in the Labour Relations Act have enforced better working conditions and income for crew. The small gill-net fishery on the Cape coast started as an artisanal fishery and has evolved into a full commercial operation. However direct employment remains small (10–20 fishers deploying nets) with a small factory work force in the St Helena and Saldanha Bay areas.
| Year | Imports | Exports | Exchange | ||||
|---|---|---|---|---|---|---|---|
| Weight (t) | Value (rand) | Value ($) | Weight (t) | Value (rand) | Value ($) | rate (rand/$) | |
| Product: Frozen shark | |||||||
| 1990 | 0.49 | 243 | 66.58 | 141.52 | 378 545 | 130 710.96 | 3.65 |
| 1991 | 0.00 | 0 | 0.00 | 180.22 | 735 011 | 201 372.88 | 3.65 |
| 1992 | 22.88 | 33 970 | 9 306.85 | 177.56 | 608 122 | 166 608.77 | 3.65 |
| 1993 | 0.95 | 1 428 | 391.23 | 189.58 | 1 033 270 | 283 087.67 | 3.65 |
| 1994 | 9.48 | 14 505 | 3 626.25 | 186.06 | 1 011 626 | 252 906.50 | 4.00 |
| 1995 | 0.00 | 0 | 0.00 | 152.69 | 783 448 | 174 099.56 | 4.50 |
| Product: Shark fins | |||||||
| 1990 | 0.00 | 0 | 0.00 | 0.00 | 0 | 0.00 | 3.65 |
| 1991 | 30.80 | 78 966 | 21 634.52 | 54.49 | 927 219 | 254 032.60 | 3.65 |
| 1992 | 56.18 | 1 098 031 | 300 830.41 | 55.85 | 2 637 715 | 722 611.64 | 3.65 |
| 1993 | 36.18 | 246 928 | 67 651.51 | 17.97 | 2 076 595 | 568 930.14 | 3.65 |
| 1994 | 47.24 | 431 703 | 107 925.75 | 95.47 | 240 565 | 60 141.25 | 4.00 |
| 1995 | 15.58 | 92 308 | 20 512.89 | 95.67 | 4 083 004 | 907 334.22 | 4.50 |
4. MANAGEMENT OBJECTIVES
4.1 Introduction
South Africa has been in an important phase in the history of their fisheries. After a period of political transition in 1994, emphasis was subsequently placed on the formulation of a fisheries policy. Central to the policy debate was the sensitive issue of access rights and how compensation for past discriminatory political policies could be addressed. After over two years of formulation the new Fisheries Policy was tabled as a White Paper in mid 1997 and the Bill (precursor to the Marine Living Resources Act) put before parliament in November 1997. The Act was subsequently passed in May 1998 and at the time of completion of this paper (August 1998), was due for promulgation (along with the new Sea Fisheries Regulations). The last four years have been a critical period for fisheries in South Africa. As the process of policy development has taken a long time, management during this period was in the unenviable position of having to delay decisions and limit enforcement (due to the uncertaintly and changes to the legal framework). These protracted processes did, to some extent, inhibit the recent management of shark fisheries in South Africa, at a time when it was needed most and when there was growing interest in exploitation of the resource and increased demand for access rights. Alas, shark fisheries in South Africa, as in many other parts of the world, have been given very little management attention.
While management of chondrichthyan fisheries in South Africa has been neglected, it has been made more difficult through the recent political changes and uncertainty in policy development. Up to 1994 management of South African fisheries was the responsibility of the Directorate: Sea Fisheries (a department in the Ministry of Environmental Affairs and Tourism). Fisheries in South Africa have rarely been considered high profile in a political sense and have frequently been moved between ministries or had ad hoc changes of Ministers (which further affected continuity of policy and management). Management of Fisheries in South Africa from a legislative perspective operates at three levels - the primary level being the Sea Fisheries Act; second, the Sea Fisheries Regulations; and at the lowest level, permit conditions. Within these structures laws and regulations can be introduced, or changed, to accommodate management of a particular resource or fishery.
Perhaps more relevant to the fisheries management objectives than the past or existing laws, is the status quo and pending legislation. The situation in South Africa with respect to the development of fisheries policy is of interest. Formulation of a Fisheries Policy started in 1995 and took two years to develop (Marine Policy 1997). Final acceptance of the policy in mid 1997 led to the formulation of the Marine Living Resources Act (1998) that was accepted and passed by parliament in early 1998. At the time of submission of this report the new act was expected to be promulgated in August or September 1998 (promulgation was pending the revision of the Sea Fisheries Regulations) and will effectively go on trial in the next few years.
Management of shark stocks and the fisheries that exploit these stocks is unlikely to be significantly different from past management under the old Sea Fisheries Act and regulations. Objectives of the new act encompass optimal utilisation principles, the precautionary approach. preservation of marine diversity, broad and accountable participation in decision-making and heeding to international laws. Perhaps the most significant change from past policies is the stated objective of “restructuring the fishing industry to address historical imbalances and to achieve equity within all branches of the fishing industry”. This objective will undoubtedly influence all fisheries in the future, including shark fisheries as it embraces broader access rights and the need to increase management. control and surveillance. Bodies to be established under the new act include a Consultative Advisory Forum (effectively replacing the old Sea Fisheries Advisory Council) which will advise the responsible Minister on matters such as resource management, legislation, TACs, research, finances and importantly, Operational Management Procedures (OMPs).
With regard to shark fisheries, no OMP has been established. In the recent past however management advice on shark fisheries has been the responsibility of the Chondrichthyan Working Group (CWG) within the Sea Fisheries Research Institute (sub-directorate Sea Fisheries). This body was started in 1993 and comprises government and other scientists, environmental scientists, economists, management and numerical scientists. This body continues to provide scientific and management advice on shark fisheries in South Africa.
4.2 Objectives for the management of the shark fisheries
No clear management objectives have ever been set for the exploitation of shark in South Africa as in the past, effort has always focussed on the larger commercial (industrial) fisheries. This changed with the formation of the CWG which effectively recognised the need to supply management advice on the exploitation of chondrichthyans. An unpublished report (mimeo) submitted in February 1994 (wg/shk/94/Feb/2) was titled “Progress towards the development of an integrated management approach to fisheries for sharks and other chondrichthyans in South African waters”. This report outlined shark fisheries in South Africa and noted the status of the stocks and different harvesting techniques relative to fisheries worldwide for shark. A follow-up report in 1995 (Kroese et al. 1995) gave a further overview of shark catches and bycatches in South African fisheries. Both reports however made little reference to management objectives and focussed primarily on the past and present history of the shark exploitation in South Africa.
The management authority at Sea Fisheries: Cape Town has however embraced the concept of responsible and sustainable utilization as well as following the FAO-recommended Precautionary Approach. These concepts are clearly stated objectives in the new Marine Living Resources Act. Enforcement, monitoring and control remain major problem areas in South African fisheries. A generally weakened management and controlling authority has focussed on priority areas, of which sharks are at the bottom of the list.
4.3 The objective setting process
The process of setting objectives in the South African shark fisheries has to date been limited but can be broadly described as follows:
Identification of affected resources, fisheries concerned and responsibility;
Discussion and preliminary analysis/reports at the CWG level. This body is a diverse group consulting with shark specialists nationally and internationally;
Assessment of the stock (as far as possible) and submission of advice (management objectives) to the Director: Sea Fisheries Research Institute;
Acceptance/rejection/re-evaluation of advice and submission for acceptance to the Sea Fisheries Advisory Council (SFAC) and the Chief Director: Sea Fisheries;
If considered necessary the Chief Director may request final approval from the Minister.
Legal authority remains with the Department of Sea Fisheries and its sub-directorate (Exploitation Control). The objectives are therefore explicitly addressed at different levels - firstly at the working group (scientific) level, then management (research/administration/exploitation control) and if deemed necessary at the SFAC and Ministry level. As has been pointed out before however, the above process will be revised on promulgation of the new act. It is likely that the primary role of providing scientific and management advice will be retained by the CWG. However the new bodies, including the CAF and the Fisheries Transformation Council (appointed by the Minister to address equity and balance in the fishing industry) will ultimately be responsible for ensuring objectives are met (these include scientific and socio—economic objectives as well as access rights).
4.4 Administration of shark fisheries in South Africa
The body that in the past (and will do so until the new act is promulgated) was delegated the responsibility of allocating fishing rights was the Quota Board. The Quota Board's responsibility extends only to the allocation of rights for resources in which a global TACs have been set. Promulgation of the new act will effectively make the quota board defunct and the granting of access rights will revert to the Minister (based on advice from Sea Fisheries) and, as prescribed by the Minister, also to the Fisheries Transformation Council. Access to TAC-controlled resources has therefore, in the past, been closed and subject to Quota Board control. Once allocated a quota, no long-term rights are guaranteed although quotas can be transferred (on application) or sold.
There are numerous fisheries in South Africa for which there is no TAC control. These fisheries (of which the shark fisheries is an example), are not open access, but rather are managed through effort control and permit limitation as well as many other different criteria including gear restrictions, closed seasons, species/size/bag limit and percentage bycatch control. Preferential access has always been given to South African citizens and only South African registered vessels are permitted (there are exceptions to this rule).
4.5 Regulations and permit conditions pertaining to shark fisheries in South Africa
The first known records of any form of control was the introduction of a Sea Fisheries Advisory Committee in 1948 which resulted in the introduction of a 9" mesh size for gill nets. The use of gill nets without a permit is not allowed. Kroeseet al. (1995) reports that in 1995 there were 780 licensed gill nets and 166 beach seine nets. The nets used for catching the St Joseph shark are limited to 75m in length, 2.28m depth and a stretched mesh of 17.8cm. They may not be used within 500m of the high-water mark. The rights to these permits are “historical” and based on locality. They have traditionally been passed down through family generations and were originally used for fishing mullet (Liza richardsoni), but now include rights to catch shark (using a bigger mesh size than originally prescribed). The nets used in the protective fishery off Natal differ and are made up of panels 212m long and 6.1m deep with a mesh size of 25cm.
There are no limitations on the shark catches in the trawl fisheries although they are indirectly affected by the limits on the target species. Control of this gear sector is directed at the Cape hakes and include the setting of an annual TAC by area (West and South Coasts), effort control inshore (<110m water depth and 75mm mesh) and offshore (>110m water depth and 110mm mesh).
In the pelagic longline fisheries, permits are restricted in number (at present 35 shark or “L” permits issued). To avoid targeting on TAC-controlled species such as hake and kingklip, bycatch of these species is limited to ten and five fish respectively at any one time. Operators are not allowed to fish in closed bay areas and reserves. Fishers are also permitted to head and gut fish provided the vessel has a refrigerator on board, but must retain the head, gut and tail in the refrigerator until the catch is landed. These regulations also apply to the foreign tuna permit holders and more recently to the 30 new local longline tuna permit holders (as of 1998).
In the recreational line fishery, rock and surf fisheries and spearfishermen, fishers are not permitted to catch more than 10 chondrichthyans per day. Certain beach-seining and drift-netting operations also have a bycatch limit of 20 sharks and rays per day.
The only other regulation of significance to sharks is the protection given to the Great White Shark. Carcharodon carcharias. This regulation specifies that no one without a permit may catch, attempt to catch, or kill, a great white shark. Further it is illegal to purchase, sell or offer for sale, any great white shark, or any part, thereof. This legislation came about as a result of the increasing exploitation of this species and the associated trade in the animals products, e.g. jaws. Subsequent to the introduction of this legislation similar legislation was introduced in other areas of the world.
4.6 Discussion
The objectives of fisheries managers in South Africa have been laid down in a broad sense but in many examples specific fisheries have been neglected (though this is not the case with the larger fisheries). It is the nature of fisheries that in general, objectives and granting of access are never accepted by everyone. The introduction of OMPs in principle should result in easier decision-making and the setting of management protocols. For the minor fisheries, however, the formulation and acceptance of OMPs is somewhat distant, with priority being given to the larger industrial fisheries. The introduction of shark-directed pelagic longline permits for example was ad hoc and not based on sound management or objectives. As is often the case, exploitation preceded management and criteria based on capacity, resource status, gear type, etc., were not clearly identified before permits were issued. With the introduction of the new act, the formulation of OMPs, and the appointment of bodies aimed at equitable distribution should, with time, assist the management process.
The provisions for regulation and control of the exploitation of sharks in South Africa are clearly inadequate. Regulations are such that they are difficult to enforce and have been given insufficient management attention. Although the policy-setting process has evolved, the possibility that the controlling authorities will in the near future be more assertive with regard specifically to exploitation of shark, is low. The primary reason for this is the obvious uncertainty related to the introduction of the new act and also the reduction in capacity and expertise in exploitation control. Further, although structures are in place to manage the existing and potential fisheries, there are serious under-staffing problems and a lack of appropriate expertise. Under these circumstances, priority is expected to be given to the larger industrial fisheries.
On a more positive note however, the new fisheries policy, the Marine Living Resources Act and the Operational Management Procedures, as well as the introduction of formal criteria for the granting of fishing (access) rights, are likely to provide much improved management protocols and effective long-term resource control in the future.
5. THE MANAGEMENT PLANNING PROCESS
5.1 Introduction
The management and assessment of shark fisheries in South Africa has attempted to follow similar procedures to that employed in the larger TAC-controlled industrial fisheries. However there has been no complete assessment of either a shark stock or a specific shark fishery. Management advice has, as described earlier, been ad hoc and based on the ‘Precautionary Approach’. This includes advice that the introduction of extra capacity into the region be avoided and that permits should be limited and strictly controlled until such time as proper assessments are completed and there is more certainty and confidence in the status of the chondrichthyan stocks.
5.2 Fishery statistics
South Africa has an effective system of data capture and reporting for all fisheries. Permit holders are required to submit a daily catch log either monthly or on completion of a trip (depending on the fishery). Further, the amount of catch discharged is confirmed by a landing authority (Sea Fisheries Inspectorate) and both daily logs and Inspectorate landings are compared and entered into a comprehensive database.
Logbooks are designed for specific fisheries and may include for example daily effort (hooks shot in the longline fishery for example) and a full breakdown of the daily catch (target species, bycatch and discards). Misreporting and falsification of catches are of course problem areas, but these can normally be identified if imbalances in the log returns and landings are found. Obtaining log data from foreign longline operators has been particularly difficult due primarily to communication problems, poor understanding of the legislation and in many cases, simply no desire by the foreign fishermen to comply. Included in the new legislation is a commitment to introduce both vessel monitoring systems and observers and it is hoped this will increase control, particularly of foreign flagged vessels.
Fisheries data capture and quota control is the responsibility of Sea Fisheries and falls mainly within the duties of the Sea Fisheries Research Institute. At present, the data capture and database systems are separate for different fisheries. For example, the largest databases are those for the pelagic, demersal (trawl) and linefish fisheries. The mixed nature of the shark fisheries means that shark catches are captured on different systems making collation and control of data difficult. However, the existing fisheries will soon be integrated (and converted) into a single relational (SQL) data management system (integration includes administration, quota control and research data). In its existing form, access to the shark fishery data is possible through the individual databases. Extraction and utilisation of these data for catch control and assessment purposes are therefore the responsibility of researchers and technical officers responsible for each system.
5.3 Stock assessment
No complete stock assessment of the shark resource has been done and the appointment of a researcher and assessment specialist on sharks is relatively recent (mid 1997). Management advice has depended strongly on information from known shark fisheries. In particular the fishery for soupfin shark in Australia. As the development of an appropriate fishery model for shark is still in its infancy no in depth report on the procedure can be given. The assessment is based on the dominant commercial species Galeorhinus galeus (i.e. soupfin shark). Biological data and reference points for the assessment have been supplied by Freer (1992) and compared with the information for the identical Australian species. An age-structured surplus production model is being developed and it is hoped will ultimately be applied to other South African shark stocks. As with all other assessments carried out by the Sea Fisheries Research Institute, peer review is considered essential. South Africa has leaders in shark research (taxonomy and biology) as well as recognised modelling expertise.
No directed resource surveys for shark have been conducted, although regular sampling for biological parameters is done when possible on landings (if landed whole) and also during research cruises. Biomass estimates of shark based on directed hake bottom-trawl surveys are done annually. Because the areal expansion techniques deployed on these surveys are directed at hake, the indices of shark abundance derived from these surveys are treated cautiously, but are nevertheless useful.
5.4 Sustainability of the resource
The long history of shark exploitation in South Africa and the apparent low management profile does not bode well for the future of the stocks. The historical catch illustrated in Figure 2 suggests overexploitation and under-reporting. The trend in the South African fisheries mirrors those in fisheries where stocks have collapsed with a typical sequence of events:
a relatively unexploited (pristine) stock is exploited as a bycatch
with the efforts of pioneering fishermen the stock is investigated and a targeted fishery initiated
as the fishery evolves and is recognised as a solid revenue producer catch rates are high and capitalisation increases
scientists show concern for the stocks and management is initiated (South African shark fisheries would appear to be at this point)
the demand for access is in direct conflict with governments attempts to rationalise and limit effort, and finally,
the stock(s) either collapse or their fisheries become unprofitable.
This scenario is exacerbated by the biological vulnerability of sharks to over—exploitation, i.e. slow growth rates, low fecundity and availability/vulnerability to many different gear types.
6. SUMMARY AND CONCLUSIONS
South Africa has a long history of shark exploitation. The nature of this exploitation has been mostly non-directed and only a few small directed shark fisheries are active. Shark fisheries have in the past had a relatively low profile and management and control has been lacking. These problems have been exacerbated by the recent uncertainty in the existing and future legislation. Further, exploitation control and enforcement remain the single biggest problem area in South African fisheries. The highly diverse nature of shark fisheries further complicates enforcement. Legally the existing Sea Fisheries Act and regulations are sound, but in the case of shark fisheries, few prosecutions have ever been successful and there is a general reluctance to prosecute in the existing climate of change, as the chances of a successful conviction are remote. At the fishermen's level there is general uncertainty and insecurity re future access rights and only if security of access and tenure is assured, will responsible fishing be achieved. Fishers have indicated a willingness to accept on-board observers and satellite tracking as part of an integrated monitoring control and surveillance system.
Shark-directed fisheries are profitable, but in their existing forms are either a bycatch in an established fishery or augment other seasonal fishing operations. Markets are established and foreign exchange rates favourable. Management, although lacking in the past, is based on sound objectives and there are positive moves towards introducing Operational Management Procedures that comply with both pending local legislation and internationally trends. The introduction of resource assessment procedures for sharks has only recently been introduced and is ongoing. It is highly likely that most shark resources in South African waters have already been exploited to beyond sustainable levels and that in the future, stricter control and stock rebuilding will be needed.
7. ACKNOWLEDGEMENTS
The support and advice of the following is gratefully acknowledged: M. Kroese, C. Wilke, S. Du Plessis, H. Oosthuizen, J. Wissema, Dr A. Payne, Dr A. Badenhorst (all of the Sea Fisheries Research Institute), S. Matthews (Wildlife and Environment Society of South Africa). The approval of the Director.Sea Fisheries Research Institute (SFRI) in Cape Town is gratefully acknowledged.
8. BIBLIOGRAPHY
Bonfil, R. 1994. Overview of world elasmobranch fisheries. FAO Fisheries Technical Paper 341, Food and Agriculture Organization of the United nations, Rome, Italy. 119 pp.
Compagno, L.J.V. 1994. Preliminary report for the subequatorial African region, Atlantic, Indian, and Antarctic oceans. ICUN Shark Specialist group. 48 pp.
Compagno, L.J.V., D.A. Ebert and P.D. Cowley 1991. Distribution of offshore demersal cartilaginous fish (Class Chondrichthyes) off the West Coast of Southern Africa, with notes on their systematics. S. Afr. J. mar.Sc. 11:43–139.
De Swardt, K. 1997. Composition and size of the South African Fishing Industry for the year 1995. Internal document, Department of Sea Fisheries, Cape Town.
Director of Sea Fisheries 1980. Annual report. Rep. Div. Sea Fish. S. Afr. 33–40.
Division of Fisheries 1949–1957. Annual reports 1947–1956. Ann. Rep. Div. Of Fish. Dept. Comm. And Indust. S. Afr. No. 19–27.
Dudley, S.F.J. and G. Cliff 1993. Some effects of shark nets in the Natal near-shore environment. Environmental Biology of Fishes 36:243–255.
Dudley, S.F.J. and L.J.V. Compagno 1994. Appendix 3. Status of chondrichthyan resources in South Africa. In: L.J.V. Compagno, ICUN Shark Specialist Group. Preliminary report for the subequatorial African region, Atlantic, Indian, and Antarctic Oceans: 41–48.
Fennessey, S.T, 1994b. Incidental capture of elasmobranchs by commercial prawn trawlers on the Tugela Bank, Natal, South Africa. S. Afr. J. mar. Sci. 14:287–296.
Freer, D.W.L. 1992. The commercial fishery for sharks in the south-western Cape, with analysis of the biology of the two principal target species. Callorhinchus capensis (dumeril) and Galeorhinus galeus (linn.). Unpublished M.Sc. thesis, UCT, Cape Town. 103 pp.
Japp, D.W. 1993. Longlining in South Africa. In: L.E. Beckley and R.P. van der Elst (eds).Fish, Fishers and Fisheries. Oceanographic Research Institute, Special Publication No. 2: 113–117.
Japp, D.W. 1995. The hake-directed longline pilot study conducted from 23 May 1994 to 31 May 95. Unpublished Report, Sea Fisheries Research Institute, South Africa. WG/09/95/D:H:16 50 pp.
Japp, D.W. 1997. Discarding practices and bycatches for fisheries in the southeast Atlantic region (Area 47). In. FAO Fisheries Report No. 547. Technical consultation on reduction of wastage in fisheries. 338 pp.
Japp, D.W., P. Sims, and M.J. Smale 1994. A review of the fish resources of the Agulhas Bank. S. Afr. J. Sci. 90: 123–134.
Kroese, M., W.H. Sauer and A.J. Penny 1995. An overview of shark catches and bycatches in South African fisheries. ICCAT Collective volume of scientific papers 23 pp.
Lamberth, S.J., B.A. Bennett and B.M. Clark 1994. Catch composition of the commercial beach-seine fishery in False Bay, South Africa. S. Afr. J. mar. Sci. 14:69–78.
Lees, R. 1969. Fishing for Fortunes: The story in the Fishing Industry in Southern Africa - and the men who made it. Purnell, Cape Town. 283 pp.
Marine Living Resources Act 1998. Government Gazette, Republic of South Africa. No. 18930, 27 May 1998 67 pp.
Marine Policy 1997. A marine fisheries policy for South Africa - White Paper, 5 May 1997. CTP Book Printers (PTY) Ltd, Caxton Street, Parow, 7500 Cape Town. 46 pp.
Mimeo 1994. Progress towards the development of an integrated management approach to fisheries for sharks and other chondrichthyans in South African waters. (Internal document of the Sea Fisheries Research Institute: Cape Town). wg/shk/94/Feb/2.
Penny, A.J. and A.E. Punt 1993. The South Africa tuna fishery: Past, present and future. In: Fish. fishers and fisheries Proceedings of the second South African marine linefish symposium. Durban, 23-24th October 1992. Oceanographic Research Institute Special Publication No.2. Beckley, L.E. and R.P. van der Elst. (Eds.). Durban; Oceanographic Research Institute: p. 118–121.
Penny, A.J., R.G. Krohn and M.J. Smale 1991. Feeding precis for predatory fish and elasmobranchs the Benguela and Agulhas ecosystems. (Unpubl.) Penny, A.J., M.H. Griffiths and C.G. Attwood (eds) 1997. Management and monitoring of the South African marine line fishery. 87 pp.
Smale, M.J. 1997. Trade in sharks and shark products in South Africa: In: Trade Review: The trade in sharks and shark products in the Western Indian and southeast Atlantic oceans. Traffic. 101 pp.
Smale, M.J., B.A. Roel, A. Badenhorst and J.G. Field 1993. Analysis of the demersal community of fish and cephalopods on the Agulhas Bank, South Africa. J. Fish. Biol. 43 (Suppl.A): 169–191.
Stuttaford, M. 1993. South African Fishing Industry Handbook, 21st edition. Marine Information Services, Stellenrust, Stellenbosch. 334 pp.
Stuttaford, M. 1994. Fishing Industry Handbook: South Africa and Namibia, 22nd edition. Marine Information Services, Stellenrust, Stellenbosch. 401 pp.
Stuttaford, M. 1995. Fishing Industry Handbook: South Africa, Namibia and Mozambique, 23rd edition. Marine Information Services, Stellenrust, Stellenbosch. 433 pp.
Stuttaford, M. 1996. Fishing Industry Handbook: South Africa, Namibia and Mozambique, 24th edition. Marine Information Services, Stellenrust, Stellenbosch. 434 pp.
Stuttaford, M. 1997. Fishing Industry Handbook: South Africa, Namibia and Mozambique, 25th edition. Marine Information Services, Stellenrust, Stellenbosch. 415 pp.
Van Bonde, C. 1934. Shark Fishing as an industry. Union of South Africa. Department of commerce and industry. Fish. Mar. Biol. Div. Inv. Rep. 2: 1–19.
![]()
![]()
![]()