 |
TABLE A Estimated adult illiteracy rates by sex and region, 1980 and 1995 |
||||
| Region | Illiteracy rates (%) | |||
| 1980 | 1995 | |||
| Male | Female | Male | Female | |
| Developed countries | 2 | 5 | 1 | 2 |
| Southern Asia | 47 | 76 | 37 | 63 |
| Northern Africa and Western Asia | 45 | 74 | 32 | 56 |
| Sub-Saharan Africa | 48 | 71 | 33 | 53 |
| Eastern Asia and Oceania | 20 | 42 | 9 | 24 |
| Latin America and the Caribbean | 18 | 23 | 12 | 15 |
Source: UNESCO (1998, Table 2.2).
Table A shows that illiteracy rates for both males and females have decreased significantly, but the female illiteracy rate is still much higher than that of males except in the developed countries and Latin America.
Southern Asia has the highest female illiteracy rate (63 percent) as well as the widest discrepancy between males and females (26 percent). Northern Africa and Western Asia follow with 56 percent, respectively. Sub-Saharan Africa and Eastern Asia and Oceania then follow with 53 percent and 24 percent, respectively.
Although this table is not disaggregated by urban/rural residence, it is assumed that in developing countries where the rural/total population ratio is higher, the percentage of illiterate rural women will be proportionally higher.
TABLE B Life expectancy at birth, by region, 1980-1985 and 1995-2000 | ||||||
| Region | 1980-1985 |
1995-2000 | ||||
| Total | Males | Females | Total | Males | Females | |
| (years) | ||||||
| World total | 61 | 59 | 63 | 65 | 63 | 68 |
| More developed regions | 73 | 69 | 77 | 75 | 71 | 79 |
| Less developed regions | 59 | 57 | 60 | 63 | 62 | 65 |
| Least developed countries | 47 | 46 | 48 | 51 | 50 | 51 |
| Africa | 50 | 48 | 51 | 51 | 50 | 53 |
| Eastern Africa | 47 | 46 | 49 | 45 | 44 | 46 |
| Middle Africa | 48 | 46 | 50 | 50 | 49 | 52 |
| Southern Africa | 56 | 53 | 60 | 54 | 51 | 58 |
| Western Africa | 46 | 45 | 48 | 50 | 49 | 51 |
| Asia | 60 | 59 | 61 | 66 | 65 | 68 |
| Latin America and the Caribbean | 65 | 62 | 68 | 69 | 66 | 73 |
| Oceania | 70 | 67 | 73 | 74 | 71 | 76 |
Source: UN (1998a).
More developed regions comprise North America, Japan, Europe and Australia and New Zealand. Less developed regions comprise all regions of Africa, Latin America and the Caribbean, Asia (excluding Japan) and Melanesia, Micronesia and Polynesia.
Least developed countries, as defined by the United Nations General Assembly in 1998, include 48 countries, of which 33 are in Africa, nine in Asia, one in Latin America and the Caribbean and five in Oceania. They are also included under less developed regions.
The projections for the period 1995-2000 show a longer life expectancy for both sexes, except for a slight deterioration in eastern and southern Africa. Longer life expectancy for women is noted in all regions. A comparative analysis with the age structure in rural areas could give useful information about the ageing of rural populations and the variation of the proportion of rural women to document the so-called "feminization of agriculture" and, eventually, the "feminization of poverty".
TABLE C Anaemia during pregnancy in Asia, 1985-95* | |
| Country | Percentage of pregnant women with anaemia |
| India | 88 |
| Indonesia | 64 |
| Malaysia | 56 |
| China | 52 |
| Pakistan | 37 |
| Bhutan | 81 |
| Myanmar | 58 |
| Bangladesh | 53 |
| Philippines | 48 |
| Maldives | 20 |
| Nepal | 65 |
| Thailand | 57 |
| Viet Nam | 52 |
| Sri Lanka | 39 |
Source: UN (1998b).
* According to the most recent data available.
Anaemia is directly related to nutritional deficiencies. Iron deficiency affects about 43 percent of women and 34 percent of men in developing countries.
In Asia the majority of pregnant women are anaemic (see this Table; and UN, 1997), which poses a threat to the health status of their babies and increases the women's own risk of perinatal mortality. At the same time, it reduces the productivity of this economically active population group. In Asia, a high percentage of children still suffer from anaemia, which significantly reduces the development of children's cognitive capacities.
The persisting anaemia levels, especially in pregnant women and young children, call for an integrated approach such as that advocated by FAO/WHO in the International Conference on Nutrition, held in Rome in December 1992. Various perspectives and intersectoral activities are required, involving health, education, agriculture, extension, social planning, etc.
TABLE D Nutritional status of adults in India - percentage distribution of adults according to BMI grades* | |||||||||||
| BMI grades | RURAL | URBAN | POOLED | ||||||||
| Males | Females | Combined | Males | Females | Combined | Males | Females | Combined | |||
District nutrition profile (DNP) study | |||||||||||
| Number | 60 993 | 81 227 | 142 220 | 14 236 | 21 385 | 35 621 | 75 229 | 102 612 | 177 841 | ||
| CED III | >16 | 6.1 | 10.5 | 8.6 | 5.4 | 7.8 | 6.8 | 6.0 | 9.9 | 8.2 | |
| CED II | 16-17 | 6.7 | 8.6 | 7.8 | 5.7 | 6.4 | 6.1 | 6.5 | 8.1 | 7.4 | |
| CED I | 17-18.5 | 16.5 | 19.1 | 18.2 | 14.4 | 14.9 | 14.7 | 16.1 | 18.2 | 17.3 | |
| CED TOTAL | >16-18.5 | 29.3 | 38.2 | 34.6 | 25.5 | 29.1 | 27.7 | 28.6 | 36.3 | 32.9 | |
| Low normal | 18.5-20 | 21.3 | 20.4 | 20.9 | 19.8 | 17.5 | 18.4 | 21.0 | 19.7 | 20.4 | |
| Normal | 20-25 | 45.4 | 37.3 | 40.5 | 48.9 | 47.3 | 47.9 | 46.1 | 39.3 | 42.1 | |
| Normal | 18.5-25 | 66.7 | 57.7 | 61.4 | 68.7 | 64.8 | 66.3 | 67.1 | 59.0 | 62.5 | |
| Obese I | 25-30 | 3.7 | 3.6 | 3.7 | 5.4 | 5.4 | 5.4 | 4.0 | 4.0 | 3.8 | |
| Obese II | >=30 | 0.3 | 0.5 | 0.4 | 0.4 | 0.7 | 0.6 | 4.0 | 4.0 | 3.8 | |
| Obese (Total) | >=25 | 4.0 | 4.1 | 4.1 | 5.8 | 6.1 | 6.0 | 4.3 | 4.6 | 4.5 | |
NNMB survey | |||||||||||
| CED III | 10.7 | ||||||||||
| CED II | 11.5 | ||||||||||
| CED I | 26.3 | ||||||||||
| |
CED (Total) |
48.5 | |||||||||
Source: Government of India (1998).
* Weight in kilograms; height in metres.
The nutritional condition of the adult population in India was assessed by body mass index (BMI) grades. According to BMI grades, one third of the adult population (33 percent) was classified in various grades of chronic energy deficiency (CED). About 63 percent had normal BMI grades and about 4 percent constituted the obese grade of BMI. A mild form of CED was observed among 17 percent, moderate among 7 percent and severe among 8 percent of the adult population (DNP study).
The prevalence of CED as observed in the pooled data of eight states covered by the National Nutritional Monitoring Bureau (NNMB) was higher than that of the DNP study for its various grades.
This table shows fewer women than men in India having a normal BMI. The discrepancy between rural and urban is significant. It should be noted that the percentage of women in the situation of CED is much higher than that of men, especially in the most critical situation (CED III): 38.2 percent against 29.3. Here, only a gender-disaggregated analysis can show the critical nutritional status in rural areas and among rural women.
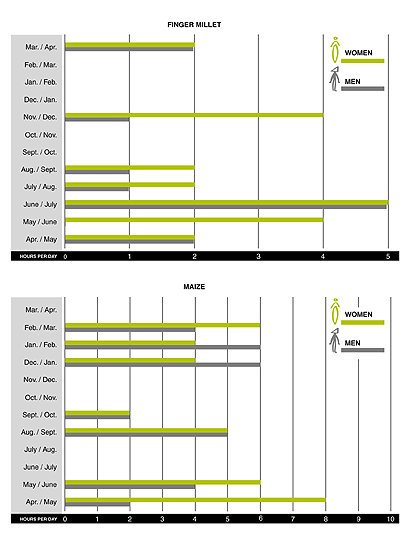
FIGURE 1 Seasonal calendar indicating gender-disaggregated working times in Nepal |
 |
Note: Two patterns for gender division of labour are shown, without taking workloads into account.
Source: FAO (1997).
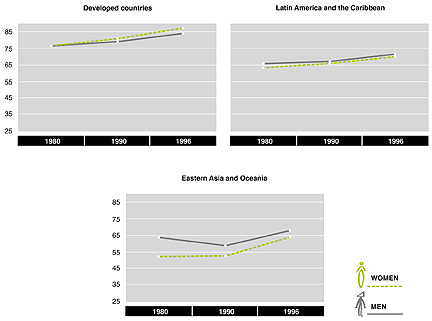
FIGURE 2A Gross enrolment ratios (all levels) by sex, 1980, 1990 and 1996 (Developed countries, Latin America and the Caribbean, Eastern Asia and Oceania) |
 |
Source: Based on data in UNESCO (1998).
Although gross enrolment ratios of women in the developing regions are in some cases increasing more quickly than those of men, they are still lower than men's.
The developed countries show a reverse pattern; gross enrolment ratios of women in these countries are increasing more quickly and are also higher than those of men.
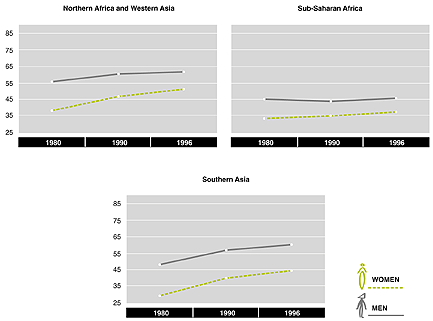
FIGURE 2B Gross enrolment ratios (all levels) by sex, 1980, 1990 and 1996 (Northern Africa and Western Asia; Southern Asia; Sub-Saharan Africa) |
 |
Source: Based on data in UNESCO (1998).
Although gross enrolment ratios of women in the developing regions are in some cases increasing more quickly than those of men, they are still lower than men's.
Gross enrolment ratios of women in Asia and Northern Africa are among those increasing most quickly and are of a similar magnitude to those of women in developed countries.
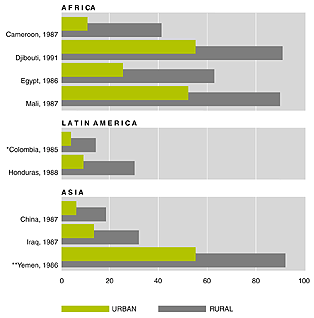
FIGURE 3 Illiteracy rate among young urban and rural women (15-24 years old) according to a 1990 census |
 |
* 12-24 years.**Data refer only to the former Yemen Arab Republic.
Source: UN (1995, p. 91).
The divergence between the literacy rates of young women from urban and rural areas is clearly shown in this Figure. Countries with the highest female illiteracy rates are those that are predominantly dependent on agriculture. Low performance may also be compounded by religious and cultural factors. Data such as these are of paramount importance to training and extension programmes.