This chapter is not an all-encompassing review of genetics. It is simply an overview of selected topics that will help those who do not have a good background in genetics to understand the genetics of inbreeding and thus understand how inbreeding affects production phenotypes, such as weight and fecundity. This background information will also help explain how inbreeding can be used to improve a population and how a population can be managed to minimize the effects of unwanted inbreeding.
Those who are not interested in this background information or those who already understand it can skip this chapter and go to: Chapters 3 and 4, which explain how inbreeding values are calculated; Chapter 5, which explains genetic drift; Chapter 6, which describes how inbreeding can be used to improve a population; or Chapters 7 and 8, which discuss ways and techniques that can be used to manage a population in order to prevent unwanted inbreeding from causing inbreeding depression and to prevent genetic drift from decreasing genetic variance.
Genes are located on structures called “chromosomes,” which are located in the nucleus of every cell. Although there are some exceptions, chromosomes typically occur as pairs in animals, and for practical fish culture management, fish can be considered to be diploids (chromosomes occur in pairs). Some rare species of fish are triploids (chromosomes occur in groups of three), but none are aquacultured species. Some species of fish are tetraploids (chromosomes occur in sets of four), notably the salmonids and catostomids; however, for practical breeding work these species behave as if they were diploids, so they can be considered to be diploids.
Because chromosomes occur in pairs, each gene also occurs as a pair. There are some exceptions in fish with morphologically distinct sex chromosomes, but few fish have such chromosomes; consequently, for practical fish breeding work, genes can be considered to occur in pairs. One chromosome of each pair comes from a fish's mother, while the other comes from its father; this means one gene from each pair comes from the mother, while the other comes from the father. The two chromosomes that form a pair are called “homologues.”
Meiosis is the process during which the primary gametocytes develop into eggs or sperm. A number of important cellular changes occur during meiosis, but for a geneticist, the important ones are those that affect the genes and chromosomes.
Meiosis consists of two cell divisions. The first meiotic division is called the “reduction division,” and the second is called the “equational division.” Prior to the reduction division, the homologues that form each chromosome pair replicate. The replicated homologues do not separate; they are joined together at the centromere, and the joined replicated homologues are called “sister chromatids” (Figure 1).
The replication of the chromosomes is usually uneventful in that they replicate themselves perfectly. However, mistakes in the replication process occur. These mistakes are called “mutations.” The mutation rate for each gene is low, ranging from one in 10,000 replications to one in 100,000 replications.
When a mutation occurs, the erroneous copy of the gene is often capable of producing an alternate version of the original phenotype (phenotypes are described in the next section). Most mutations are harmful, but some mutations create new versions of genes, and these new variants produce new or improved phenotypes that increase survival; this can lead to the evolution of new species. If replication were perfect, life would not have evolved beyond the single-celled state. Mutations also help explain some of the consequences of inbreeding.
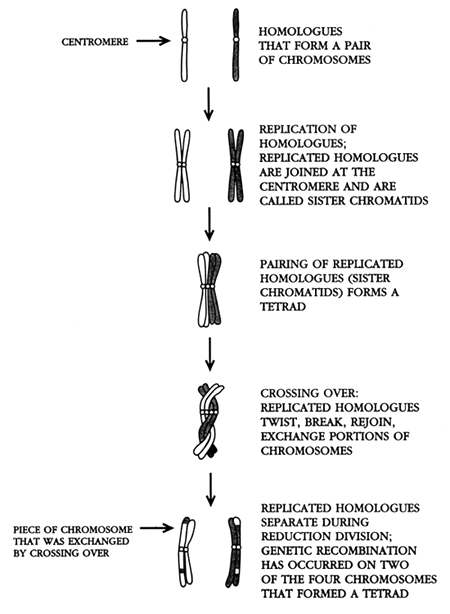
Figure 1. Schematic diagram of crossing over, which occurs in the initial phase of the reduction division during meiosis. Prior to the reduction division, the homologues that form each pair of chromosomes are replicated. This is when mutations (mistakes in replication) occur. In this figure, the homologue that came from the mother is white, while the homologue that came from the father is gray. The replicated homologues are joined at the centromere and are called sister chromatids. During the initial phase of the reduction division, the replicated homologues (sister chromatids) pair and form a bundle of four chromosomes called a tetrad. The chromosomes that form a tetrad typically twist around each other, break, and rejoin. Pieces of chromosome (and genes) can be exchanged between maternal and paternal homologues when this occurs. This process is called crossing over.
During the early phase of the reduction division, the replicated homologues that form each chromosome pair come together. Because each homologue is composed of a pair of sister chromatids, each bundle is composed of four chromosomes called a “tetrad.”
The chromosomes that form a tetrad typically twist around each other and break. When the chromosomes rejoin, pieces can be exchanged between homologues. When this happens, pieces of chromosomes, along with the genes that are located along those pieces, are transferred from one homologue to the other. This process is called “crossing over” (Figure 1). Crossing over is one of the most important biological processes, because it greatly increases genetic variability.
In inbreeding, crossing over is important because it can affect the amount of inbreeding produced during one form of chromosomal manipulation. Crossing over tends to occur at particular locations along each chromosome. Each gene has a given cross over frequency. Genes located near the centromere cross over less frequently than those further away. Gene that are located near each other on a chromosome cross over as a unit and are called “linked”; the closer they are, the more tightly linked they are. Consequently, crossing over causes actual levels of inbreeding to deviate from predicted levels during meiotic gynogenesis (this will be discussed in Chapter 6).
During reduction division, the chromosome number is reduced from the diploid (paired) state to the haploid (unpaired) state. The homologues that form each chromosome pair separate and are parceled into the two daughter cells (for males, the two secondary spermatocytes; for females, the secondary oocyte and first polar body). When the chromosomes divide, they are not parceled into maternal and paternal sets. The direction in which each replicated homologue (sister chromatids) of each chromosome pair goes is random and independent of that for all other chromosomes. This process is called “independent assortment.” Although each secondary gametocyte contains a haploid set of chromosomes, each chromosome is duplicated.
The second meiotic division is called the “equational division.” During the equational division, the replicated homologues (sister chromatids) in each secondary gametocyte separate and are parcelled into either two sperm cells or into the egg and second polar body. This produces haploid gametes; each gamete contains a single chromosome from each pair, which means that it contains a single copy of each gene.
Each gene contains the chemical blueprint for the production of a protein. This protein either forms or helps produce a specific phenotype (also called “trait” or “character”), such as body colour or weight. A phenotype is the physical or chemical expression of what a gene produces; it is either observed and described (qualitative phenotype) or it is measured (quantitative phenotype).
A gene can occur in one or more forms. Alternate forms of a gene are called “alleles.” In a population, a gene can have one to perhaps a dozen alleles. If there is only one allele in the population, the gene is said to be “monomorphic.” If there are two or more alleles at a locus (locus = gene; plural is loci), the gene is said to be “polymorphic.” Monomorphic genes are not very interesting, because there is no genetic or phenotypic variance associated with that locus. On the other hand, polymorphic genes are of great interest to a geneticist. When more than one allele exists at a locus, there is genetic variance, which produces phenotypic variance; and this can be exploited by breeding programmes.
The genetic make-up of each fish is called its “genotype.” Because chromosomes occur as pairs, each gene occurs as a pair; this means the genotype is a paired entity (Figure 2). If the copy of the gene that a fish inherits from its father is the same as the copy that it inherits from its mother, that gene is an identical pair of alleles, and the fish is said to be “homozygous” at that locus (Figure 3). If the copy of the gene that a fish inherits from its father is different from the copy that it inherits from its mother, the gene is a non-identical pair of alleles, and that fish is said to be “heterozygous” at that locus. Consequently, every gene can exist in one of two genotypic states: homozygous (identical pair of alleles) and heterozygous (non-identical pair of alleles).
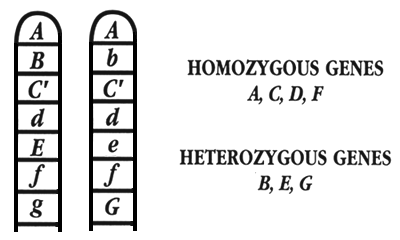
Figure 2. A small section of a pair of chromosomes, showing seven genes. Four of the genes exist in the homozygous state (A, C, D, and F), while three exist in the heterozygous state (B, E, and G).
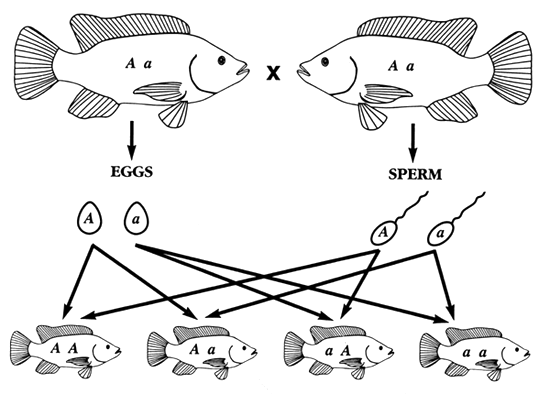
PROGENY WITH AA AND aa GENOTYPES ARE HOMOZYGOUS; THEY INHERITED IDENTICAL ALLELES FROM BOTH PARENTS
PROGENY WITH A a AND a A GENOTYPES ARE HETEROZYGOUS; THEY INHERITED A DIFFERENT ALLELE FROM EACH PARENT
Figure 3. How homozygous and heterozygous fish are produced. In this example, both parents were heterozygotes (Aa), so each produced two types of gametes: half the eggs and half the sperm carried an A allele, while the other half carried an a allele. Some progeny were homozygous (AA or aa) because they inherited the same allele from both parents. Some progeny were heterozygotes (Aa) because they inherited a different allele from each parent.
The reason why it is important to make a distinction between the homozygous and heterozygous states, is they often produce different phenotypes. The number of phenotypes produced by a gene depends on the mode of gene action and the number of alleles.
A fish's genotype produces its phenotype. Consequently, if a breeder wants to conduct a breeding programme to control or alter phenotypic frequencies (using inbreeding or preventing it are both breeding programmes), he should understand how the genotype produces the phenotype.
Breeders divide phenotypes into qualitative (descriptive) phenotypes and quantitative (measured) phenotypes. Qualitative phenotypes are those that are described, such as body colour. Because these phenotypes are descriptive, individuals segregate themselves into descriptive categories: pink vs. normally pigmented; gold vs. bronze vs. black; normal vs. deformed.
In general, qualitative phenotypes are controlled by one or two genes. The alternate forms of a phenotype (pink vs. normally pigmented or normal vs. deformed) are produced by the alternate forms of a gene (the alleles).
Most qualitative phenotypes that have been described genetically in fish are controlled by a single autosomal gene with two alleles (autosomes are the pairs of chromosomes that males and females share in common; the pairs of chromosomes that are not the pair of sex chromosomes). Because of that, this discussion will concentrate on these phenotypes, especially since this type of inheritance helps explain how inbreeding works.
In general, genes express themselves in either an additive or a non-additive manner. When genes express themselves in a non-additive manner, one allele is dominant, while the other is recessive. The terms “dominant” and “recessive” carry no value judgement; the terms simply refer to the way the alleles produce their respective phenotypes.
There are two types of dominant alleles. When the dominant allele exhibits complete dominance, it always produces its phenotype, while the recessive allele can produce its phenotype only in the absence of the dominant allele. Thus, a gene that produces two phenotypes via complete dominance (it has a completely dominant allele and a recessive allele) has three genotypes, but the genotypes produce only two phenotypes:
| Genotype | Phenotype |
| Homozygous dominant | Dominant |
| Heterozygous | Dominant |
| Homozygous recessive | Recessive |
This type of gene action plays an important role in the genetics of inbreeding, and it helps explain inbreeding depression. This topic will be discussed later in this chapter.
A second type of dominance occurs when the dominant allele is incompletely dominant; i.e., the dominant allele always produces its phenotype, but it is unable to completely suppress the recessive allele in the heterozygous state. When this happens, a gene with incomplete dominant gene action (it has an incompletely dominant allele and a recessive allele) has three genotypes, and each genotype produces a unique phenotype:
| Genotype | Phenotype |
| Homozygous dominant | Dominant |
| Heterozygous | Near-dominant |
| Homozygous recessive | Recessive |
The heterozygous genotype produces a phenotype that resembles but is slightly different from the dominant phenotype.
When the mode of gene action is additive, neither allele is dominant, and each allele always produces its phenotype in a unidirectional step-wise manner. This means the heterozygous phenotype is intermediate between the two homozygous phenotypes. When this occurs, a gene with additive gene action produces a unique phenotype for each genotype:
| Genotype | Phenotype |
| Homozygous allele 1 | Homozygous phenotype 1 |
| Heterozygous | Heterozygous |
| Homozygous allele 2 | Homozygous phenotype 2 |
Only one additive gene has been discovered in fish; it controls golden, palomino, and normal body colours in rainbow trout, Oncorhynchus mykiss. All other qualitative phenotypes that are produced by a single autosomal gene are controlled either by complete dominance or incomplete dominance.
Quantitative phenotypes are those that are measured, such as length, weight, and fecundity. The important production phenotypes are quantitative ones, although some qualitative phenotypes are quite important, and can greatly increase the value of a crop. Because quantitative phenotypes are measured, each phenotype is a single category, such as length. Individuals do not get segregated into alternate phenotypic categories, such as long vs. short; instead, they are distributed along a continuum, and differences among individuals are determined by the unit of measure that is used to assess the phenotype: millimeters, grams, etc.
Because each fish's phenotype is determined by a measurement, quantitative phenotypes form what are called “continuous distributions,” which are described by the population's mean and the distribution about the mean (variance and standard deviation). In a population, these phenotypes form what are called “normal” or “bell-shaped” distributions.
The reason why quantitative phenotypes exhibit continuous distributions and why individuals do not get segregated into descriptive categories is that quantitative phenotypes are far more complicated genetically than qualitative phenotypes. Each quantitative phenotype is controlled by dozens to hundreds of genes, each of which makes a small contribution to the production of the phenotype. The exact number of genes is usually never known. Additionally, each phenotype is strongly influenced by the environment (e.g., date of birth, access to food, age of mother, etc.), and the influence varies both from family to family and from individual to individual. The simultaneous action of many genes and the environmental effects creates single phenotypic categories (e.g., length), in which the only way to describe an individual is to measure it.
Because each quantitative phenotype is controlled by numerous genes, as well as environmental variables, the only way to work with these phenotypes is to analyze the phenotypic variance that exists in the population and to divide the phenotypic variance into its component parts. Phenotypic variance (VP) is the sum of the genetic variance (VG), environmental variance (VE), and genetic-environmental interaction variance (VG-E) components:
VP = VG + VE + VG-E
When conducting a breeding programme, a geneticist tries to exploit VG. Three distinct types of genetic variance combine to make VG, and it is important to know what they are, because different breeding programmes are needed to exploit each type. Genetic variance is the sum of additive genetic variance (VA), dominance genetic variance (VD), and epistatic genetic variance (VI):
VG = VA + VD + VI
These components of genetic variance do not refer to additive, dominance, and epistatic gene action; they refer to specific components of phenotypic variance that are produced by the entire genome, not that produced by one or two genes.
The major components are VA and VD. Epistatic genetic variance is usually considered to be unimportant, because it is difficult to exploit and improvements that occur by exploiting VI plateau quickly.
Additive genetic variance is the component that is due to the additive effect of all the fish's alleles taken independently; i.e., the sum of the effects that each allele makes to the production of the phenotype. Additive genetic variance is the most important component of VP, and the percentage of VP that is controlled by VA is called “heritability” (h2):
h2 = VA/VP
Additive genetic variance is the genetic component that can be exploited by selective breeding programmes.
In general, phenotypes with h2's  0.25 can be improved efficiently by individual (mass) selection; when h2's
are
  0.15, family selection is needed to improve a population. When h2 is
  0.10, family selection is often
ineffective, although some gains can be made when inbreeding is combined with family selection.
Dominance genetic variance is the other major component of VG. Dominance genetic variance is the component that is due to the sum of each interaction that exists between the two alleles at each locus. Because VD is produced by the interaction of the alleles at a locus, VD cannot be inherited from either parent. Dominance genetic variance is a function of the diploid state (a function of the paired gene), and offspring inherit alleles that exist in the haploid state from each parent. Dominance genetic variance is created at fertilization when the haploid set of chromosomes from the mother pairs with the haploid set of chromosomes from the father. When this occurs, each gene exits in the paired state, and VD is created. Consequently, VD is destroyed by meiosis, and it is recreated anew and indifferent combinations at fertilization.
The breeding programme needed to exploit VD is crossbreeding. When h2 is  0.15, crossbreeding is often
prescribed to exploit VG.
Inbreeding is the mating of relatives. Genetically, all inbreeding does is increase homozygosity in the offspring (this means inbreeding also decreases heterozygosity in the offspring by an equal amount; in this manual, inbreeding will be defined and discussed as it relates to homozygosity). The increase in homozygosity occurs because related fish share alleles though one or more common ancestors; i.e., the parents may carry a copy of an allele that both inherited from a common ancestor. When relatives mate, the alleles that they share because of their common ancestor(s) can be paired in their offspring. This produces offspring that are more likely to be homozygous at one or more loci.
The mating of unrelated fish also produces offspring that have homozygous genes. Additionally, an inbred fish looks the same as one with no inbreeding; there is no distinguishing mark that separates fish into inbred vs. non-inbred categories. So why is a distinction made? How are they different genetically?
The answer to these questions are: The two types of homozygosity are identical; there is no genetic difference. The only difference between inbred and non-inbred fish is that the homozygosity of each is created in different ways, but this distinction is most important.
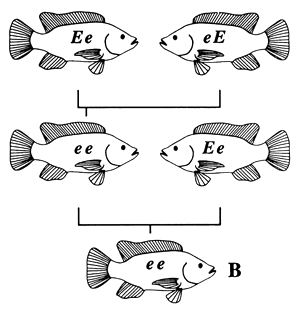
Inbred fish are homozygous because they have genes where the two alleles are identical by descent; non-inbred fish are homozygous because they have genes where the two alleles are identical because they are alike in kind (Figure 4). Inbred fish are homozygous at a locus because they inherited identical copies of an allele from both parents that the parents, in turn, inherited from a common ancestor. Non-inbred fish are homozygous at a locus because they just happened to inherit an identical pair of alleles from their parents. This difference in the type of homozygosity is not physical or chemical. The only difference is the paths that the alleles took before they were paired to create the homozygosity; i.e., how the alleles were inherited.
Since there is no difference, why do geneticists make a distinction between the two types of homozygosity? Why is inbreeding of any concern? The reason is that related fish are more alike genetically than unrelated fish. This means that when relatives mate, they produce offspring that have more homozygous loci than is the case when unrelated fish mate.
The mating of relatives produces offspring that tend to be more homozygous than the population average. This increase in homozygosity is called “inbreeding,” and the coefficient of inbreeding (F) is a measure of how much more homozygous a fish is than the population average. The coefficient of inbreeding does not measure how many homozygous loci the fish has; it simply quantifies the percent increase in homozygosity. On a gene-by-gene basis, F is the probability that the two alleles will be identical by descent. Since F measures the percent increase in homozygosity, the same level of inbreeding can produce different amounts of homozygosity in different populations, depending on the level of homozygosity that existed before inbreeding began. The coefficient of inbreeding merely quantifies the increase in homozygosity that has occurred over a specific time interval (number of generations) due to identity by descent (due to the mating of relatives). Additionally, F is based on probability, so a given value of F is an average value; consequently, a given value of F means more homozygosity will have been produced in some fish, while less will have been produced in others.
The amount of inbreeding that is produced when relatives mate depends on the closeness of the relationship between the parents. Close relatives (e.g., brothers and sisters; parents and offspring) share many alleles inherited from common ancestors, so when they mate, they produce offspring with high levels of inbreeding. Distantly related individuals (e.g., fourth cousins; fifth cousins) share comparatively few alleles from a common ancestor, so when they mate, they produce offspring with comparatively little inbreeding. The way inbreeding is measured is explained in Chapters 3 and 4, and the inbreeding that is produced when various relatives mate is explained in Chapter 6.
Because inbreeding increases homozygosity, it changes genotypic frequencies, increasing the percentage of homozygous genotypes, while shrinking the percentage of heterozygous genotypes. If regular systems of inbreeding are conducted, the breeding programme creates a series of inbred families which do not interbreed. This subdivides a population into numerous lines, which further increases genotypic variance. Figure 5 shows how inbreeding changes genotypic frequency.
While inbreeding changes genotypic frequency, it does not change gene frequency (Figure 5). Selection, genetic drift (discussed in detail in Chapter 5), migration, and mutation are the evolutionary and breeding forces that change gene frequency. Inbreeding itself does not alter gene frequency, but by altering genotypic frequency inbreeding can, theoretically, accelerate selection.
During an inbreeding programme, genotypic frequencies can be drastically altered if relatively few inbred families are maintained (a type of selection). When this occurs, gene frequencies will also change.
Inbreeding is a breeding programme that can be used to produce superior animal and plant brood stock, and it can also be used to produce genetically improved animals and plants for grow-out. Inbreeding is the breeding programme that is often used to create new breeds or varieties that breed true for “type”; i.e., a particular body conformation or set of qualitative phenotypes. Linebreeding is a form of inbreeding that is used to increase an outstanding animal's contribution to a population. The use of herd bulls is a form of inbreeding that is used to quickly improve a population. Inbreeding can be used as a type of progeny testing to create defect-free animals. Inbreeding can be used to improve response to selection when h2 is small by combining inbreeding with between-family selection.
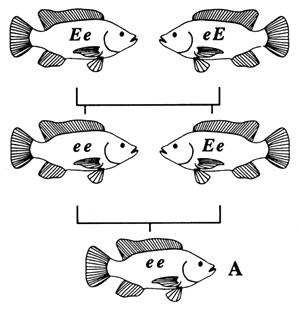 |  |
| FISH A IS HOMOZYGOUS BY DESCENT; FISH A IS INBRED | FISH B IS HOMOZYGOUS IN KIND; FISH B IS NOT INBRED |
Figure 4. Pedigrees of two fish with identical genotypes (ee), one of which is inbred and one of which is not. Fish A is inbred because its parents are related (brother and sister); it is homozygous by descent. Fish B is not inbred, because its parents are not related; it is homozygous in kind.
| GENOTYPIC FREQUENCIES | GENE FREQUENCIES | ||||
|---|---|---|---|---|---|
| DD | Dd | dd | D | d | |
| P1 |  | ||||
FREQUENCY | 0% | 100% | 0% | 50% | 50% |
MATINGS | Dd × Dd | ||||
| F1 |  |  |  | ||
FREQUENCY | 25% | 50% | 25% | 50% | 50% |
MATINGS | DD×DD | Dd × Dd | dd × dd | ||
| F2 |  |  |  | ||
FREQUENCY | 37.5% | 25% | 37.5% | 50% | 50% |
MATINGS | DD × DD | Dd × Dd | dd × dd | ||
| F3 |  |  |  | ||
FREQUENCY | 43.75% | 12.5% | 43.75% | 50% | 50% |
MATINGS | DD × DD | Dd × Dd | dd × dd | ||
| F∞ |  |  | |||
FREQUENCY | 50% | 0% | 50% | 50% | 50% |
Figure 5. The effect of inbreeding on genotypic and gene frequencies. In the P1 generation, all fish are heterozygotes (Dd). In every generation, the following matings are made: DD × DD; Dd × Dd; dd × dd. These matings reduce the percentage of heterozygotes and increase the percentage of homozygotes. In the F3 generation, only 12.5% of the fish are heterozygotes, while 87.5% are homozygotes. Eventually, there will no heterozygotes. Although this mating pattern changes genotypic frequency, the frequencies of the two alleles do not change.
Finally, inbreeding is often combined with crossbreeding to increase hybrid vigour. Details about how inbreeding is used and the programmes needed to create inbred lines are described in Chapter 6.
As inbreeding increases, it often causes a decrease in productivity which is termed “inbreeding depression.” Inbreeding depression is a decrease in growth rate, fecundity, etc. that is observed in the inbred group when it is compared to a control population where there is no inbreeding. The severity of inbreeding depression depends on the level of inbreeding, the phenotype in question, and the population. Inbreeding depression is what gives inbreeding its bad reputation.
There are several explanations for why inbreeding depression occurs, and all contribute to inbreeding depression. The first two are qualitative genetic explanations.
The most common explanation is that inbreeding depression occurs because of the pairing and expression of detrimental recessive alleles. Although the terms “dominant” and “recessive” do not mean that one allele is good and the other undesirable, most of the alleles that produce abnormal phenotypes or that lower viability are recessive. Even though mutation rates are usually only one in 10,000 to one in 100,000 replications per gene, because each fish can produce many gametes (up to 500,000,000 sperm per spawn) and because each fish has tens of thousands of genes in its genome, each fish produces dozens to hundreds of gametes that contain a mutant copy of one or more genes. Most of these mutant alleles are recessive. Since recessive alleles can be expressed only when a fish is homozygous, these mutations tend to accumulate in a population. Consequently, many fish carry “hidden” copies of these mutant alleles in the heterozygous state.
Mutations do not have to be bad; some increase fitness or lead to the evolution of new species by creating new or improved phenotypes. But most mutations lower fitness, because they cause random changes in a phenotype that works and that works well as a result of natural selection. Many mutant alleles produce phenotypes that are so abnormal that they either cause death or reduce viability severely. Others cause only small reductions in viability.
Each fish carries a number of these detrimental recessive alleles, and inbreeding uncovers them. When relatives mate, they produce offspring with an increased level of homozygosity; consequently, some of the detrimental recessive alleles that the parents carry in the unexpressed heterozygous state are paired and expressed in the offspring. Detrimental recessive alleles can also be paired and expressed when unrelated fish mate. The difference is one of magnitude, and that is what causes inbreeding depression.
It has been estimated that each individual carries dozens of mutant alleles that lower viability. Most of these mutant alleles will produce only a small reduction in fitness, but several will produce phenotypes so abnormal that they are lethal or cause premature death. There are many of these unexploded genetic bombs in the gene pool. If two unrelated individuals mate, there is a good chance that they will not carry the same genetic dynamite. However, when relatives mate, there is a good chance that both parents will carry the same genetic time bombs, because they inherited them from a common ancestor. Even though the probability of producing a defective offspring is the same for each recessive allele (25% if both parents are heterozygotes), if both parents carry a large number of identical defective recessive alleles, the odds of producing defective offspring increase dramatically. The more closely related the parents, the more alike they are genetically, so it is more likely that defective offspring will be created.
Even if two parents do not carry any lethal recessive alleles, they can produce inbred offspring which exhibit inbreeding depression if the parents carry a number of recessive alleles that reduce viability, growth, or other production phenotypes. For example, if two relatives carry 10 recessive alleles, each of which depresses growth by 1%, the pairing and expression of these alleles will depress growth in the inbred offspring. Some offspring produced by these parents will not be homozygous for any of these genes, but most will be homozygous for one or more of these recessive alleles, and growth will be depressed from 1–10% in these offspring.
A second explanation for inbreeding depression is that by decreasing heterozygosity, inbreeding reduces what is called “overdominance.” Overdominance occurs when the heterozygous genotype produces a phenotype that is superior to the two homozygous ones. Because inbreeding increases homozygosity, it decreases the number of heterozygous loci, which means that it reduces overdominance. The best known example of overdominance occurs in humans. In many populations, the gene which produces hemoglobin exists in two allelic forms: one produces normal hemoglobin, while the other produces sickle-cell hemoglobin. Individuals who are homozygous normal are susceptible to malaria and get quite ill and can die when infected. Individuals who are homozygous for sickle-cell get sickle-cell anemia and are sickly and often die. The heterozygotes are superior, even though they are slightly anemic, because they are resistant to malaria.
The final explanation for inbreeding depression is a quantitative genetic one. If a quantitative phenotype were controlled solely by VA, inbreeding would not effect the phenotype, because the types of homozygosity that would be created at each locus would balance over the genome: some homozygous combinations would cause a slight decrease in the phenotypic mean, while other would cause a slight increase. Since quantitative phenotypes are controlled by hundreds of genes, and since the homozygosity that is created by inbreeding tends to be random, if a quantitative phenotype were solely controlled by VA, inbreeding-produced homozygosity would neutralize itself, in terms of phenotypic expression. However, few if any quantitative phenotypes are controlled solely by VA. When VA controls just 30% of VP for a particular phenotype, it produces a h2 = 0.3, which is considered to be large.
Since inbreeding increases homozygosity, it also decreases heterozygosity. By doing this, inbreeding affects the interactions between alleles at each locus, which means that it affects VD, and dominance effects can play a major role in the production of many quantitative phenotypes. When h2 is small (<0.15), as it often is for viability and fecundity, dominance effects can be quite significant. The creation of excess homozygosity tends to disrupt dominance effects, which tend to be more unidirectional than the additive effects. Inbreeding can be considered to be the opposite of crossbreeding, which is used to exploit VD. Consequently, if crossbreeding maximizes exploitation of VD, inbreeding minimizes exploitation, which means that inbreeding makes phenotypes controlled by VD worse (inbreeding decreases phenotypic mean).
This genetic explanation makes sense, because inbred lines are often used in crossbreeding programmes. The creation of inbred lines is done to produce opposite types of homozygosity that will be maximized when hybrids are created, which is how VD is exploited. This explanation is further supported by the fact that crossbreeding, the breeding programme that is used to exploit VD, can also be used to eliminate inbreeding and inbreeding depression.
Unfortunately, there have been very few inbreeding studies with fish, so there is little specific information about the effects of inbreeding in aquacultured populations. In fact, inbreeding is the least studied aspect of fish genetics. Most of the studies that have been been conducted have been with salmonids, particularly rainbow trout. Most of the studies are singular experiments that were limited in scope, and many investigated only a single level of inbreeding-usually 25%. Furthermore, most studies looked at the effects of inbreeding in the range of 25–60%. No study has looked at the effects of inbreeding <12.5%. Such studies are needed, because inbreeding experiments with other animals have shown that mild levels of inbreeding can be beneficial.
Because of this, we know relatively little about the effects of inbreeding in fish culture. The studies have shown a few preliminary trends, but we do not know how different levels of inbreeding affect various phenotypes in all important cultured species of fish. We do not know what levels of inbreeding are beneficial and what levels are harmful. Finally, no inbreeding studies have been conducted on some important aquacultured species.
In general, inbreeding studies with fish have shown that inbreeding decreased production phenotypes such as growth rate, fecundity, and survival, while increasing the number of deformed offspring.
The most complete study was a long-term evaluation of the effects of six levels of inbreeding on rainbow trout. Some of the results of this study are summarized in Figures 6 and 7. The results show that the mildest level of inbreeding that was produced (12.5%; this is equal to one generation of half-sib matings) adversely affected percent hatch and survival, but it increased 77- to 150-day weight. Levels of inbreeding ≥25% severely depressed fecundity, growth, and survival (inbreeding of 25.0%, 37.5%, 50.0%, and 59.4% are produced by one, two, three, and four generations of brother-sister matings).
It is not known if these results apply to all species or to all populations of rainbow trout. Studies that have been conducted with other species of fish showed that inbreeding usually decreased means for production phenotypes, although the studies have produced mixed results: for example, inbreeding reduced the return rate of Atlantic salmon, Salmo salar; reduced growth and viability of Mozambique tilapia, Oreochromis mossambicus; increased growth of channel catfish, Ictalurus punctatus, in one study but reduced it in another. The only unambiguous result was that inbreeding produced some abnormal offspring.
It has been suggested that the breeding programmes used by most fish farmers will produce inbreeding of 3–5% per generation. If this occurs, inbreeding depression could begin to affect productivity and profits after only 3 to 5 generations.
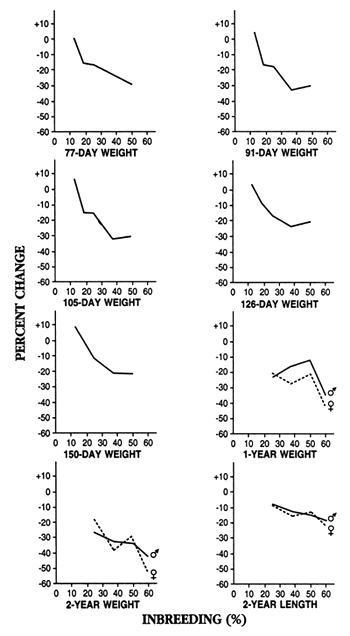
Figure 6. The effects of inbreeding on length and weight in rainbow trout. The results are presented as percent change when the inbred group was compared to a control group (inbreeding of 0%); a negative number means the inbred group was worse than the control and exhibited inbreeding depression. One generation of brother-sister mating produces inbreeding of 25%; two generations produce inbreeding of 37.5%; three generations produce inbreeding of 50%; and four generations produce inbreeding of 59.4%.
Data used to construct this figure are from: Kincaid, H.L. 1976. Effects of inbreeding on rainbow trout populations. Transactions of the American Fisheries Society 105:273–280; Kincaid, H.L. 1983. Inbreeding in fish populations used for aquaculture. Aquaculture 33:215–227.
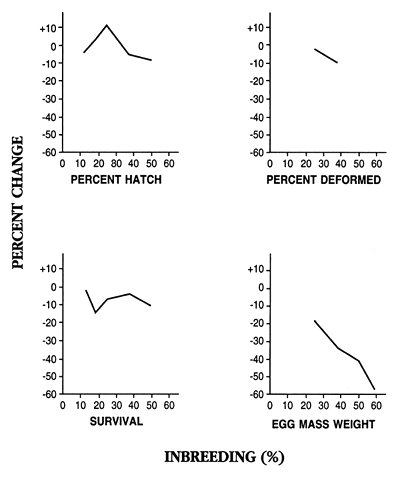
Figure 7. Effect of inbreeding on hatching rate, number of deformed offspring, survival, and fecundity (egg mass weight) in rainbow trout. The results are presented as percent change when the inbred group was compared to a control group (inbreeding of 0%); a negative number means the inbred group was worse than the control and exhibited inbreeding depression.
Data used to construct this figure are from: Kincaid, H.L. 1976. Effects of inbreeding on rainbow trout populations. Transactions of the American Fisheries Society 105:273–280; Kincaid, H.L. 1976. Inbreeding in rainbow trout (Salmo gairdneri). Journal of the Fisheries Research Board of Canada 33:2420–2426; Kincaid, H.L. 1983. Inbreeding in fish populations used for aquaculture. Aquaculture 33:215–227.