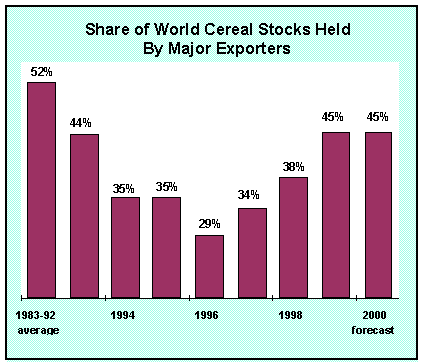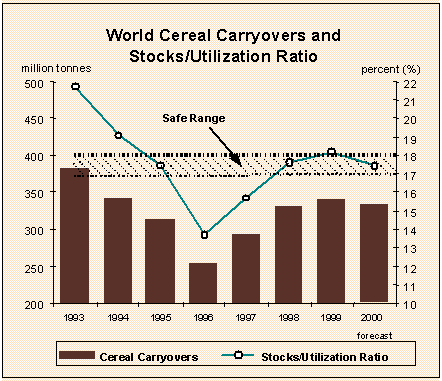


The forecast for global cereal stocks by the close of the seasons ending in 2000 has been raised slightly this month, to 334 million tonnes, up 2 million tonnes from the previous report. Nevertheless, at this level, world cereal carryover stocks would be 8 million tonnes, or 2 percent, below their opening levels as utilization is likely to outpace production for the first time in four years. A decline in wheat and coarse grains inventories held by some of the major exporting countries would account for most of the reduction in world cereal stocks, while rice carryovers are likely to increase for the second consecutive year. Although the stocks-to-use ratio1/ is expected to be lower at about 17.4 percent, it is still within the 17-18 percent range that FAO considers as the minimum necessary to safeguard world food security. Moreover, the percentage share of global cereal stocks held by major exporters, an additional indicator of global food security, is expected to remain stable at last year's level of around 45 percent.
Global wheat stocks for crop years ending in 2000 are forecast to reach 134 million tonnes, up 4 million tonnes from previous report, but still 5 million tonnes, or 4 percent, below their high opening levels. Most of the rise in this month's forecast stems from upward revisions to closing stocks in countries where the production estimates for 1999 have also been raised; namely, China, Kazakhstan, India and Ukraine. In the case of China, while the forecast for this season's ending stocks has been raised by 1 million tonnes, this year's ending stocks could be smaller than their record wheat production and continuing wheat imports by millers, the forecast for this season's ending stocks has been raised by 1 million tonnes, to 28 million tonnes (including private stocks), up 6 million tonnes from the previous year.
_______________

At the current forecast level, total wheat stocks held by the five principal wheat exporters are put at 50 million tonnes, almost unchanged from the previous report but down slightly from a year ago. In the United States, despite a drop of some 7 million tonnes in wheat production in 1999, an anticipated reduction in domestic use and almost unchanged export prospects could lead to some 26.5 million tonnes in carryover stocks. This would be 1 million tonnes more than last year and the largest since the mid-eighties. By contrast, in the EC, the combination of a 5 million tonne drop in output, likely record domestic feed use and slightly bigger exports could bring about at least a 2 million tonne reduction in stocks to 14 million tonnes. Nevertheless, the size of EC intervention stocks, which at the start of the season stood at over 6 million tonnes, may change little unless export sales increase beyond current expectations.
| Crop year ending in: | ||||
| 1998 | 1999 estimate | 2000 forecast | ||
| (. . . . . . . million tonnes . . . . . . .) | ||||
| Wheat | 135.2 | 139.2 | 134.2 | |
| Coarse grains | 140.4 | 146.5 | 141.6 | |
| Rice (milled) | 54.7 | 55.9 | 57.7 | |
| TOTAL | 330.3 | 341.6 | 333.6 | |
| of which: | ||||
| Main exporters | 126.2 | 154.9 | 149.6 | |
| Others | 204.1 | 186.7 | 184.0 | |
Source: FAO
Total coarse grain stocks for crop years ending in 2000 are currently put at nearly 142 million tonnes, down 5 million tonnes, or 3 percent, from last year and some 3 million tonnes smaller than was reported in November. The estimate for aggregate coarse grains stocks held by the five major exporters has been lowered by some 4 million tonnes this month to around 80 million tonnes. While this would be 5 million tonnes smaller than their high opening levels, it would be still the third highest level in 10 years. Most of this month's downward adjustment has been made to estimates for stocks in the United States, mainly in response to higher forecasts for domestic use and exports. Total coarse grains stocks in the United States are put at 53 million tonnes, down 4 million tonnes from the previous report but still 2 million tonnes above the high opening levels1/.
This month's forecast of total coarse grain stocks in the EC has been lowered slightly, by about 500 000 tonnes, to 20.7 million tonnes. This revision is mostly in response to larger barley exports and a likely small rise in the overall feed use in the Community. At this level, total coarse grains stocks in the EC would be nearly 5 million tonnes below the peak reached in the previous year, attributed mostly to a drop of about 3 million tonnes in barley production. This year's ending barley stocks are put at 11 million tonnes, still the second highest since 1993. Despite a cut in rye production of around 600 000 tonnes and a likely rise in its domestic feed use, rye stocks in the EC are likely to rise by 400 000 tonnes this season to 4.6 million tonnes, most of which could be in intervention as was the case in the previous year. Among other regions, this month's most significant revision concerns China where, following the release of the latest official figures that pointed to much larger maize production in 1998 but smaller output in 1999, the estimate for last year's ending stocks has been raised by almost 2 million tonnes but for this year they have been lowered by 3 million tonnes.
Global rice stocks at the end of the marketing seasons in the year 2000 are expected to recover from the reduced levels observed in recent years to about 58 million tonnes, the highest since 1994 and about 2 million tonnes more than their opening levels. The rise is mostly a consequence of the anticipated expansion in world production outpacing the increase in consumption. Most of the stock built up will be in the major exporting countries, particularly Thailand, Viet Nam, United States and India. The importing countries could also take advantage of the general weakness in rice prices to replenish their stocks to more comfortable levels and a recovery is forecast in Bangladesh, the Philippines and Brazil.
____________________________