![]()
![]()
|
REGIONAL COMPETITIVENESS IN THE SUGAR INDUSTRY Mr James Fry, Managing Director, LMC International Ltd, Oxford, England. Ever since the early years of the last century, the world market for sugar has been divided between cane and beet. As the share of Europe and North America in world sugar demand has declined, the percentage of beet sugar in the global total has followed suit, but as recently as the 1960s, there were years in which beet sugar accounted for almost half of the world-wide tonnage. The collapse in sugar sales and production in the former Soviet Union has hastened the drop in the beet sugar share in recent years, but the sector still accounts for over a quarter of world sugar output, and can be expected to recover to over 30 percent when the former Soviet economy revives. One reason for the drop in the contribution from the beet sugar industry has undoubtedly been the problems caused by the difficult transition from Communist systems in Eastern Europe. There is also another possible explanation, which is relevant to the present paper; this is that the basic economics of the production of beet sugar are less competitive than those of cane sugar, and that the lower cost sugar has been able to displace the higher cost alternative from some markets. In order to understand the nature of the competition between cane and beet sugar, this paper is divided into four sections. First, I examine the trends in the production costs of cane and beet sugar world-wide, to determine how the balance between the two forms of sugar has altered over time. Then, I review briefly how the recent turbulence in foreign exchange rates has affected the competitiveness of leading beet sugar producers, before turning to a comparison of the technical performance of the two sugar sector. Finally, I discuss how the liberalisation of sugar marketing would affect the level of beet sugar output.
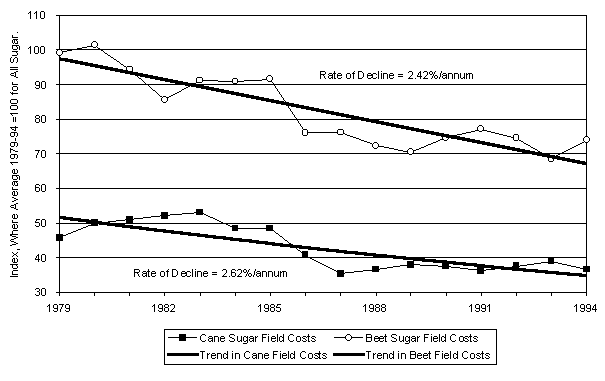
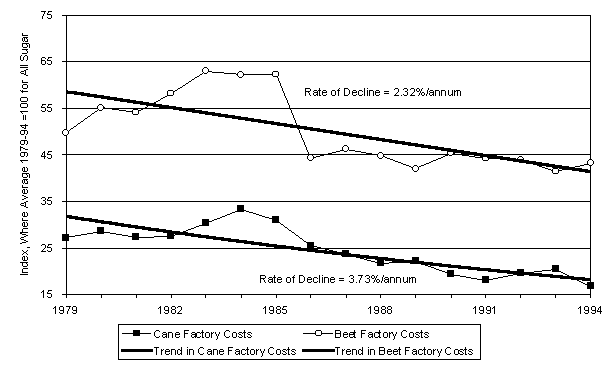
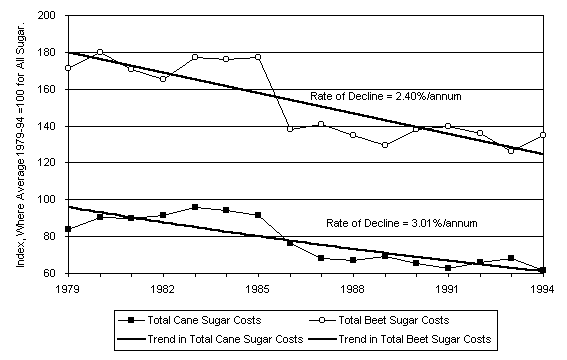
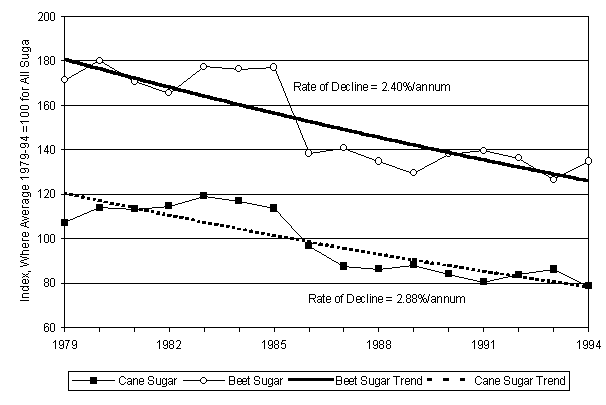
PRODUCTION COSTS The first three diagrams depict the evolution of real (i.e., inflation-adjusted) costs of production of cane raw sugar and beet white sugar world-wide over the period between the 1979/80 and 1994/95 crop years. The diagrams distinguish between the field costs per tonne of sugar (in Diagram 1), the factory costs (in Diagram 2) and total sugar costs (in Diagram 3), and display the year-to-year costs, as well as the underlying trend over the period under review. In all of these diagrams, the production costs are expressed as a weighted average of world-wide beet and cane sugar production costs. The number which is printed on each diagram is the average yearly rate of decline in these real costs. The average decline in cane field costs was 2.6 percent, while that in cane factory costs was 3.7 percent. When they were combined, the real global costs of producing raw cane sugar fell at an average rate of 3.0 percent. The corresponding figures for beet white sugar were a 2.4 percent per annum decline in field costs, one of 2.3 percent for factory costs, and one of 2.4 percent for beet white sugar as a whole. This was creditable in view of the collapse of the East European beet industry, but was still 0.6 percent slower than the rate of cost reduction achieved by the world’s cane sugar producers. Diagram 4 makes the beet and cane sugar figures consistent, by adding the year-on-year trend in refining costs to cane raw sugar costs, so that both beet and cane sugar costs are on the same basis (i.e., white value). When this is done, cane sugar costs can still be seen to have fallen faster than beet sugar, on average, by roughly 0.5 percent per annum.
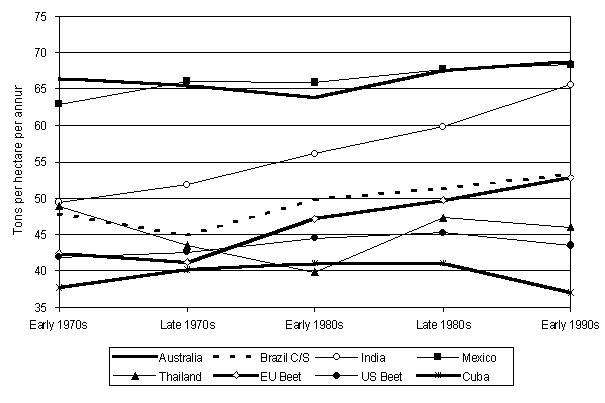
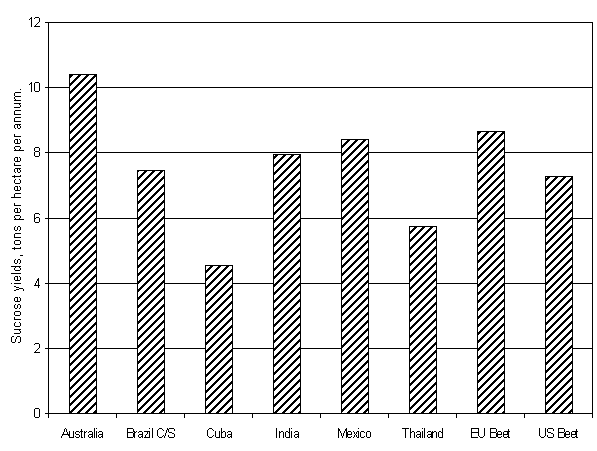
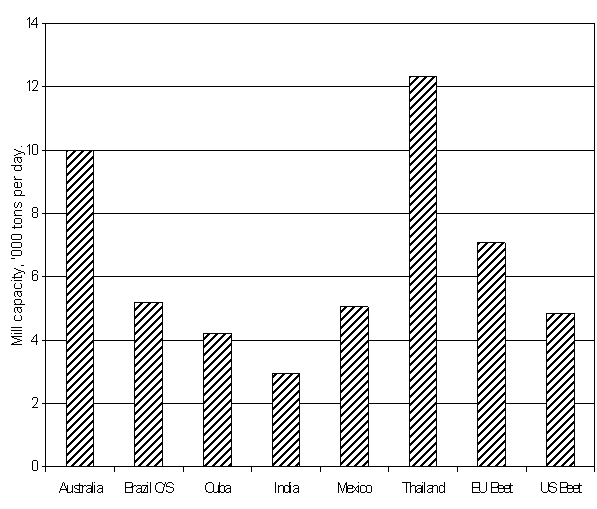
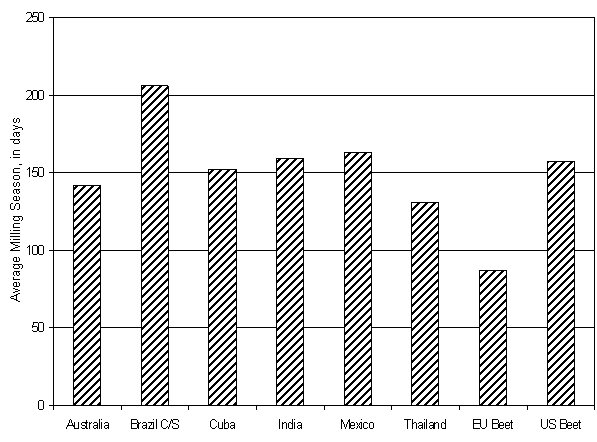
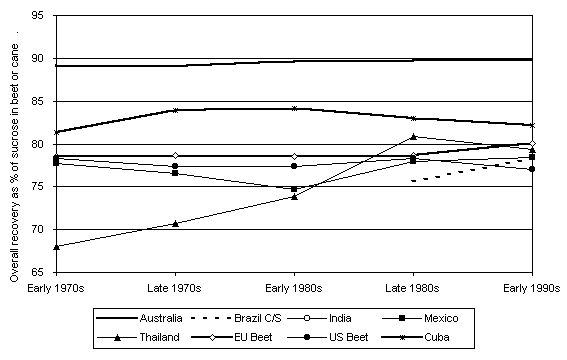
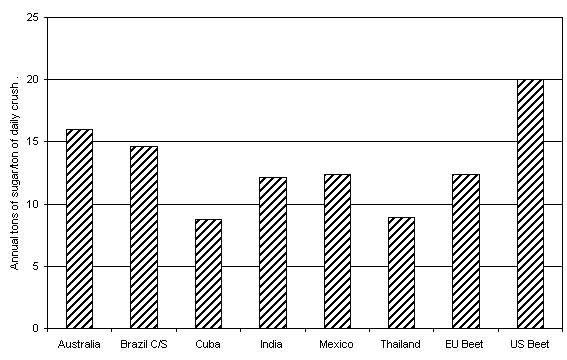
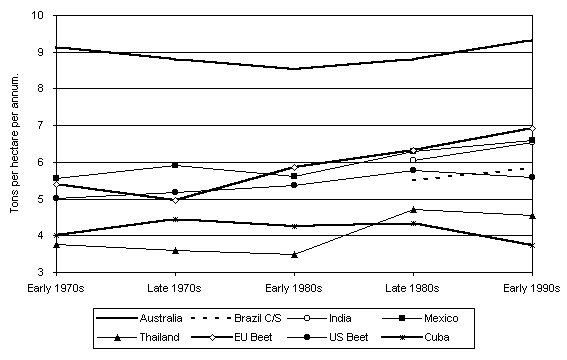
TECHNICAL COMPETITIVENESS Exchange rates are a fact of life for sugar producers, and one which they are powerless to control. Their influence is confined to the technical aspects of their operations, to which I now turn. In Diagram 5, I compare the trends in recorded field yields for a representative group of leading cane and beet producers. All of the data refer to yields per hectare per annum, to take account of national differences in the ages of cane when it is harvested. On this reckoning, India and the European beet industry have fared particularly well, but no clear pattern emerges from the other countries. Diagram 6 summarises the similar trends in the average sucrose content of cane or beet, at the time of delivery to the factory. The beet industry does better than any cane producer in this respect, though Australian cane does not lie far behind. When the results of Diagrams 5 and 6 are combined, as is done in Diagram 7, the star performer from the perspective of sucrose yields per hectare per annum is Australia, followed by the European Union’s beet industry. Turning to the milling side of the industry, one important influence upon competitiveness is the average size of factories. Diagram 8 demonstrates that Thailand is to the fore in this respect, and enjoys the greatest benefit of all from economies of scale in milling, followed by Australia. It is interesting to see that the two beet sugar countries are not particularly impressive from this point of view. Diagram 9 illustrates another crucial aspect of the economics of factory operations: the rate of utilisation over the year. Centre/South Brazil, partly thanks to its ethanol programme, has the longest milling season (of over 200 days) of the countries in the diagram. Most of the others' seasons are close to 150 days, but the European Union is remarkable for its average campaign of less than 100 days, which implies that its factories are used for barely 25 percent of the year, as against almost 60 percent utilisation in Brazil. Factories' success in their rates of extraction of sucrose from the cane and beet which they process is the subject of Diagram 10. Australia fares substantially better than the other countries, with an overall recovery of approximately 90 percent. Most of the other countries achieve recovery rates of 78 percent to 80 percent. In respect of overall recoveries, beet processors — who rely entirely upon diffusers for their juice extraction — do not fare notably better or worse than the mass of cane millers. Diagram 11 brings together several of the differing measures of factory efficiencies in the form of the annual tonnage of sugar that is achieved per tonne of daily processing capacity. Thus a value of 11, for example, where the average size of a factory is 4 000 tonnes per day of cane or beet crushing capacity, implies that this factory would produce 44 000 tonnes per annum of sugar. The high sucrose content of beets helps to offset the impact of the short campaign that is typical of beet factories. For this reason, the US beet industry is the most productive of those depicted in Diagram 11, achieving a production of 20 tonnes of sugar per tonne of daily slicing capacity. Australia is the only other country that has a level of more than 15, and most of the others have values between 10 and 15, including the European Union beet producers. Only Thailand falls short of 10. Diagram 12 completes this section, with a comparison of the trends in the actual yields of recovered sugar per hectare per annum. Australia is out in front with over nine tonnes of sugar produced per hectare per year, but the European Union beet industry has made steady progress, and moved up to second place, with a yield that now averages around seven tonnes (and remember that this is of white sugar, whereas Australia’s figure is for raw sugar). The two countries at the bottom of the diagram are both major exporters: Thailand and our hosts, Cuba. This proves, if proof were needed, that high yields are not necessary to be a successful, competitive, export orientated industry.
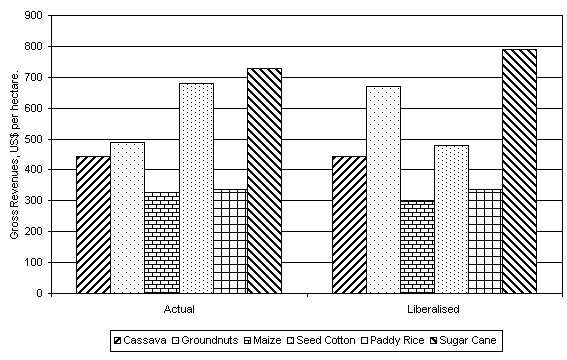
THE IMPLICATIONS OF WORLD TRADE LIBERALISATION At this point, I would like to change tack and look into the future a bit, by examining how a number of different exporters’ underlying competitiveness will be reflected in their sugar production decisions as the world sugar market is liberalised further. The start of the Seattle Round of WTO negotiations reminds us that liberalisation will be near the top of the agenda for many policy-makers in the coming months. The approach that I have adopted to understand the likely impact of liberalisation is to consider how farmers will view the introduction of a level playing field in world trade. Ultimately it is farmers, rather than factories, which will decide what crops are grown; therefore, their decisions are crucial. As a simplifying assumption, I have assumed that farmers will choose the crops which will, on average, give them the highest levels of gross revenues per hectare. Ideally, I would have focused upon gross or net margins, rather than gross revenues, since production costs per hectare differ from crop to crop, but, since I have not had the time yet to pull together production cost estimates for all of the crops which farmers might grow, I have only prepared diagrams which compare the gross revenues which an average farmer in a particular country would receive from cultivating one hectare of sugar cane (or beet) and the major alternative crops. This may not be such a bad approach in the short term. Farmers’ costs are more or less fixed in the very short run; therefore many farmers’ decisions are influenced heavily by the overall income which they will earn from one hectare of the alternatives open to them. The data which I used were derived from the FAO and cover the first half of the 1990s. I have applied both the average yields and the average producer prices published by the FAO, and obtained a series of diagrams depicting the actual gross revenues per hectare for a range of countries. The FAO information, of course, only tells us about the past, when very few countries had liberalised their markets. The impact of liberalisation has been simulated by applying the long run trend in world market prices to the selling prices of all crops, and translating this into farm-gate prices for all of the countries covered in the diagrams which follow.
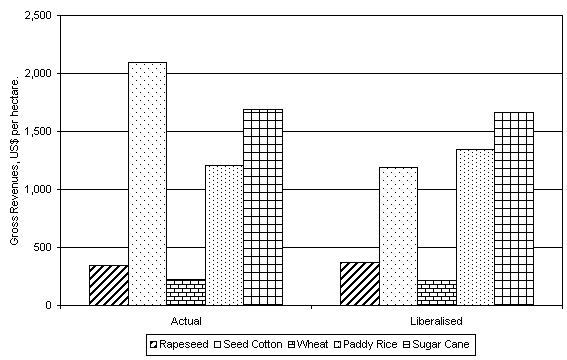
Australia The crops which we have compared with cane in Diagram 13 for Australia are rapeseed, cotton, wheat and rice, although cane reigns so supreme in many areas that these are rarely seen in competition with cane. Nevertheless, it is interesting to note that cotton was able to compete successfully in the early 1990s on a per hectare basis, with rice not far behind cane. However, once a fully liberalised situation is assumed to apply, then cane is well out in front, generating over US$400 per hectare more than the next most remunerative crop, rice.
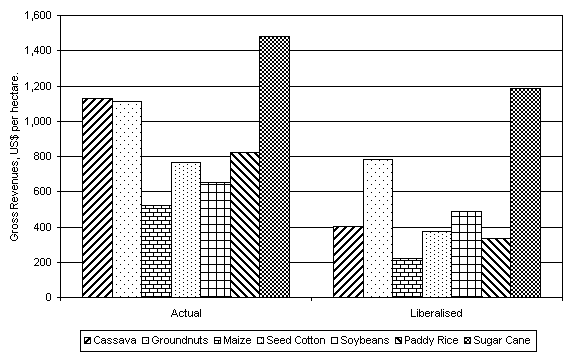
Brazil In the early 1990s, cane generated much greater revenues per hectare than the other crops in Diagram 14. Under full liberalisation, cane’s advantage increases. In relation to its main arable competitors, soybeans and maize, cane, on average, earns roughly three times as much gross income per hectare as these crops if all trade barriers are dismantled and world sugar prices are close to their long run trend value.
India For India, the evidence of Diagram 15 is striking. Cane is far ahead of the other major crops in terms of revenues per hectare, producing almost three times the income per hectare of its closest competitors, whether or not the economy is fully liberalised. The contrast between cane and rice, for example, makes one wonder whether the FAO has made any systematic allowance for the double cropping of crops. Maybe one should add together, say, the income from rice to that from rapeseed, to arrive at the overall income which a farmer would gain over a 12 month period, if they opted not to grow cane. Even so, cane still proves significantly better as a source of income over the year as a whole.)
Mexico We have included Mexico as the subject of Diagram 16, since the country has emerged as the largest producer in the Central American region. The diagram reveals the extent of the subsidies enjoyed by Mexican agriculture in the past, and cane was not exempt. Yet, the higher gross revenues obtainable from cane in the early 1990s appear to carry over to a liberalised market. In a fully liberalised economy, the earnings from all crops would fall heavily, thereby hitting land values, but cane remains significantly better as a generator of revenues than the alternatives in the diagram.
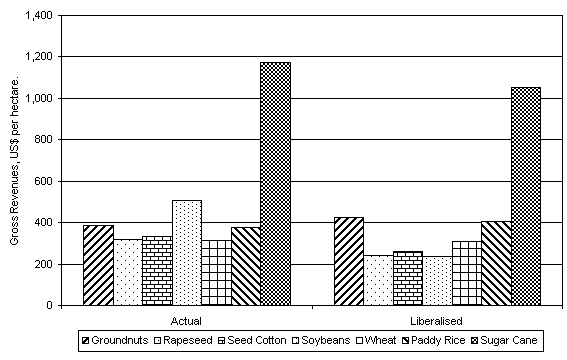
South Africa The South African sugar industry was yet another in which cane was far ahead of its main alternative crops in the early 1990s, from the point of view of its gross revenues per hectare, as Diagram 17 reveals. The removal of protection from the local market would reduce earnings substantially, but total earnings per hectare from cane would still remain near double the level of the next best crop depicted in the diagram.
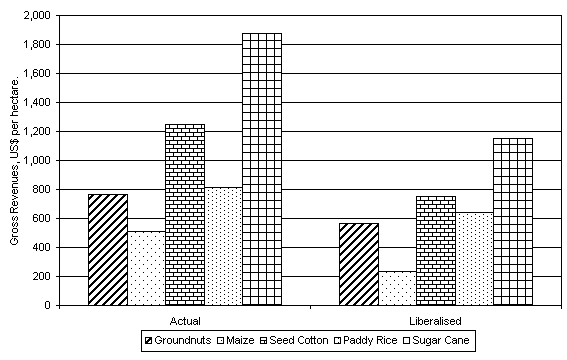
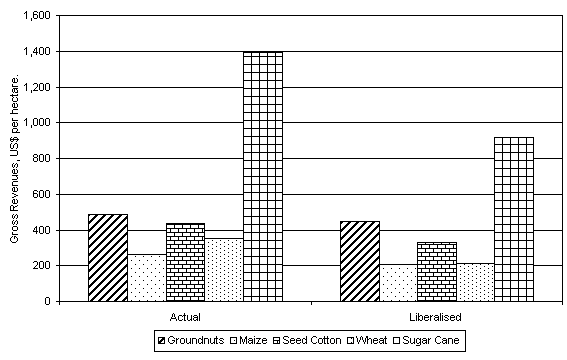
Thailand The impact of liberalisation in Thailand is simulated in the right hand side of Diagram 18. Somewhat surprisingly, it suggests that, far from losing out to competing crops, cane would actually gain slightly against all apart from groundnuts if a fully liberalised trade regime were to be introduced.
Conclusions from the Examples of Sugar Cane Growing Countries The examples which I have presented have the following clear implications:
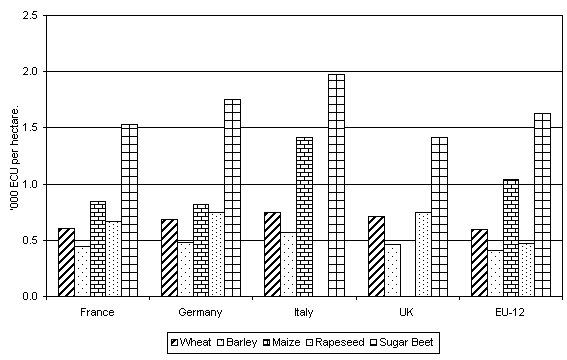
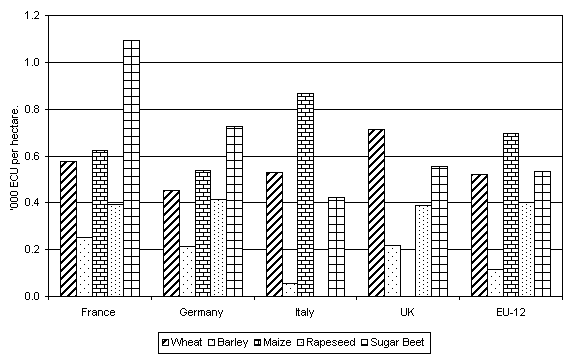
THE CASE OF THE EUROPEAN UNION In this final section, I turn to the world’s largest beet sugar producing area, the European Union. Its protective Common Agricultural Policy (CAP) is well known for providing high incomes for its farmers. Increasingly, the budgetary pressures inside the European Union and the stipulations of the WTO are forcing the CAP to change from policies designed to defend agriculture via import tariffs and high prices for domestic consumers towards policies which pay direct income supports via so-called compensatory payments, of a pre-determined amount per hectare. Sugar beet has not been much affected by these changes, primarily because the system of production levies which are used to finance the costs of export subsidies imposes no net cost to the CAP budget. However, over time, the requirements of the WTO and progress towards liberalisation will increase the pressures for reductions in the protection afforded to the European Union sugar producers. Diagram 19 is somewhat different from the preceding diagrams in that it depicts the gross margins (and not merely the gross revenues) earned in the early 1990s, in ECUs per hectare, from the main arable crops in the leading European Union sugar producing member states: France, Germany, Italy and the UK, as well as in the as a whole. There is no mistaking the profitability of sugar beets in relation to its competitors. Diagram 20 illustrates how these gross margins would be affected by liberalisation of all major crop markets, and the convergence of prices to their long term trends in world market prices. As in many cane producing countries, one effect is to reduce the profitability of all crops, and this will be reflected in lower land values. One discovers that the liberalisation of the European Union market would not necessarily end the competitiveness of some European Union producers. In both France and Germany, beet would still generate a higher gross margin per hectare than the main grains and oilseeds.
CONCLUSIONS FROM ANALYSIS OF THE EUROPEAN UNION BEET SUGAR SECTOR The two diagrams that we have just review yield the following conclusions:
CONCLUSIONS
Diagram 1: Real Cane Raw and Beet White Sugar Costs in the Field
Diagram 2: Real Cane Raw and Beet White Sugar Costs in the Factory
Diagram 3: Real Total Cane Raw and Beet White Sugar Production Costs
Diagram 4: Trend in Real White Sugar Production Costs
Diagram 5: Average Beet or Cane Yields, the 1960s to the 1990s
Diagram 6: Average Sucrose Content of Beet or Cane, the 1960s to the 1990s
Diagram 7: Average Sucrose Yields per Hectare per Annum, the 1960s to 1990s
Diagram 8: Average Mill Size, Early 1990s
Diagram 9: Average Length of Milling Season, Early 1990s
Diagram 10: Average Overall Factory Recoveries, the 1960s to the 1990s
Diagram 11: Annual Sugar Output per Ton of Daily Crushing Capacity, Early 1990s
Diagram 12: Recovered Sugar Yields per Hectare per Annum, 1960s to 1990s
Diagram 13: The Impact of Liberalisation upon Revenues per Hectare — Australia
Diagram 14: The Impact of Liberalisation upon Revenues per Hectare — Brazil
Diagram 15: The Impact of Liberalisation upon Revenues per Hectare — India
Diagram 16: The Impact of Liberalisation upon Revenues per Hectare — Mexico
Diagram 17: The Impact of Liberalisation upon Revenues per Hectare — S. Africa
Diagram 18: The Impact of Liberalisation upon Revenues per Hectare — Thailand
Diagram 19: Gross Margins per Hectare in the European Union in the Early 1990s
Diagram 20: The Impact of Liberalisation upon European Union Gross Margins per Hectare
|
![]()