![]()
![]()
![]()
By A. DE PHILIPPIS, Professor of Silviculture, University of Florence Italy
The word ecology has met with great favor among scientists concerned with the study of living things. Since its definition by Haeckel (1866), it has often been applied in various ways, sometimes referring to a general study of the factors of environment and sometimes having a narrower connotation. Several more precise terms have been proposed to explain the complexity of the relationship of living entities not only to the physical environment but also among themselves - for instance, bio-coenology (Gams, 1918) and bio-ecology (Clements, 1922) but these terms, although perhaps more expressive, are unnecessarily redundant.
The study of ecology, unlike that of physiology, cannot be undertaken in the laboratory, with one or another element subjected to artificial isolation. The work must be done in the open under natural conditions, face to face with those combinations of factors which react one with another in many different ways.
An understanding of ecological factors, which are nearly always complex, can be arrived at either empirically or by inference, but the possibilities of experimental ecology are in practice limited by the need for special equipment, so that results are usually best attained by a combination of both methods.
The science embraced by the term plant ecology was practiced long before that particular expression was coined. Latin georgic writers were aware of the relationship between the life of agricultural and forest plants and their external environment, notably the edaphic and climatic requirements of many species, and the influence of adverse factors inherent in the environment.
Toward the end of the eighteenth century, more definite and well-founded knowledge began to be available when the first truly experimental observations, particularly those of Duhamel du Monceau, made it possible to confirm or refute conceptions which until then had been quite empirical. The same period witnessed the start of a series of explorations and voyages-of discovery, the results of which formed the basis of causal phytogeography.
Space will not permit discussion of the evolutionary stages through which plant ecology has passed, and too many names would have to be mentioned. Such men as A. von Humboldt, A. de Candolle, A. Grisebach, O. Drude, E. Warming, A. F. Schimper were the authors of the most important general works on the subject published during the nineteenth century
But we can give a brief outline of the development of forest ecology, namely that branch of plant ecology relating to the interdependence between the life of forest plants and the climatic, edaphic, and biotic factors of their external environment.
Today, forest ecology affords the scientific basis for silviculture, for it allows the forester to determine how he should carry out his silvicultural operations so as to create the least disturbance in the natural equilibrium.
The first evidences of the birth of forest ecology may be found in the more important works dealing with forestry which appeared in the nineteenth century, some being papers of a general character and others specific treatises, such as the well-known thesis of G. Heyer (1854) on the behavior of forest plants in relation to light.
Toward the end of the nineteenth and early in the twentieth century, a new foundation for silviculture was clearly discerned in the works of K. Gayer, B. Borggreve, and others, and more particularly in the writings of H. Mayr. Mayr's work Waldbau auf naturgesetzlicher Grundlage (1909) was the first to show this new trend by the title itself. Later on, more and more authors contributed to the assertion that a sound foundation for silviculture must be built on ecological knowledge.
Of the treatises published after Mayr's, it will suffice to mention the names of Morosow, Cajander, Bühler, Pavari, Rubner, Dengler, Troup, Toumey, whose works achieved renown and widespread circulation. Many other scholars throughout the world are the authors of important contributions on specific aspects, but it would be invidious to select even a few examples.
The Phases of Modern Forest Ecology
In modern forest ecology, several phases are discernible which are interrelated but by no means subordinate to one another. The autoecological and synecological phases include a detailed study of the relationships between species, or forest coenosis and the environmental factors. With the study of the boundaries of vegetative zones and the determination of such boundaries, we come to the causal phytogeographical phase. In the phytosociological phase (typology for certain schools of thought, and bio-coenology in a more general sense), we come to the more specific analysis of the relationship of plants among themselves and with other forest organisms.
Through analyses and constructive studies a fund of knowledge has been obtained with regard to the limiting conditions of forest life (or of each forest species), the optimum or marginal conditions insuring its perpetuation (regeneration in a forestry sense) and growth; the phenomena of establishment, evolution and differentiation of forest stands, the possibilities of introducing species into areas with similar ecological conditions. A knowledge of all these factors is indispensable if silviculture is to be rationally directed towards its multiple aims.
The purpose of this article is to give a brief outline of the knowledge gained in the sphere, of phytoclimatology, i.e., the study of the influence of climate as a limiting factor on forest distribution.
Phytoclimatology
There is no doubt that climate is the main factor affecting distribution, in the sense that its action is felt over wide areas of the earth's surface.
On the whole, the spatial distribution of vegetation is regulated by the climatic variations due to latitude, to distance from the sea, and to altitude. The variations due to historical factors or to edaphic or biotic factors (particularly the anthropic factor) usually have a more or less limited geographical bearing.
Broadly speaking, the influence of climate is clearly illustrated by the general superposition of the main categories of plant formations upon the main types of climate: thus, the evergreen rain forest is coincident with a moist equatorial climate; forests that are deciduous in the dry or cold season are coincident with tropical and temperate climates; forests of northern or mountain conifers, with cold climates.
This correspondence, already noted by the first phytogeographers, was more clearly defined and set in its logical context by Schimper (1898) and formally expressed in a few physiognomical classifications, such as Brockmann-Jerosch's and Rübel's (1912).
But the mere broad expression of such a correspondence is not sufficient to define acurately the relationship from cause to effect between climate and vegetation; one must be in a position to express the extent of this relationship by means of numerical values, showing the restrictions of the possibilities of expansion of a certain species, or of a certain phyto-coenosis, in connection with climate.
For instance, what are the limits of temperature and rainfall that determine the transition from rain forest to other intertropical formations?
The study of such limiting values cannot be undertaken except through induction, clearly defining first of all the limits of the area of the species or of the coenosis under consideration, then inquiring into the climatic factors determining these limits and their relative influence.
In general, the predominating influence is the climatic factor which is at the minimum,- or closest to the limits of tolerance (law of minimum, law of maximum, law of the limiting factor, law of the most significant factor). Most often, the limits are determined by a combined influence of several factors which react one upon another and may balance each other (law of relative influence, law of compensation). 1
1 One special method of factor evaluation governing the climatic circumscription of growth areas is suggested by Boyko (1947). This author has laid down the "geoecological law of distribution," according to which the topographical distribution (microdistribution) is a function parallel to the general distribution (macrodistribution) of an ecotype or of a plant community; both distributions are the expression of the ecological amplitude of the ecotype or of the community.
This law should enable conclusions to be drawn, from an ecological-topographical study, which could be extended to the areas of general distribution of the species or of the coenosis under study.
The examples given by the author prove that such may be the ease for the species or communities under observation in certain critical points within the limits of their areas, but we doubt that such a law can actually be extended to all eases.
Research into limiting values is most difficult, owing to the lack of sufficient observation data covering all the climatic factors. The factors exerting the most general influence are heat and water. Data on heat (atmospheric or soil temperatures) is sufficiently significant, but information on water usually consists of indirect measurements only (atmospheric precipitation, humidity, evaporation, etc.). Information relating to the other elements of climate is rarer. This explains why attempts to circumscribe the phytoclimatic field have been based mostly on thermic and pluviometric data. ²
² The phytogeographical importance of other elements is far from negligible, even if frequently indirect. Light, by which transpiration and photosynthesis are regulated, influences water requirements and may act as a limiting factor (e.g. in high mountain areas), resistance to cold may be altered by the variations in the periodicity of daily illumination, etc. The wind factor, by itself, can determine the restrictions on plant life; such is often the ease in mountain areas, particularly on continually windswept summits. On the other hand, the polar limits of arborescent growth may be determined by the influence of fey wince but not by a thermic minimum (Kihlmann 1890; Szymkievicz, 1930).
Application of Thermic Data
The obvious parallelism between the sequence of thermic belts and of the large categories of vegetation, with the variations in latitude, did not escape the attention of the first students of causal phytogeography, who began to use thermic data in the study of climatic limits of plant formations. The "orange-tree climate," the "olive-tree climate," and the "chestnut-tree climate" as named by Soulavie (1783), the thermic zones referred to by Humboldt (1817), and the well-known megathermal zones and mesothermal zones of A. de Candolle (1855), were actually true phytoclimatic categories.
Subsequently, many authors used thermic values for the same purpose. A. de Candolle (1855), Merriam (1894), Selianinov (1928, 1930) used the totals of annual temperatures or of specific periods of the year. Quervain (1903), Holmboe (1913, 1927), Salisbury (1926) resorted to average monthly temperatures. Grisebach (1872), Mayr (1906), Livingston and Shreve (1921) utilized the thermic data of a given period (for instance, that of the period of growth or of the frost-free period); Köppen (1926), Walter (1927), Enquist (1929, 1933), and Rubner (1935) based their research on the duration of a given temperature. The annual thermic range (difference between maximum and minimum temperatures), which shows the more or less continental characteristics of a climate (from the thermic viewpoint), was also utilized for phytogeographical purposes, after the initial observations by Humboldt, Wahlenberg, and Grisebach.
Such data, taken individually, are generally not sufficient to permit a definition of the climatic conditions of a given station, and it is for that reason that a great many attempts have been made to combine both numerically and graphically two or more sources of thermic data. Among such attempts may be noted the definition of indices of "thermic effectiveness" (Thornthwaite's (1931) is one of the best known); the drawing of climograms, and the definitions of a few indices of an exclusively thermic character ³ such as Giacobbe's cold index (1937, 1949) and Gonzalez Vasquez' thermic factor (1933).
³ The influence of the thermic factor, in so far as the polar boundary and the alpine growth boundary are concerned, has been particularly studied by various authors such as Brockmann-Jerosch (1919), Rubinstein (1924), Langlet (1935).
Humidity
The first element used to express humidity conditions was annual rainfall. The inadequacy of this information being quite obvious, certain factors such as the distribution of precipitation (pluviometric regimen), the number of rainy days, the evaporation rate, atmospheric humidity, etc., were taken into consideration, while synthetic formulae resulting from the combination of two or several factors were also established.
Thus Köppen (1900) utilized the relationship between rain and the maximum water vapor pressure of the rainiest month; Transeau (1905), the relationship between rain and evaporation; Meyer (1925), Rabbow (1927), the relationship between rain and the saturation deficit; Selianinov (1928, 1930) the relationship between rain and the total temperatures of the period of growth; Trumble (1939), that between evaporation and the saturation deficit; Emberger (1930), Chipp (1937) and others utilized indices combining the quantity of rainfall with the number of rainy days, etc.
The scarcity of data with regard to atmospheric humidity and evaporation has induced several authors to suggest terms in which these elements appear as functions of temperature.
Thus, a certain proportion of those indices are referred to as pluviothermic or hygrothermic (according to the elements used), but actually they are almost all humidity indices, as, for instances, the relationship between rain and the annual temperature (Lang's pluviofactor, 1916) or of specified periods (Martonne's index of aridity, 1926; Albert's reduced pluviofactor, 1928; Amann's hygrothermy, 1929; Emberger's pluviometeric quotient, 1930; Oelkers' pluviofactor, 1932; etc.). Szymkievicz (1925) suggested a correlation between rain and an index of evaporation based on the pressure, the relative humidity, and the maximum pressure of the driest month. Ångström (1936) propounded the proportion between rain and an exponential function of temperature; Setzer (1946) chose a similar term based on Van't Hoff's law.
Other authors used various elements to express the conditions of humidity (Gams' index of hygric continentality (1931), for example, is a correlation between particular functions of rain and altitude) or the combined conditions of humidity and temperature (Livingston's hygrothermic index (1916) which is the product of the sums of temperatures by the equation between rain and evaporation); Gonzalez Vasquez' phytoclimatic index (1933) resulting from the combined climatic and vegetative factors; Boyko's (1945) IE factor, which is an expression combining insolation expressed in terms of inclination and exposure, etc.
As mentioned before, in the study of the effects of climate on ecological distribution all the factors, or at least the more important ones, must be taken into consideration at one time. This is necessary because the nature of limit, although determined by essentially thermic or essentially hygric factors, is never uniform all along the perimeter of the area of concurrence of a certain species or coenosis. It is for the purpose of taking this fact into account that phytoclimatic circumscriptions based on a contemporary and coordinated consideration of several factors have been suggested. One of the first attempts of the kind was undertaken by Köppen (1900), who delineated climatic categories whose boundaries, specified numerically, roughly represented the ecological boundaries of a similar number of categories of vegetation or plant formations.
Phytoclimatic Classifications Based on Vegetation
The first specifically phytoclimatic classification based on forest vegetation (in the Northern Hemisphere) is due to Mayr (1906) who distinguished between six different forestry zones: Palmatum (tropical zone of the palm-tree); Lauretum (sub-tropical zone of the evergreen oak and of the laurel); Castanetum and Fagetum (temperate-warm zone of the summer-growing deciduous forest, divided into a warmer and a colder zone); Picetum, (temperate-cold zone of the conifers); Alpinetum and Polaretum (the cold zone of the stunted arborescent shrubs).
The climatic boundaries of these zones are determined by Mayr on the basis of the following factors: the average temperature during the May to September period (considered as the period of growth), the annual average temperature, the minimum averages, the rainfall record of the growth period, the relative humidity of the same period, the date of the first and the last frosts. Thus, Mayr considers limits that are partly thermic and partly hygric.
Several years later, this idea was taken up by Pavari (1916). He pointed out the deficiencies in Mayr's diagram and suggested a more complex one which was much better characterized climatically (by means of annual average temperature, average temperature of the coldest month and of the warmest month, annual minimum and maximum averages; rainfall distribution; quantity of precipitation for the year and for the warm season, respectively) and which reproduced much more faithfully the real distribution of forest formations. Disregarding the tropical zone, he maintained Mayr's five last zones, subdividing the first (Lauretum) into three types (according to the rainfall distribution) and three subzones (according to the temperature of the coldest month and the minimum averages); the second into two thermic subzones and each of these in turn into two types, on the basis of the conditions or the quantity of rainfall; the third and the fourth, into two thermic subzones.
Pavari's zones and subzones, at least in so far as the Lauretum and the Castanetum zones are concerned, differ considerably from those defined by Mayr, with which they have only the names in common.
In order of sequence, apart from the proposals of Cajander (1916, 1921) and Ilvessalo (1920), and other studies of a regional nature, mention should be made of the pattern suggested by Rubner (1934, 1935), whose limiting factor was computed by the number of days having a temperature above 10°C., and the classification plan of climates from the phytogeographical viewpoint, prepared by Emberger (1942), who, on the basis of the thermic and rainy areas, determined nine principal climatic categories.
These classifications make direct use of climatic data; others attempt to attain a closer approximation by utilizing, at least in part, a few of the above-mentioned synthetic indices.
Emberger (1930, 1932) used his own pluviothermic index and the minimum averages of the coldest month in order to determine graphically the Mediterranean phytoclimatic distribution at various "levels" (arid, semiarid, sub-humid, humid, and mountain). 4
4 The phytoclimatic boundaries of the Mediterranean region are being studied by the FAO Mediterranean Subcommission which, at its 1948 and 1950 meetings, discussed the principles according to which a special ecological map should be drawn up.
On the basis of the annual and monthly values as shown in de Martonne's index, Perrin (1931) attempted to identify the climatic boundaries of the main physiognomical forest types, as set forth by Brockmann-Jerosch and Rübel (Pluvisilvae, Laurisylvae, etc.).
Thornthwaite (1931, 1933) utilized efficiency indices for a phytoclimatic distribution of North America and of the world, based on the study of vegetation and soil. 5
5 In a more recent work (1948) Thornthwaite no longer makes use of this empirical criterium, for he prefers to determine the rational climatic boundaries, starting from a comparison between the potential evapo-transpiration (that is to say the quantity of water that would be restored to the atmosphere through evaporation and transpiration under optimum conditions of soil humidity and plant cover) and the rainfall. Such a comparison brings out values indicative of abrupt climate variations, which the author calls points of fracture, corresponding to actual climatic barriers. It is difficult to determine to what extent the purely climatic classification which has been evolved by Thornthwaite may be used for phytogeographic purposes.
More limited research, geographically speaking, was undertaken in 1936 and 1949, for instance, by Giacobbe, who defined seven phytoclimatic areas for the Italian peninsula on the basis of values pertaining to the annual thermic excursion, of the pluviometric system, and of both indices; also by Gonzalez Vasquez (1947) who distinguished, on the basis of the variations in the values of these indices, several types of climate corresponding to as many types of Iberian forests or plant formations.
As far as the methods used for combining and presenting data are concerned, the ingenious procedure adopted by Gaussen deserves to be mentioned. This author used illustrated charts showing the various climatic factors by means of appropriate colors of varying intensity, according to the influence of the factors themselves. A number of shades, each of which assumes a particular ecological significance, is produced by the superimposition of colors. This method is of paramount interest and its application up to date (see Gaussen, 1949 and preceding works; Cure, 1945, 1948) shows plainly the excellent results that may be derived therefrom.
Comparison of Data and Classifications
It is not possible to state which data or which classification are best suited to phytoclimatic purposes without undertaking à comparative study based on concrete evidence.
The most remarkable work in this connection, from the viewpoint of both the extent of the area under review and the wealth of data utilized, is the one by Livingston and Shreve (1921).
These authors compared the vegetation boundaries of the United States with a large number of climatic lines of isovalence, corresponding to specific values of certain data and thermic indices (varied indices of thermic efficacy and particularly the number of days in the frost-free period), and hygric indices (precipitations for the annual or for specific periods, the relationship between rain and evaporation, humidity, etc.), or hygrothermic indices (Livingston's).
Numerous comparisons show that certain boundaries (of the desert and the prairie) are essentially hygric in character; others (of the evergreen broadleaved formations), mostly thermic, and still others (those encompassing the deciduous broadleaved trees and the conifers) disclose a definite interference between the two types of factors.
The main conclusions to be derived from this study are as follows:
(1) Comparisons by means of charts can bear significant results only if applied to very large areas;(2) An adequate measure of agreement between vegetation and climate area may be determined only if the climatic delimitation is based on two or more factors;
(3) The correspondence between the boundaries of vegetation and a few isoclimatic lines does not constitute a conclusive proof of causal correlation, because the influence of climatic factors is always collective and interdependent;
(4) The isovalency lines of a few factors may be parallel and in such a case, to particularize the most efficient factor, a study of correlations in critical sectors must be made for each factor.
Some other comparative studies are Pearson's work (1931) on the Southwestern United States; Hesselmann's (1932) on Sweden; Gams' (1935) on the Mediterranean region; De Philippis' (1937) on Italy.
If a conclusion can be drawn from these studies and others of the same type, it may be asserted that with the data available at present it is practically impossible to arrive at solutions applicable in every case, whether general boundary lines (on a geographical scale) or more limited outlines (on a local or topographical scale) are desired.
The multiplicity of studies, particularly concerning the determination of synthetic formulae, is in itself a definite indication of the complexity and variability of the problem.
In general, it may be said that the classifications based on the direct use of observation data may have a more general meaning, and that a judicious choice of data and their combination (in tabulated, graphic, or cartographic form) may yield an adequate approximation for the requirements of phytoclimatology. On the other hand, such classifications are of little help in the case of limited geographical areas or of exhaustive research; it is then time to utilize synthetic indices.
The use of these has on the whole given less satisfactory results than were expected. In fact, not all indices have proved to have a really phytoclimatic meaning (or a bioclimatic meaning in a more general sense) and at any rate, such meaning does not exceed the boundaries of climatic areas encircled, for instance, by a certain thermic belt.
This inadequacy of synthetic formulae (already pointed out by this writer in 1937) is due to the quite often erroneous choice of mathematical expressions of indices as functions of the variable factors considered. Thus, even though it is a fact that the humidity of a station increases as the rainfall increases, and decreases with the rise in temperature, nothing proves that this is a ratio either direct or inverse, such as that expressed in ratio P/T, for instance.
Efforts have been made to obviate this drawback by resorting to coefficients of correction generally of an empirical character, but in spite of such efforts no standard formulae have yet been found.
A progressively closer approximation will doubtless be arrived at, either for classifications or for indices, when more ample information is available on a greater number of climatic factors, and, above all, when there have been longer periods of observation. When that time comes, it will be possible to select from the more significant and suitable data and to enlarge upon such information (taking into account not only the intensity, but also the periodicity and the frequency with which each climatic factor exercises its influence), and also to determine more clearly the influence of each factor, even in the case of parallel variations or of indirect influences (e.g., physiological aridity due to a low temperature).
This conclusion fully justifies the earnest efforts being made to establish climatic classifications or create synthetic terms of a concrete ecological meaning, which would benefit the scientific and practical purposes of forest phytoclimatology. Such aims include the knowledge of the climatic determination of growth areas, the delimitation of optimum or marginal sectors of the areas of the various forest species, the search for climatic analogy 6 between various areas of the earth's surface, and so forth.
6 The method of "climatic analogies" applied in silviculture by Mayr and Pavari for cultivation purposes (introduction of exotic varieties) has also been widely utilized in agriculture by the Russians and more recently by the Americans. (Au interesting series of articles on agroclimatic findings is now being published by the American Institute of Crop Ecology.)
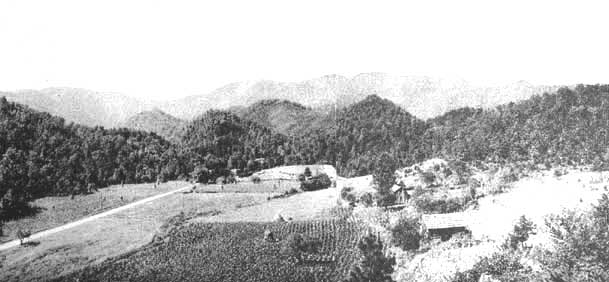
Panorama of the area surrounding the Coweeta Hydrologic Laboratory
Panorama of the area surrounding the Coweeta Hydrologic Laboratory whose work is described in the article, "Research in Forest-Streamflow Relations," appearing on pages 2-9 of this issue. The photograph shows the local land use pattern outside the Laboratory boundaries. In the center can be seen a 40-acre experimental watershed which was cut two years previously to determine the effects of removal of forests on stream flow.
![]()
![]()
![]()