Output from the world's forests for the past years has been some 1,420 to 1,470 million cubic meters annually of coniferous and broadleaved roundwood for all uses. About 55 percent of the total volume of roundwood production has been for industrial uses, the rest being fuelwood. Total fellings of coniferous and broadleaved roundwood in 1951, 1952 and 1953, as reported to FAO are summarized in Table 1.
Table 1. - World roundwood production (in million cubic meters round)
|
Region |
1951 |
1952 |
1953 |
|||
|
Total |
of witch industrial wood |
Total |
of witch industrial wood |
Total |
of witch industrial wood |
|
|
Europe |
266 |
161 |
261 |
160 |
252 |
154 |
|
U.S.S.R. |
335* |
190* |
365* |
205* |
400* |
230 |
|
Canada and United States |
381 |
310 |
376 |
311 |
376 |
315 |
|
Latin America |
171 |
21 |
170 |
21 |
169 |
21 |
|
Asia |
142 |
51 |
138 |
53 |
142 |
54 |
|
Africa |
104 |
9 |
104 |
9 |
105 |
10 |
|
Pacific Area |
22 |
11 |
21 |
11 |
22 |
12 |
|
WORLD TOTAL |
1421 |
753 |
1435 |
770 |
1466 |
796 |
* Estimate.
Changes in the volume of total cut in the world reflect primarily fluctuating production in Europe and North America. There a changing market situation may cause considerable fluctuations in the volume of fellings of the main producing and exporting countries, not at the time when the change in the market takes place but a year or two later. This is the result of the long time lag between actual felling operations and the sale of the final products. Booming market conditions in one year, as for instance in 1951, led to a sizeable rise in the volume of fellings. Later, with a declining market in 1952, the volume of fellings was heavily reduced as industries built up stocks of finished products, drawing largely on their existing supplies of raw materials
In other regions the situation has been somewhat different. In the U.S.S.R., the program for a steadily increasing volume of fellings is making progress and although little official data are available, there is reason to believe that the fulfilment of the plan has not fallen far behind the set target. In Japan, Asia's largest producer, the need for wood for industrial purposes has led to a steady decline in the production of fuelwood. In Latin America, Africa and the Pacific area, more extensive and better use of forest resources, together with increasing local demand for most forest products, is bringing about a steady, although slow, rise in the level of output.
On the basis of available data there seems to have been a slight rise in world roundwood production in 1953, possibly by some 20 million cubic meters. In North America, favorable economic conditions led to rising production of sawn wood and pulp and paper, and consequently also to larger new supplies of industrial roundwood. In Europe, on the other hand, some decline from the level of 1952 appears to have taken place; production of sawlogs rose only insignificantly and that of pulpwood and pitprops declined, notably in the northern European countries. The decline in European production partly offset the rise in North America and slight rises in other regions.
International trade in roundwood, which had already in 1952 felt the downward trend in the market and had declined from the high level of 1951 by some 3.5 percent, fell rather sharply in 1953 by some further 24 percent. This was due primarily to reduced trade in pitprops and pulpwood in Europe and North America which followed the heavy stock-piling in 1951/52 and unfavorable market conditions for forest products in general in 1952.
Table 2. - World exports of roundwood
|
Item |
1950 |
1951 |
1952 |
1953 |
|
in million cu. m. (r.) |
||||
|
Softwood logs |
1.46 |
1.43 |
1.29 |
1.20 |
|
Hardwood logs |
3.15 |
4.16 |
3.68 |
3.90 |
|
Pitprops |
2.10 |
2.53 |
4.60 |
2.10 |
|
Pulpwood |
7.23 |
11.46 |
9.70 |
6.40 |
|
Poles, posts and pilings |
0.54 |
0.57 |
0.56 |
0.70 |
|
TOTAL |
14.48 |
20.15 |
19.83 |
14.30 |
Since the end of 1953, the need of industries in Europe to replenish stocks of raw material simultaneously with a strong current demand for most forest products has brought about a moderate increase in fellings in the most important producing countries. Figures for European trade in roundwood during the first half of 1954 also indicated a noticeable rise from the low level of trade in 1953. In North America, on the other hand, the temporary slowing down of demand and rising stocks of sawn wood and pulp products has so far led to a somewhat reduced activity in the forests.
Table 3. - World of sawn wood
|
Region |
1938 |
1948 |
1940 |
1950 |
1951 |
1952 |
1953 |
|
|
in million cu. m. |
||||||||
|
Europe 1 |
56.91 |
53.52 |
53.86 |
53.74 |
53.59 |
48.97 |
50.05 |
|
|
U.S.S.R. 2 |
34.00 |
40.00 |
45.00 |
49.50 |
55.00* |
60.48 |
64.00 |
|
|
North America |
67.47 |
103.65 |
95.95 |
107.12 |
105.29 |
108.41 |
112.45 |
|
|
Latin America |
4.00 |
8.28 |
8.57 |
7.82 |
9.32 |
9.56 |
9.50* |
|
|
Africa |
1.00 |
1. 50 |
1.70 |
1.78 |
2.11 |
2.28 |
2.45* |
|
|
Near East |
0.30 |
0.55 |
0.37 |
0.42 |
0.48 |
0.54 |
0.55* |
|
|
Asia and Ear East 3 |
18.50 |
11.68 |
13.18 |
16.74 |
17.48 |
21.95 |
22.10* |
|
|
Oceania |
2.50 |
3.62 |
3.83 |
3.98 |
4.40 |
4.37 |
4.45* |
|
|
|
WORLD TOTAL |
184.70 |
222.80 |
222.46 |
241.10 |
247.67 |
256.56 |
265.55 |
* Estimate
1 Includes estimates for countries in eastern Europe.
2 Figures officially reported for 1950, 1952, 1953.
3 Excludes mainland China.
In other regions there seems to be no change from the rather high level of activity that prevailed around the end of 1953; the total cut in the world's forests for 1954 may therefore be expected to show some further rise.
Sawn wood
European and North American production of coniferous and broadleaved sawn wood accounts for some 60 to 65 percent of the total world output of sawn wood. These regions also account for over 90 percent of the world's total exports and about 80 to 85 percent of total imports. In Europe, some 30 to 35 percent of the region's total production of sawn wood enters international trade.
Demand for and consumption of sawn wood are dependent largely on levels of industrial activity and general economic and social conditions, being greatest in those regions where the economic standards are highest, that is, in North America and Europe. So market conditions in these two regions have traditionally set the pattern for the whole world trade in sawn wood. In 1950 to 1952, market trends in North America and Europe differed at times; developments in one region partly balanced those in the other and evened out the general world picture. From the end of 1952 onwards, the "post-Korean" fluctuations in demand and prices stabilized and the general progress of industrial activity and construction in most parts of the world led gradually to more satisfactory market conditions also for sawn wood. World output rose from the 1952 production of 256.56 million cubic meters to 265.55 million cubic meters in 1953, a new record figure. Trade in sawn wood also picked up and was some 27 million cubic meters in 1953 as against 23.5 cubic meters in 1952, remaining however slightly below the record volume of 27.9 million cubic meters in 1951. In Europe, the increased trade was a regional matter; exports to other continents continued to decline. In North America, the strong expansion of industrial activity together with a continuing high level of building resulted in increased output, but the volume of trade between Canada and the United States did not change perceptibly and the decline in exports to Europe was compensated to some extent by larger exports to other continents. In the U.S.S.R., the steady rise of output was used primarily to meet the country's own needs. In Latin America, general economic and trade difficulties hampered the production and trade of sawn wood during the first half of 1953. Towards the end of the year the situation slightly improved, however, and exports by the main producing countries, notably Brazil, to neighboring countries and to other continents showed some increase over 1952. The situation in general, however, remained less satisfactory than in 1951.
In Japan, rapid expansion of the country's industrial production, the heavy backlog of housing requirements and repair, together with steadily growing new housing requirements, put a heavy strain on the Japanese saw-milling industry. Although the output was raised by some 4 percent from the level in 1952 and exports of sawn softwood forbidden, the shortage of sawn wood of all categories was felt increasingly. Payment difficulties made any substantial increase in imports difficult.
While the world market seemed in general favorable, there were some disquieting aspects. The steadying in prices in 1953 had not, at least apparently, succeeded in eliminating the harmful effects of the 1950-52 fluctuations and in restoring the position of sawn wood in the consumer market. In most of the main consuming countries consumption of sawn wood seemed to rise much more slowly from the low levels of 1952 than the rate of industrial activity and even that of house building. Thus, despite the recovery in the volume and trade of sawn wood in 1953, there was no evidence to indicate that there was commensurate increase in actual consumption. Apparent consumption in Europe had fallen from 51.5 million cubic meters in 1950 to 48.5 million cubic meters in 1951 and 47.7 million cubic meters in 1952. In 1953, it recovered only to 48.0 million cubic meters. In North America, also, apparent consumption reached its peak in 1950, at 100.5 million cubic meters to decline in the two succeeding years to 92.6 and 92.0 million cubic meters. In 1953, it recovered to 96.0 million cubic meters. The 1950 to 1951 fall revealed by the above figures no doubt exaggerates the actual decline since there was some drawing on consumers' stocks. Nevertheless, in general it seems clear that lost consumer markets have not been recaptured. A variety of new substitute materials, most of which seem by now to have become firmly established in the highly industrialized regions, has gradually been replacing sawn wood even in some traditional uses. 1
1 The term "substitutes" is not used in any derogatory sense. A substitute may be wood-based and a more efficient material than solid wood for a particular use. It is substitution of wood by "foreign" materials that is the real danger to primary producers.
While North American and European production of sawn wood appears to be approaching the maximum capacity of the forests to furnish timber, and also of the established sawmilling capacity (in Europe, the sawmilling capacity is far in excess of the available raw material supplies), steady progress is being made in other less developed regions to raise the sawmilling potential. But, even so, progress is lagging behind planned expansion because of tight capital, and labor and forest extraction costs.
A smooth and steady evolution of demand for sawn wood cannot be expected, because its principal end uses are influenced by very diverse factors. In recent years, demand has been unusually distorted by political climates and actual war. Demand ought to continue to rise, but in all markets, especially in Europe, price is now the decisive factor.
In fact, the development of trade from the end of 1953 until the late summer of 1954 brought about a further increase in export prices of sawn softwood. The sawmill strike on the west coast of the United States led indirectly to British and other European importers continuing their purchases from northern Europe and the U.S.S.R., because of the fear that, owing to the good market for Canadian goods in the United States, insufficient quantities would be available from Canada to Europe. Wholesale and retail prices in most of the importing countries remained, however, fairly stable, and it became increasingly obvious that higher prices paid by importers were difficult to pass on when reselling goods recently bought.
Table 4. - World trade in sawn wood
|
Region |
1938 |
1948 |
1949 |
1950 |
1951 |
1952 |
1953 |
|
|
|
in million cu. m. |
|||||||
|
Exports |
||||||||
|
Europe 1 |
12.00 |
8.94 |
10.70 |
12.77 |
13.88 |
10.48 |
13.24 |
|
|
U.S.S.R. 2 |
4.80 |
0.27 |
0.62 |
0.85 |
0.64 |
0.60 |
1.04 |
|
|
North America |
6.50 |
7.28 |
6.62 |
10.28 |
11.02 |
9.90 |
9.81 |
|
|
Latin America |
- |
1.57 |
1.32 |
1.82 |
1.86 |
1.52 |
1.36 |
|
|
Africa |
- |
0.14 |
0.15 |
0.19 |
0.24 |
0.25 |
0.30* |
|
|
Near East |
- |
0.03 |
0.02 |
0.03 |
0.04 |
0.02 |
0.02 |
|
|
Asia and Far East 3 |
- |
0.42 |
0.50 |
0.66 |
0.20 |
0.75 |
0.80* |
|
|
Oceania |
- |
0.09 |
0.12 |
0.09 |
0.09 |
0.12 |
0.11* |
|
|
|
WORLD TOTAL |
|
18.74 |
20.05 |
26.69 |
27.97 |
23.64 |
26.68 |
|
Imports |
||||||||
|
Europe 4 |
18.00 |
9.44 |
11.09 |
12.33 |
15.36 |
12.23 |
14.83 |
|
|
U.S.S.R. 5 |
- |
0.45 |
0.28 |
0.01 |
0.29 |
0.58 |
0.33 |
|
|
North America |
1.50 |
4.55 |
3.92 |
8.32 |
6.29 |
6.27 |
6.95 |
|
|
Latin America |
- |
1.27 |
1.36 |
1.45 |
1.87 |
1.53 |
1.32* |
|
|
Africa |
- |
0.71 |
0.69 |
1.26 |
1.16 |
1.03 |
1.04* |
|
|
Near East |
0.50 |
0.55 |
0.96 |
1.08 |
1.12 |
0.74 |
0.1 |
|
|
Asia and Far East 3 |
- |
0.17 |
0.23 |
0.29 |
0.33 |
0.46 |
0.50* |
|
|
Oceania |
- |
0.43 |
0.64 |
0.69 |
1.06 |
0.72 |
0.46* |
|
|
|
WORLD TOTAL |
|
17.57 |
19.17 |
25.43 |
27.48 |
23.56 |
26.44 |
* Estimate.
1 Includes exports from eastern European countries to western Europe only, except for 1938.
2 Exports to western Europe only, except for 1938.
3 Excludes mainland China.
4 Includes imports by eastern Europe as reported by exporting countries in western Europe.
5 Imports as reported by exporting countries in western Europe, except for 1938.
Table 5. - World production of plywood and fiberboard
Plywood and fiberboard
Plywood and fiberboard have ranges of use which considerably overlap. For many purposes they can replace each other; in many end uses they both compete with sawn wood. Since the end of the war there has been a considerable expansion in the output of both these commodities, comparable with that which has taken place in the case of wood pulp. World production of plywood in 1938 (including that of the U.S.S.R.) amounted to about 2.85 million cubic meters, by 1951 it had reached 6.79 million cubic meters and rose to 8.34 million cubic meters in 1953. World output of fiberboards (wallboards or fiber building boards) rose from 780 thousand tons in 1938 to 2.5 million tons in 1951 and 2.6 million tons in 1953; world fiberboard capacity today may be estimated at around 3 million tons. 2
2 A commodity report on Fiberboards in the March 1954 issue of Unasylva described production as beginning in the U.S.A. in the early 1920's. By this was meant large-scale commercial production. In a letter to Unasylva, a Director of the Sundeala Board Company Ltd., London, England, points out that his company produced in 1898 the first fiber building-board to be manufactured on a commercial scale in any part of the world: "Agasote, the original board, was a hard-board and in the first week of manufacture we produced 10 tons which in those days and as a pioneer effort, was an extremely good feat".
Table 6. - World trade in plywood and fiberboard
Like all other forest products, consumption of these commodities was affected by the events of 1950 to 1952. International trade declined particularly sharply, and was slow to recover; not until mid-1953 was any substantial improvement noted. However, neither for plywood nor for fiberboard were the price fluctuations recorded in 1951 and 1952 as violent as those which occurred in the rest of the forest products field. An explanation may be found in the fact that, as demand began to revive and consumer stocks began to need replenishing, expanded domestic capacity absorbed the first wave of new orders. Not until consumption had made a substantial recovery was it necessary for buyers to look for additional foreign supplies. As the main producing countries intend a very substantial part of total production for export, they had to wait much longer than exporters of sawn wood, pulp and paper to share in the restored stability which in general characterized 1953.
Whereas most forest products prices strengthened in the course of 1953, registering advances of 5 to 10 percent during the year, plywood and fiberboard prices remained steady, and even by the late spring of 1954 only fractional increases had been recorded. With continuously favorable market conditions, the volume of international trade began to show a noticeable increase from the level in 1953; and by the autumn of 1954 even prices had shown some further strengthening, although the rise was still inferior to that of sawn wood prices.
World plywood and fiberboard capacity continues to expand. In both commodities technical progress is diversifying the product and rapidly extending the range of end uses. The future holds great possibilities for both, but especially for fiberboard (and chipboard) for which the raw material requirements need not be exacting while the establishment of a mill of economic size does not call for investment on a prohibitive scale. In the long run, therefore, it seems probable that world trade in these commodities, though it may well increase beyond the present level, will inevitably become less and less important in relation to total world output. A corollary of this is that plywood and fiberboard industries that are primarily geared towards export markets will become increasingly vulnerable.
Wood pulp and, pulp products
The year 1952 had been marked by a serious recession in the world pulp and paper trade. Very early in the year consumers began to react sharply to the unprecedented price rises of 1951. The impact on output and trade was all the more intense since consumer stocks had been built up during the boom and the turn of the year brought a check, and in many cases a setback, in industrial activity. There was a real fall in consumption; buying was curtailed even more sharply and, in spite of the consequent price fall, the pulp and pulp products market remained stagnant during most of 1952. Board and wrapping grades of paper, used in almost every sector of the economy, were particularly affected. Newsprint alone was exempt from these market vicissitudes. The demand for newsprint remained at a high level and output continued to rise during 1952.
Table 7. - World production of wood pulp
|
Region |
1938 |
1950 |
1951 |
1952 |
1955 | |
|
|
thousand tons | |||||
|
Europe (western) |
106141 |
8530 |
9430 |
8480 |
9050 | |
|
Finland, Nor way, Sweden |
(6071) |
(6087) |
(6647) |
(5917) |
(6223) | |
|
Europe (eastern) |
- |
1150* |
1250* |
1300* |
1350* | |
|
U.S.S.R. |
1163 |
1600* |
1800* |
2000* |
2100* | |
|
U.S.A. |
5384 |
13471 |
14964 |
14070 |
14840 | |
|
Canada |
3254 |
7462 |
8152 |
7890 |
7930 | |
|
Latin America |
25 |
300 |
310 |
340 |
400* | |
|
Asia |
930 |
725 |
1080 |
1270 |
1540 | |
|
Oceania |
- |
154 |
154 |
220 |
230 | |
|
|
WORLD TOTAL |
21370 |
33390 |
37140 |
35570 |
37440 |
* Estimate.
1 Including eastern Europe.
All regions shared in the market fluctuations of 1950 to 1952, but it was in Europe, which is the most important pulp and pulp products exporting region and where general economic activity slackened most, that they were most intense As mill stocks accumulated in the main producing, and especially the exporting, countries production was curtailed. Many mills closed down temporarily; others went over to short-time working.
Table 8. - World trade in wood pulp
|
Region |
1938 |
1950 |
1951 |
1952 |
1953 | |
|
|
thousand tons | |||||
|
Exports | ||||||
|
Europe |
4083 |
3910 |
3950 |
3190 |
3990 | |
|
Finland, Norway, Sweden |
(3738) |
(3701) |
(3763) |
(3029) |
(3764) | |
|
Canada |
500 |
1662 |
2021 |
1751 |
1763 | |
|
|
WORLD TOTAL |
4700* |
5660 |
6180 |
5130 |
5900 |
|
Imports | ||||||
|
Europe |
3008 |
2973 |
3236 |
2708 |
3101 | |
|
U.S.A. |
1550 |
2164 |
2145 |
1756 |
1958 | |
|
Latin America |
- |
317 |
329 |
260 |
201 | |
|
|
WORLD TOTAL |
4700* |
5530 |
5880 |
4930 |
5500 |
* Estimate.
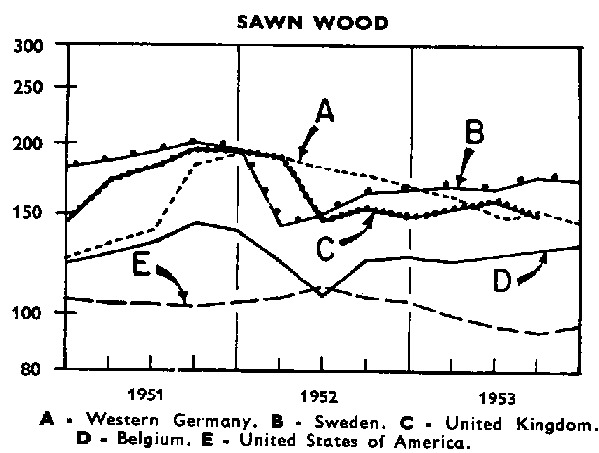
Prices of Forest Products (First Quarter 1950=100). Sawn Wood
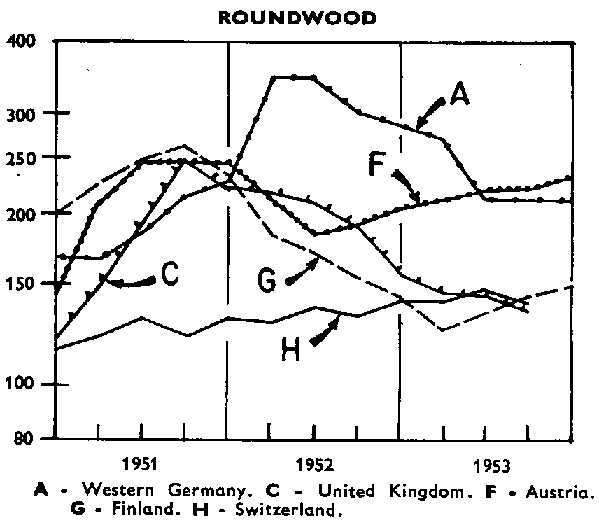
Prices of Forest Products (First Quarter 1950=100). Roundwood
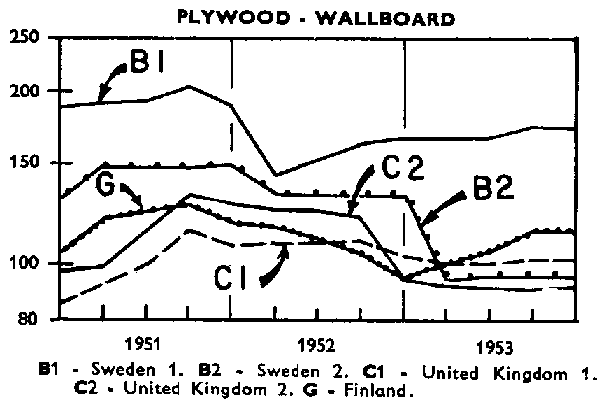
Prices of Forest Products (First Quarter 1950=100). Plywood-wallboard
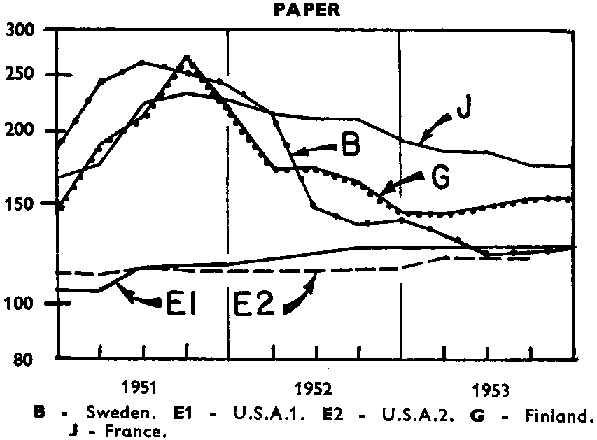
Prices of Forest Products (First Quarter 1950=100). Paper
Prices of Forest Products (First Quarter 1950=100). Wood Pulp
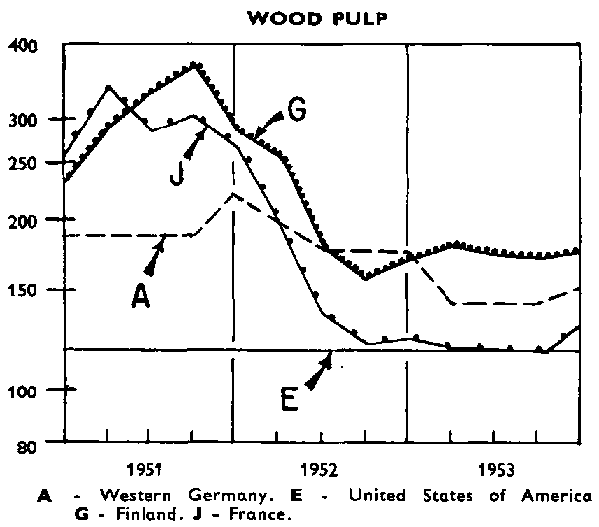
NOTES:
Sawn woodBelgium: imported; Sweden: f.o.b.; U.K. c.i.f.; U.S.A.: domestic; W. Germany: domestic.Roundwood
U.K.: pitprops, c.i.f.; W. Germany: pitprops, domestic. Finland: pulpwood, f.o.b.: Austria: sawlogs, domestic. Switzerland: sawlogs, domestic.Plywood-Wallboard
Sweden 1: Sawn softwood, f.o.b. 2½ "x 7" u/s battens. Finland: birch plywood, f.o.b.; U.K.1: Finnish birch plywood, c.i.f.: U.K.: Other plywood, c.i.f.; Sweden 2: wallboard 1/8" hard, f.o.b.Wood Pulp
U.S: domestic, Sweden: bleached sulphite f.o.b. France: bleached sulphite, c.i.f. Rouen: W. Germany: Bavaria, unbleached sulphite station of destination.'Paper
Finland: Newsprint f.o.b., U.S.1: newsprint, France: newsprint, 1/1, 50,52 9;. excluding taxes, station of departure. Sweden: Kraft, f.o.b.: U.S.2: printing.
Table 9. - World production of newsprint
|
Region |
1938 |
1950 |
1951 |
1952 |
1953 | |
|
|
thousand tons | |||||
|
Europe |
2801 |
2570 |
2650 |
2670 |
2825 | |
|
|
Finland, Sweden, Norway |
(819) |
(910) |
(910) |
(927) |
(948) |
|
|
United Kingdom |
(813) |
(553) |
(535) |
(546) |
(613) |
|
|
Eastern Europe |
- |
(290)* |
(315)* |
(330)* |
(360)* |
|
Canada |
2625 |
4825 |
5045 |
5177 |
5190 | |
|
U.S.A. |
755 |
919 |
1006 |
1006 |
966 | |
|
Latin America |
- |
50 |
50 |
50 |
60* | |
|
Asia 1 |
200* |
185 |
220 |
340 |
491 | |
|
Oceania |
- |
30 |
30 |
33 |
46 | |
|
U.S.S.R. |
227 |
360* |
400* |
425* |
450* | |
|
|
WORLD TOTAL |
6600* |
8935 |
9400 |
9700 |
10030 |
* Estimates.
1 incl. estimates for China: 45 in 1950, 50 in 1951, 60 in 1952 and 70 in 1953.
As the year 1952 advanced, the demand for pulp products rose, and pulp and paper mills began to resume operations on a normal scale.
The year 1953 opened on a note of renewed, if still cautious, optimism. By the spring, production was back to a high level in most countries and had reached record levels in some. There were some exceptions, notably Finland, where there remained the problem of adjusting internal costs to the now stabilized level of world prices. The favorable development continued also in 1954 and led to a marked increase in the volume of output and trade. With general economic conditions continuing favorable, the year may prove to be one of a reasonably high level of activity, at fairly stable prices, for the world market in pulp and its products.
World pulp production rose from 35.6 million tons in 1952 to 37.4 million tons in 1953, thus exceeding the record 1951 figure by 300,000 tons. U.S. expansion accounted for most of the increase, but there were substantial advances also in Japan, Canada and several European countries. World trade in pulp also expanded, by about 700 thousand tons, though the total volume fell slightly short of the record 1951 figure. It may be noted, however, that exports from the three northern European countries, which together account for over three-fifths of the world total, were almost exactly back to the 1951 peak volume.
Production and trade in these countries continued to thrive in the early months of 1954. Optimism also seems to pervade the North American market. Elsewhere in the world, the rapid expansion of Japanese capacity continues, while slow but steady progress is being made in raising domestic capacity in the less developed areas of the world, especially in Latin America. Several new mills are expected to come into operation during the next two years, while many are under discussion. 3
3 Possibilities for expanding production in Latin America were discussed at a meeting of pulp and paper experts in Buenos Aires in October, sponsored jointly by FAO, the Economic Commission for Latin America, and the United Nations Technical Assistance Administration.
The recovery in 1953 was reflected also in improved output and trade in paper and paperboard. World newsprint production rose from 9.7 million tons in 1952 to 10.0 million tons in 1953; in 1951, output had totalled 9.4 million tons. Production of other categories of paper increased sharply from the low 1952 level, while failing to regain the record 1951 level; paperboard output, however, registered the biggest advance, reaching a new record level in 1953, the most notable increase being that recorded in the United States. Though paperboard production declined slightly in the early months of 1954, it seems probable that the volume of world output of all categories of paper and paperboard, taken together, will in 1954 exceed that of any previous year.
World newsprint exports in 1953 totalled 5.92 million tons against 5.85 million tons in the previous year. Other paper and paperboard exports rose by 0.30 million tons- to 2.14 million tons; this was, however, well below the 1951 volume, 2.43 million tons. The market continued satisfactory through the spring months of 1954. Though the rate of influx of new orders slackened, paper mills in most countries continued to operate at near capacity to cope with outstanding orders. In North America, the world's largest consumer of paper and paperboard, demand is expected to remain firm in 1954. Capacity is continuing to rise; since 1949 paper, paperboard and wood pulp capacity in the United States have increased by 13, 26 and 39 percent respectively. Much of this capacity was, of course, planned in 1950 and 1951, when boom conditions prevailed, and it would seem that expansion has run somewhat ahead of domestic demand. How far excess capacity can be applied to satisfying the rising needs of wood- and pulp-deficit-regions will depend on the latter's capacity to pay for dollar imports.
Thus the long-term upward trend in world demand for pulp products seems to have reasserted itself in 1953. This trend, the dominant one in the field of forest products since the war, is certain to continue, though the possibility of temporary interruptions will remain. The danger is any serious disparity between the rate at which new capacity is being created and the rate at which effective demand can be made to rise.