![]()
![]()
![]()
FAO STAFF
FAO has just published, under the title World Forest Inventory 1958, the results of its third quinquennial inquiry. The following pages reproduce most of the text of the introduction to that publication, together with a selection from the summary tables.
A SOUND national forest policy aims at the rational development and exploitation of forest resources on the principle of the greatest good for the greatest number. To formulate such a policy, as precise a knowledge as possible of the wood resources of the country is required. These data a forest inventory must provide. To famish all the elements necessary for policy formulation, the inventory should yield information on the forested area, ownership, composition and management status, as well as estimates of the volumes of standing timber, annual growth, fellings and removals.
" Two factors give rise to the need for world-wide inventories. First, the population of the world is increasing steadily, on average by one and a half per cent annually; forest resources, on the other hand, are in the short term relatively fixed, at any rate in extent. On a world scale efforts are necessary to ensure that forest output rises commensurately with world needs. Secondly, forest needs are by no means co-terminous with forest resources, since the factors which determine forest distribution transcend political boundaries. Hence the need arises for the co-ordination of national forest policies. In other words, the peoples of all nations and regions are becoming increasingly conscious of their interdependence, of the existence of ' one world.'
" FAO is alive to this, and not only because the forests are a repository of important raw materials, but also because they play a decisive role in agricultural economy by protecting crop lands and regulating the water regime. Thus a knowledge of the world's forest resources is vital to the execution of the program of FAO in its broader aspects, and not merely to that of its Forestry and Forest Products Division alone."
With these words FAO prefaced its publication of the results of the 1953 World Forest Inventory.1 These words, still valid, succinctly express the nature and purpose of an inventory of world forest resources and the reasons why FAO has assumed responsibility for carrying out such inventories. They may therefore serve to introduce the present publication.
1 World Forest Resources, FAO, March 1955. Results of the first inventory (1947) were published in Unasylva, Vol. II, No. 4, 1948, and Vol. IV, No. 2, 1950 under the title " Forest Resources of the World."
When the Conference of FAO, at its sixth session, in 1951, recommended that the Organization should, at five-year intervals, collect and publish available information on the forest resources of the world, it recognized that this kind of inquiry must be repeated at intervals. Not only are forested area, growing stock, growth and fellings constantly changing under the impact of a variety of technical, economic and social factors; national statistics are steadily improving - extensively and intensively. In many countries the area covered by the national inventory increases year by year, while new methods of stocktaking give more detail and greater precision. Aerial photography, with improved equipment, allied to ground surveys, making use of modem sampling methods, has made it possible for many countries with limited funds at their disposal for inventory work to step up the rate at which their national inventories are being conducted. In many cases they have been able to obtain technical help, from FAO or from countries operating bilateral technical assistance schemes.
Preparations for this third world forest inventory followed the lines established for the previous inventory. The advice of an expert group was sought on the scope of the inventory and on the definitions to be employed. Helpful comments on a draft questionnaire were obtained from experts in all regions. The forms finally agreed were despatched to all member countries, including dependent territories, and transmitted to several non-member countries. Meanwhile FAO staff assembled information from various official and unofficial sources concerning the resources of other non-member countries.
A hundred and forty-three countries, representing 88 percent of the world forest area, replied to these questionnaires. In the 1953 inventory replies were received from 126 countries, representing 73 percent of the world forest area. Not all the replies were complete, and the information received was therefore supplemented with the aid of authorities in member countries, FAO Technical Assistance field experts, official reports and, all else failing, by recourse to the 1953 and 1947 reports.
The sources of information for the 1953 and 1958 inventories are summarized in Table 1. If it is borne in mind that the official statistics on which a substantial part of the 1953 inventory rested were in many cases considerably out of date, it is clear that the present inventory has a greater claim than its predecessors to provide a comprehensive picture of the extent of the world's forests.
TABLE 1. - INFORMATION SOURCES
|
Source |
1958 Inventory |
1953 Inventory |
||
|
Number of countries |
% of world forest area |
Number of countries |
% of world forest area |
|
|
Replies to: |
||||
|
1958 questionnaire |
143 |
88 |
|
|
|
1953 questionnaire |
13 |
2 |
126 |
73 |
|
1947 questionnaire |
5 |
2 |
10 |
3 |
|
Official statistics |
34 |
5 |
57 |
24 |
|
Unofficial reports |
15 |
3 |
5 |
- |
|
TOTAL |
210 |
|
198 |
|
The introduction to the report on the results of the 1953 world forest inventory explained in some detail why it had not proved possible to compare the 1953 figures with those reported in 1947. It went on to say: " The steady progress now being made, together with increasing uniformity in approach and clarity in definition, offer the hope that valuable conclusions may be drawn when the results of the 1958 inventory are compared with those of the current one." This hope has been only partly realized. For whereas in 1955 it was expected that the pattern of future world inventories would not depart substantially from that established in the 1953 inventory, certain changes were in the event deemed desirable by the experts who met to determine the scope of the 1958 inquiry. These changes, and the reasons for them, are discussed in some detail below. Some of them undoubtedly had the effect of reducing comparability between the successive inventories. This, however, is certainly not the main ground for non-comparability. Much more important is the impact of improvements in national statistics. Some examples of the effect of these changes are given in the pages which follow.
What must never be overlooked, in interpreting the figures which appear in the tables and text which follow, is that none of the component elements of the statistics are more precise or up to date than the national inventory data on which they are based. Carrying out a national forest inventory is a long and costly business. How long and how costly depend not only on the types of forest to be surveyed, but also on the amount of detail which the national forest authorities require. Each authority, in devising its inventory plans, has to compromise between the intensity of the inventory and the area to be covered on the one hand, and the funds available and the time by which the results are required on the other. Even relatively wealthy countries, with a keen awareness of the significance of their forest resources and with sizeable funds available for inventory work, have to effect some such compromise. Some have had recourse to a continuous inventory, whereby a given area is surveyed each year, the total forest area being covered in a 10- or 15- year cycle, the cycle thereafter being repeated. The partial results flowing in each year can, of course, be used to arrive at more accurate assessments of national totals.
In other countries, the inventory may be tailored to meet the most urgent national needs. For example, relatively sparse information may be sought concerning the total forest area - perhaps merely location and extent - but more intensive information (species, age, or diameter distribution, growing stock and growth) for those areas where exploitation is currently taking place or is contemplated in the near future. In general, most of the national inventory data are estimates based on partial inventories. For very many countries of the world a complete inventory does not as yet exist.
Moreover, a national inventory must try to elicit answers to a number of questions relative to the formulation of national forest policy which a world inventory cannot hope to cover. The world forest inventory confines itself to ascertaining a limited range of salient facts, which can provide a general picture of the nature and extent of the world's forests, the wealth of resources they contain, and the modifications they are undergoing under the influence of man.
In designing the 1958 questionnaire, the secretariat and the advising experts had clearly in mind the desirability of preserving continuity with earlier inventories. At the same time, a detailed examination of the results of the previous inventory made it clear that a number of changes were needed. In some cases replies received had shown the need for greater clarity in the definitions adopted to ensure that the recipients of the questionnaires were in no doubt as to the information required. In other cases a perusal of the 1953 replies showed that the information sought could not be readily supplied by most countries at the present stage of development of national forest inventories. It was therefore necessary to revise concepts (as distinct from definitions) in order to elicit information which would be both more meaningful and easier to furnish. In addition, the inadequate response to certain questions in 1953 led to the omission of these questions in 1958. Finally, it was decided to insert one or two new questions intended to throw additional light on the potential value of the forest resources reported.
Inevitably some of these changes, which are discussed in detail below, have affected comparability with the previous inventory.
The 1958 inventory includes information falling into the following main groups:
Forest area, in relation to other land categories
Accessible forests: area and ownership
Forests-in-use: composition, management, growing stock, growth, fellings and removals
Other roundwood sources
Changes in forest area.
In the 1958 inventory forest is defined with somewhat more precision than hitherto. Thus, bamboo lands and wattle (Acacia spp.) plantations are specifically included, while savanna types with an average density of tree cover below 0.05 are excluded, as are nonforest crop lands such as rubber and cinchona.
In the earlier inventory many respondents experienced difficulty in deciding whether or not fuelwood cutting for local domestic use, which is widespread in all regions of the world, warranted the classification of forests as " in use." They were given further guidance in the 1958 inventory by the following note:
" Note on fuelwood: Although nearly all forest lands are capable of producing some fuelwood, and are often used to some extent for that purpose, the utilization of forests for occasional smallscale fuelwood cutting does not place them either in the " accessible," " forests-in-use," or " productive " classes. The exact delineation of these classes win vary somewhat between countries and will be determined by the competent authorities in each country. "
The amplified notes in the 1958 inventory on forests and fuelwood did not stem from any change in concept, but were designed solely to give greater clarity in the definition. Even so, depending upon the interpretations accorded by respondents in the previous inquiry, areas may be included in the present inventory which were excluded in 1953, and vice-versa.
The 1953 inventory questionnaire sought a subdivision of the area of forest-in-use into those with a predominantly economic character and those with mainly protective functions. The distinction was not a happy one, carrying as it did the implication that forests which serve primarily a protective role are " noneconomic." In fact, of course, the protective functions of the forest are strictly economic, though their evaluation in monetary terms often presents considerable difficulty. More important, however, was the fact that relatively few countries were able to draw this distinction. On the other hand, it was clear that more and more countries, intent upon assessing the potential of their accessible forests, are attempting to distinguish broadly between those which they deem productive (producing or capable of producing usable crops of wood or other forest products) and those deemed unproductive. For the 1958 inventory, therefore, this classification has been adopted as being at once more meaningful and more readily available. Here the present inventory provides new and valuable information.
The definition of accessible forests has also been changed. In the 1953 inventory these were defined as forests " now within reach of economic management or exploitation." Whether a forest is presently within reach of economic management or exploitation is not an easy matter to decide. Moreover, a rise in the price of wood could in some instances make considerable areas of forest " accessible " in this sense, while a price fall could relegate forests to the inaccessible class. Evidently, a definition so vulnerable to short-term fluctuations and so subject to individual interpretation had to be discarded. Instead, the 1958 inventory defines accessibility in purely physical terms: " areas within reach of exploitation by existing transportation systems." The revised definition is not, of course, itself immune from objection. Clearly, different forest authorities will interpret it in different ways and it would be unwise to attach any great importance to inter-country comparisons. However, it does afford forest authorities the possibility of furnishing figures which are consistent in successive inventories.
Questions asked in 1953 but discarded in 1958, either because the response was poor or because the information supplied did not lend itself to compilation, relate to the distribution by size of individual privately-owned forests and to the species composition of growing stock in forests-in-use.
The World Forest Inventory naturally concentrates attention upon forest areas. Forest area alone, however, can convey a very misleading impression of the potential of the forest resource. There is obviously need for some indication, however approximate, of the quality of the forest. This point was stressed in reporting the results of the 1953 inventory, where it was noted that " in many parts of the world - in Africa, for example - dense forests shade off into open stands with a continuous sheet of grass, finally passing into shrub and thorny formations. Where does the forest end and brushland begin? The answer to this question frequently depends on local administrative convenience, so that areas classified as forests may in fact bear only a few small and deformed trees per hectare, along with scattered thorny shrubs of no economic value. Grazing grounds, whether grazed by wild or domestic animals, if they occur within the forest area, are more often than not classified as forest since they usually come under the supervision of the forest administration. Thus the term forest in this inventory covers stands of very different densities."
The revised definition of forests in the 1958 inventory, already mentioned, to some extent sharpens the picture the inventory gives us of the forested area, by specifically excluding land with very low timber cover. In addition, a tree cover section asks countries to report the proportions of the exploited forest area in density classes.
The important role played by bamboo in the forest and timber economies in many Asian countries led to the inclusion for the first time of questions on the area of bamboo forests and the volume of bamboo removals.
In previous inventories attention was centred on the forests-in-use, the forests which are naturally best documented and for which national forest authorities are able to provide most detailed information. Yet a number of questions were asked about the inaccessible forests. The results showed, however, that relatively few countries were able to furnish the information requested. In the 1958 inventory, therefore, questions on composition, growing stock and increment in inaccessible forests were discarded, and instead a broad classification into productive and unproductive (as defined earlier) sought. As in the preceding inventory, countries were asked to indicate the area which had become accessible in the course of the preceding quinquennium, and an estimate of the area expected to become accessible in the near future. This last question, however, was this time limited to the inaccessible productive forest, and covered a 10-year, instead of a five-year, period.
FIGURE 1. - Land classification.
These changes, too, were designed to elicit more useful information about those categories of forest resources which, on paper, represent potential wood reserves - i.e., the forests presently inaccessible and accessible forests not yet in use. For the same reason, in the section relating to changes in forest area, a question was asked on the estimated area of productive forest which was deemed to have become unproductive during the preceding quinquennium.
To throw fight on the impact on the forest of shifting cultivation, widespread in Asia, Africa and Latin America, countries were asked to state separately growth losses due to this cause.
Finally, the sections of the questionnaire relating to the wood harvest were elaborated in order to secure data that might help to fill certain evident gaps in present information. Thus not only were particulars sought of recorded removals in forests-in-use and from trees outside the forest, but additionally, estimates were requested of the volume of removals not recorded in forests-in-use and also of removals from forests other than those classified as in use. In all cases, the questions related to fellings, losses in logging and transportation, and removals - not because it was expected that data would be available for each of these headings in every instance, but to serve as a useful reminder of the distinction between fellings (drain on the forest) and removals (wood supply).
These would seem to be a fairly formidable list of changes, given that the designers of the present inventory were anxious to retain as far as possible comparability with its predecessors. However, none was lightly introduced, and it was the firm belief of those preparing the questionnaire that each of the changes, the reasons for which have just been explained, would improve the quality and usefulness of the information received. In the light of experience gathered to date, it would be rash to claim that the scope and coverage of this periodic inquiry will not change in the future. Indeed, so long as the progress in improving national statistics continues at its present rapid rate, there is something to be gained from retaining a measure of flexibility in the form of the questionnaire. The argument for comparability is strong; but it cannot be decisive so long as the magnitude of changes due to statistical improvement obscures the real changes which are taking place in the forest. National forest inventories are not as yet sufficiently established to warrant casting a periodic world inquiry into a definite and final shape.
When the results of national inventories are added together to arrive at regional and world totals, the ensuing figures are not completely homogeneous. The figures reported by countries are based on local concepts and definitions, adapted to national needs; these may vary considerably from country to country. But although the figures differ, they have one thing in common: they reflect broadly the current view of the national forestry authorities as to what is utilizable. Examples from the data for growing stock and for fellings will illustrate some of the differences.
In reporting the volume of growing stock, many countries include branches and tops but exclude stumps. Out of 102 countries for which growing stock figures were received, however, 34 exclude all branches and tops, and 34 others exclude branches alone or either branches or tops less than a given diameter. The growing stock estimates of six countries include the volume of stumps. Finally, some countries report only commercial species in their growing stock, or trees above specified diameters - which vary, for example, from 3 centimeters in Chile to 50 centimeters in Sarawak.
TABLE 2. - COMPONENTS OF GROWING STOCK ESTIMATES 1958
|
Category |
Number of countries1 |
|
|
including in estimates |
not including in estimates |
|
|
All species |
66 |
20 |
|
All ages and diameters |
57 |
29 |
|
Stumps |
6 |
80 |
|
Tops above merchantable diameter |
44 |
42 |
|
Branches |
17 |
69 |
|
Fuelwood |
65 |
21 |
1 Details not available for 16 countries.
The volume of fellings is of importance in the comparisons that are made between forest increment, allowable cut and the timber harvest. Most countries unfortunately report only the removals of roundwood, and the fellings, cannot easily be derived because of insufficient data on logging and transport losses. Only 36 countries were able to report fellings and the attendant losses, out of 51 countries that gave some fellings data. No meaningful regional fellings could be calculated except for Europe. In the use of fellings and removals figures it must be remembered that the inclusion or exclusion of trees of varying diameter, and the differences in the handling of branches and tops in the statistics result in considerable variations in the totals. Furthermore, the bark factor is of considerable importance. Growing stock and increment are usually reported with bark, whereas, fellings and removals are without bark. The reports from countries usually, but not always, indicated whether bark is included or excluded. Conversions in which a bark factor must be applied are often necessary, and the bark factors used were the percentages reported by countries, or, where these were lacking, a general factor of 10 percent.
The foregoing section has set out the scope of the 1958 inquiry, drawing attention to certain changes as compared with the preceding inquiry. It has also discussed some of the features of the data which limit intercountry comparisons. It may also be useful to give, first, an account of the extent to which countries were able to respond to various parts of the questionnaire and, second, a brief explanation of the way in which the data have been compiled and presented.
Of the 143 countries that were able to furnish data on forest area, most could also provide information on ownership and removals. More than half could give estimates of growing stock, but only half, or rather less than half, on growth and changes in forest area. Surprisingly few countries (51) provided estimates of fellings. Details of the response to the several categories of information sought are set out in Table 3.
Table 3. - REPORTS ON DETAILS OF FORESTS RESOURCES, 1958
In some instances the relative response was, contrary to expectation, lower than in 1953 - for example, on fellings. Some fall in relative response was, of course, to be expected, since the additional countries reporting on this occasion were, in several cases, countries where forest statistics are at an early stage of development. This, however, fails to explain why fewer countries have furnished information about afforestation and fellings. A careful scrutiny of the individual replies, however, leads to the following paradoxical conclusion: an increasing awareness of the statistical complexities has frequently discouraged countries from making estimates. Thus, on fellings, inhibiting factors have been a clearer understanding of the distinction between fellings and removals, and growing awareness of the importance of unrecorded fellings; and on afforestation, a consciousness of the fact that private, as distinct from public, afforestation is inadequately recorded. While it is perhaps understandable that increasing knowledge brings increasing diffidence - a phenomenon by no means confined to forest statistics - it is evident that a reasoned guess by the national forest authority, based on intimate knowledge of the forest resource, can provide figures of undoubted value for incorporation into regional and world totals. This is a point which will no doubt command particular attention when the next world inquiry is designed.
The information received on the 1958 questionnaires, after scrutiny and in many cases back-checking with the country, was assembled in eleven basic tables which form the bulk of the published report. It was possible to fill out these tables in a number of instances with other reliable official information -earlier inventory reports, published statistics, etc. All this information - i.e., appearing in the basic tables - is referred to in the text which follows as " reported data "; the reader will therefore bear in mind that throughout the following analysis " reported data " include some figures not derived directly from the current inventory.
The reported data have been summarized, for the convenience of the reader, in the series of text tables presented in the following section. Since, however, coverage is seldom complete, and moreover varies from region to region, these summaries of reported data in many cases fail to provide the reader with the indications of regional and world totals he is entitled to expect. Wherever possible, therefore, alongside the reported data have been presented secretariat estimates of these totals. In preparing these estimates, the secretariat has drawn on a wide variety of information, other than reported data, available to it. This information comes from many sources, is rather scattered and not always precise. It consists of reports by field experts, private publications, travel reports, and so forth: in short, information not of sufficient precision to warrant inclusion in the basic tables, but helpful in building up a broad regional and world picture. Where no indications were available, it was sometimes possible to argue by analogy from the facts known about a neighboring country where forest conditions are similar.
In the following three tables, an attempt has been made to estimate world totals for some of the more important elements of the inventory. These estimates, since they are based mainly on reported data, encompass all those defects in the information submitted which have already been referred to. Further possibilities of error are introduced in assembling figures for those regions where response was low.
TABLE A. - CLASSIFICATION OF FORESTS
TABLE B. - GROWING STOCK AND INCREMENT IN FORESTS-IN-USE
TABLE C. - DISTRIBUTION OF FOREST RESOURCES
|
Region |
Forests |
Growing stock |
Gross increment |
Removals |
||
|
Total |
Accessible |
In use |
||||
|
Percentage |
||||||
|
Europe |
3 |
5 |
9 |
7 |
12 |
18 |
|
U.S.S.R. |
26 |
41 |
32 |
45 |
30 |
21 |
|
North America |
17 |
15 |
27 |
23 |
29 |
25 |
|
Central America |
2 |
2 |
1 |
1 |
1 |
2 |
|
South America |
21 |
10 |
5 |
5 |
7 |
10 |
|
Africa |
17 |
14 |
9 |
4 |
4 |
7 |
|
Asia |
12 |
12 |
16 |
14 |
16 |
16 |
|
Pacific Area |
2 |
1 |
1 |
1 |
1 |
1 |
|
TOTAL |
100 |
100 |
100 |
100 |
100 |
100 |
TABLE 4. - LAND CLASSIFICATION
|
Region |
Forests |
Nonforested land |
Total land |
Forests as % of land area |
Forest per caput |
||
|
Total |
Accessible |
Inaccessible |
|||||
|
Million hectares |
% |
Hectares |
|||||
|
Europe |
141 |
138 |
3 |
332 |
473 |
30 |
0.3 |
|
U.S.S.R. |
1 131 |
1 131 |
- |
1 103 |
2 234 |
51 |
5.5 |
|
North America |
733 |
400 |
333 |
1 141 |
1 874 |
39 |
3.8 |
|
Central America |
74 |
55 |
19 |
198 |
272 |
27 |
1.4 |
|
South America |
957 |
277 |
680 |
818 |
1 775 |
54 |
7.3 |
|
Africa |
753 |
380 |
373 |
2 225 |
2 978 |
25 |
3.4 |
|
Asia |
520 |
326 |
194 |
2 198 |
2 718 |
19 |
0.3 |
|
Pacific Area |
96 |
26 |
70 |
758 |
854 |
11 |
6.5 |
|
TOTAL |
4 405 |
2 733 |
1 672 |
8 773 |
13 178 |
33 |
1.6 |
Such regional and world totals as are included, therefore, in no case result from a simple grossing-up of reported data on the basis of the percentage coverage indicated; they are built up country by country on the basis of reported data and a mass of miscellaneous information.
The reader will find these FAO estimates throughout the text which follows, as the different categories of information afforded by the inventory are discussed in turn. For his convenience, the main elements have been brought together in the world estimates: Tables A, B and C, which conclude the discussion of the results. In the published report the salient information is illustrated in six charts which precede the text. Two of these charts are published here.
The regional distribution of the world's forests is summarized in Table 4.
Almost exactly one third of the earth's land surface is under forest; a further 24 percent is devoted to permanent agriculture. The remainder, 43 percent, consists mainly of uncultivated land, including brush lands and very sparsely timbered savanna areas. There is a widespread belief that nonforested lands not under cultivation are idle lands, having no economic function and representing in their entirety a potential resource for the extension of agriculture or of forest. There could be no greater misconception. These " wild lands " as well as the forests contribute to wood production and play an important part in preventing soil erosion, regulating stream flow, affording grazing and sheltering game. The uncultivated, non-forested lands thus frequently have extremely important -economic functions and their value may be as great or greater than similar areas of forests managed primarily for timber production. The management of all or part of these uncultivated lands is entrusted in many countries to the forest authorities.
A fourth of the world's forests are located in the U.S.S.R. and over one fifth in South America. These two regions also have the highest proportion of land area covered by forest - 54 percent in South America, 51 percent in the U.S.S.R. The Pacific Area, with 11 percent, has the lowest percentage of forested land. The uneven distribution of the world's forests, however, is more evident when considered in relation to the population the forests have to serve. Thus South America at one extreme has 7.3 hectares of forest per inhabitant, while, at the other, both Europe and Asia have only 0.3 hectare. Since Asia accounts for 56 percent of the world population, the average for the world as a whole is 1.6 hectares.
About three fifths of the world forest area is deemed accessible - within reach of exploitation by existing waterways, roads, railways or other means of transportation.
Though very little forest area remains inaccessible in Europe, 71 percent of South American forests are still beyond reach and vast areas remain inaccessible in Africa and Asia. It should be observed, however, that forests in North America and the U.S.S.R. are not classified as to accessibility in the sense used in this inventory. The figures included in the Table for these two regions should therefore be treated with reserve, as should the world total.
Of the 2,700 million hectares of forest today physically within reach of exploitation, only slightly over half (1,465 million hectares) is presently in use. Very substantial areas of unexploited but accessible forest remain in South America and Africa, relatively small areas in Europe and the Pacific Area. Noteworthy is the fact that 72 percent of Asia's accessible forests is already being exploited.
There is a tendency to look upon the accessible but still unexploited areas of forest as the primary reserve from which rising timber requirements will be met in the years to come. The suitability of these forests for exploitation depends very largely upon what they contain, and undue concentration on the areas apparently available can be misleading. Generally speaking, these forests are less well stocked, and stocked with less desirable species, than those which have already been taken into exploitation. Moreover, in several regions of the world, population pressure will in the coming years compel the alienation of some of these lands to agriculture. Finally, this category of forest undoubtedly includes considerable areas where exploitation will need to be prohibited or restricted if their protective functions are not to be impaired. As will be seen later, many of the forests presently in use are underexploited, and it is likely that efforts will tend to concentrate on securing enhanced yield, improved harvest and better utilization.
TABLE 5. - ACCESSIBLE FORESTS
|
Region |
Reported data |
Estimated totals |
||||
|
Total |
In use |
Not exploited |
Total |
In use |
Not exploited |
|
|
Million hectares |
||||||
|
Europe |
138 |
135 |
3 |
138 |
135 |
3 |
|
U.S.S.R. |
1 131 |
459 |
672 |
1 131 |
459 |
672 |
|
North America |
400 |
400 |
- |
400 |
400 |
- |
|
Central America |
53 |
12 |
41 |
55 |
14 |
41 |
|
South America |
277 |
76 |
201 |
277 |
76 |
201 |
|
Africa |
339 |
106 |
233 |
380 |
125 |
255 |
|
Asia |
313 |
229 |
84 |
326 |
236 |
90 |
|
Pacific Area |
25 |
1,10 |
5 1 |
25 1 |
20 1 |
5 |
The inventory provides fairly reliable information on the ownership of accessible forests. Over three quarters of the world's accessible forest land is publicly owned, either by the state (64 percent) or by other public entities (12 percent). Private ownership is most marked in Europe (55 percent), South America (45 percent), and North America (43 percent).
TABLE 6. - OWNERSHIP OF ACCESSIBLE FORESTS
|
Region |
Coverage1 |
Forms of ownership2 |
||
|
State forests |
Other public forests |
Private forests |
||
|
Percent |
||||
|
Europe |
100 |
33 |
12 |
55 |
|
U.S.S.R. |
100 |
95 |
5 |
- |
|
North America |
100 |
18 |
39 |
43 |
|
Central America |
23 |
50 |
10 |
40 |
|
South America |
88 |
55 |
- |
45 |
|
Africa |
89 |
65 |
21 |
14 |
|
Asia |
96 |
84 |
9 |
7 |
|
Pacific Area |
99 |
59 |
1 |
40 |
|
TOTAL |
95 |
64 |
12 |
24 |
1 Area of accessible forests for which ownership data were reported, divided by total area of accessible forests.
2 Reported countries only.
Some information is also available, though it is not included in Table 6, on the importance of farm forests. These account for about 55 percent of the privately-owned accessible forest lands in Europe, 45 percent in North America, 25 percent in Asia and about 80 percent in Africa. Reports from South America and the Pacific Area are too fragmentary to provide a good picture of farm forest area in these regions.
In reporting on the 1953 inventory it was observed that " in the less developed regions, especially in the remoter areas, considerable tracts of forest are unmapped, unsurveyed, and without established titles. Recognition of titles in the forest is a corollary of growing consciousness, public and private, of the extent and value of these resources; it is often a precursor of, and usually a prerequisite for, extended forest administration." There is some evidence to show that in these less developed regions - particularly in countries which have recently achieved independence - as determination of titles proceeds there is an increasing disposition to establish public titles to forest land. This evidence is derived from a scrutiny of individual returns. In any comparison of the aggregate tables for this and the preceding inventory, changes in ownership are overshadowed by the substantially greater areas of forest revealed by recent inventories in countries with planned economies, where public ownership is general.
Many countries provided information about the area of forest owned by industrial enterprises. Table 7 lists those countries where industrially-owned forests cover a substantial area (over 250,000 hectares) or represent a substantial proportion (over 25 percent) of all privately-owned forest.
TABLE 7. - SELECTED DATA RELATING TO FORESTS OWNED BY INDUSTRIAL ENTERPRISES
|
Country |
1,000 hectares |
% of all private forests |
|
Ivory Coast |
300 |
100 |
|
Tanganyika |
259 |
100 |
|
Guatemala |
960 |
79 |
|
Colombia |
2 800 |
74 |
|
Dominican Republic |
423 |
70 |
|
Madagascar |
550 |
55 |
|
Canada |
4 699 |
39 |
|
Sweden |
5 620 |
33 |
|
United States |
25 246 |
17 |
|
Norway |
716 |
12 |
|
Finland |
1 644 |
11 |
|
Japan |
794 |
6 |
|
Spain |
450 |
3 |
Of the countries which reported this information, 34 were able to distinguish between forest owned by industrial enterprises operating wood-using plants and that owned by other industrial enterprises. Of the 14.5 million hectares so distinguished, 10.4 million hectares, or 72 percent, are owned by forest industries. Not surprisingly, it is in the countries where forest industries are highly developed that steps have been taken by industry to control its own wood supply. Some of the figures returned include, in fact, plantations established by industry. It will be interesting to see whether the next inventory confirms the general impression that there is a marked upward trend in this category of ownership, since this is bound to have an impact on the level of management. As is well known, many important forest industry enterprises today are setting a good example in management practice, It is much more difficult to ensure that sound principles of forestry are applied in the many millions of small private forest holdings, some information about which was presented in the report on the 1953 inventory, but extension work among farm forest owners is now regarded by many national forest authorities as one of their most important tasks.
TABLE 8. - COMPOSITION OF FOREST-IN-USE1
|
Region |
Coverage2 |
Total |
Conifers |
Nonconifers |
Mixed woods3 |
Open areas3 |
% conifers4 |
|
% |
Million hectares |
||||||
|
Europe |
100 |
135 |
72 |
49 |
10 |
4 |
59 |
|
U.S.S.R. |
100 |
459 |
(...362... |
...97... |
......... |
......) |
79 |
|
North America |
100 |
400 |
188 |
102 |
70 |
40 |
55 |
|
Central America |
78 |
14 |
(...4... |
...10... |
...-... |
...-...) |
29 |
|
South America |
99 |
76 |
7 |
61 |
4 |
4 |
11 |
|
Africa |
85 |
125 |
(...2... |
...122... |
...1... |
......) |
2 |
|
Asia |
97 |
236 |
38 |
185 |
7 |
6 |
17 |
|
Pacific Area |
99 |
20 |
(...4... |
...15... |
...1... |
......) |
22 |
|
TOTAL |
98 |
1 465 |
677 |
641 |
93 |
54 |
54 |
1 The figures in this table axe world estimates. Separate figures for reported data only are not given, because they cover all but 31 million hectares of the forests-in-use.
2 Area of forests-in-use for which composition data were reported, divided by total area of forests-in-use.
3 Mixed Woods and open areas are often Included in the area of pure conifers and nonconifers. The total figures for pure stands are therefore overstated and those for mixed woods and open areas understated.
4 Includes a reported allowance for conifers in mixed stands.
The composition of the world's exploited forests is summarized in Table 8. Taking account of the conifers included in the mixed forests, more than half the forest area exploited today consists of coniferous species. These are largely concentrated in the cool temperature zones of the northern hemisphere, so that the U.S.S.R., North America and Europe account for 92 percent of all coniferous forest under exploitation.
The exploited broadleaved stands are more evenly distributed, though it is striking that the three aforementioned regions, where the broadleaved stands consist almost entirely of temperate hardwoods, account for as much as 300 million hectares, or 42 percent, of all hardwood stands exploited. Of the vast areas of tropical broadleaved forest in Central and South America, Africa and Asia (over 2,000 million hectares according to an estimate given later in this report) only one sixth are regularly yielding timber or other forest products.
The data reported do not make possible an assessment of the area of forest under bamboo, a forest product which plays an important role in many Asian and some Latin-American countries. Some particulars are given in the published report, but these clearly relate in most cases only to those bamboo stands which can readily be distinguished and do not include the considerable areas within the forest where bamboo has taken possession following exploitation and shifting cultivation.
Table 8 gives a fairly complete picture of the composition of the exploited forests. The composition of the total world forest area (including accessible forests not yet exploited and forests still inaccessible) is very different. In Table A (to be found on page 137 of the text of this report) an attempt has been made to estimate the composition of all the world forest area. It shows that 46 percent of the world's coniferous stands have been brought into use, but only 26 percent of the broadleaved forest, tropical and temperate, is as yet under exploitation. Whereas coniferous forests represent 37 percent of all the world's forests, they account for 52 percent of the forests which have so far been brought under exploitation.
The reasons why the coniferous forests have so far been brought more effectively into use are well known and need not be repeated here. It is perhaps worth while, however, to stress once again the danger of attaching too much importance to forest area and failing to take into account sufficiently the quality of the forests. This will become clear later in this report, when data concerning growing stock and density of tree cover are discussed.
The progress made in prescribing areas to be maintained permanently under forest, the extent to which forest areas are managed with working plans, and the quality of cutting practices reported, all afford important indications of certain aspects of forest management.
FIGURE 2. - Growing stock in forest-in-use
The designation of land which it is intended to maintain permanently as forest is an important first step towards rational management of the forest. It constitutes a recognition of the need for a permanent forest area, it may involve a careful assessment of future forest needs, for productive and protective purposes, and it indicates the area within which management efforts will be concentrated. A number of countries reported in 1958 that failed to report in 1953, and several countries reporting in both inquiries were able to record substantial progress. If it is assumed, as would seem reasonable, that certain countries which reported in 1953 and failed to do so in 1958 had no change to report, the data summarized in Table 9 afford a clear indication of considerable progress made during the quinquennium.
TABLE 9. - PERMANENT FORESTS
|
Region |
1953 |
1958 |
||
|
Countries reporting |
Total area |
Countries reporting |
Total area |
|
|
1,000 hectares |
1,000 hectares |
|||
|
Europe |
27 |
123 290 |
27 |
124 030 |
|
Central America |
11 |
690 |
13 |
4 325 |
|
South America |
5 |
540 |
9 |
151 970 |
|
Africa |
16 |
80 750 |
31 |
54 320 |
|
Asia |
20 |
84 560 |
25 |
122 240 |
|
Pacific Area |
6 |
7 810 |
7 |
8 610 |
|
TOTAL |
85 |
297 640 |
112 |
465 495 |
Each region has some progress to report, even Africa, where the area reserved would seem to have diminished. This diminution is purely a statistical one, arising from the revised definition of forested land: it has excluded from the 1958 figures considerable areas of savanna land where the density of tree cover was less than 0.05. The fact of progress becomes clearer if for the several regions only those countries which specifically reported changes between 1953 and 1958 are listed.
TABLE 10. - CHANGES IN AREA OF PERMANENT FORESTS IN SELECTED COUNTRIES BETWEEN 1953 AND 1958
|
Region |
Countries reporting changes |
Permanent forests |
||||
|
1953 |
1958 |
Increase in area |
||||
|
1,000 hectares |
||||||
|
Europe |
10 |
13 119 |
13 |
8 |
77 |
758 |
|
Central America |
2 |
147 |
1 |
9 |
06 |
1 759 |
|
South America |
1 |
1,40 |
3 |
4 |
96 |
3 356 |
|
Africa |
8 |
9 874 |
25 |
0 |
27 |
15 153 |
|
Asia |
11 |
30 131 |
40 |
0 |
80 |
9 949 |
|
Pacific Area |
3 |
7 378 |
8 |
1 |
73 |
795 |
|
TOTAL |
35 |
60 789 |
92 |
5 |
59 |
31 770 |
This selection also omits those countries where the revised definition of forested land has had a serious impact on the statistics. The figures are thus strictly comparable and afford evidence of a gratifying increase in the area designated as permanent forest.
Considerable progress has also been made in establishing working plans, though the somewhat different coverage of the returns under this heading in the 1953 and 1958 inventories requires caution in drawing comparisons. Information is summarized for the two inventories in Table 11.
TABLE 11. - MANAGEMENT STATUS IN FORESTS-IN-USE
Coverage on this question has improved in Europe, and there would appear to have been a distinct increase in the area managed with working plans. There has been a slight increase also in North America (the figures here relate only to Canada); the sharp fall in the percentage area under plans arises, it should be noted, from a revised interpretation of forests-in-use. Little or no change is recorded in South America, Africa and the Pacific Area, but a very substantial advance in Asia, where the area under working plans has been notably extended in Burma, India, Japan and Thailand. For the first time, information is available for the U.S.S.R., where close on half of the 636 million hectares of national forests (Goslesfond) are managed with working plans.
Table 12 affords an interesting summary of how national forest authorities viewed prevailing cutting practices in their countries in 1953 and 1958. Inevitably these are figures which will not bear comparison from country to country, between regions, or even over time, since views as to what constitutes good cutting practice are evidently a matter of opinion. Even so, an " opinion poll " on such an important subject is not without interest. Coverage is roughly the same in both inventories, and it is evident (unless national standards have undergone important changes in the intervening years) that, in the view of those submitting the reports, no significant improvement has been effected. A reasonably high proportion of good cutting practices are held to prevail in Europe, North America (in this case the figure relates to the United States only) and the Pacific Area. Elsewhere good cutting practices are deemed the exception rather than the rule. Those authorities which report a high prevalence of poor or destructive cutting practices have clearly concern for the future of the forest crop.
TABLE 12. - CUTTING PRACTICES IN FOREST-IN-USE
It is perhaps significant that although the forest land area under working plans has increased in the past quinquennium., the quality of cutting in many countries has changed very little, although some overall improvement is recorded. Of the countries which were able to report an increase in the area under working plans, relatively few were able to report an improvement in cutting practices. Any conclusions drawn from these indications must, of course, be subject to the reservation that criteria for judging the quality of cutting may have changed and that the statistics of the area under working plans may have improved. Nevertheless, foresters will undoubtedly agree that much remains to be done in improving the management of the forests in all regions. For this improvement a necessary first step may be the drawing up of working plans, but even more important is the practical application of the measures outlined in the plan, the practice of forestry on the ground. The high prevalence of cutting practices deemed poor and destructive is a measure of the task confronting foresters.
Many more countries - 95 in all, representing 37 percent of the total area of exploited forests - have reported on the silvicultural system in force. Of the total forest area reported, coppice occupies 7 percent, and is particularly important in Southern Europe, Central America and Africa. Coppice with standards comprises 5 percent, and the remainder - 88 percent - high forest. Coppice yields mainly fuelwood and wood for charcoal burning, but can also provide poles, posts, fencing material and the like, as well as tanning bark and fodder. Coppice with standards also yields a low percentage of industrial wood, though it has naturally a proportion of larger-dimensioned material. The highest yield of industrial wood, however, comes from the high forest, and this accounts for the widespread, though by no means universal, trend towards the gradual conversion of coppice to high forest. Not universal, because there are conditions where coppice is the most appropriate system, by virtue of the assortments it yields and the foliage fodder it provides.
The process of conversion is, of course, a slow one, and a comparison of the reported figures with those of the earlier inventory does not allow of any general conclusions, since statistical improvements have largely obscured the slow changes which are taking place. These are evidenced, however, in the data for one or two European countries which have maintained accurate statistics of forest under different silvicultural systems for many years.
The five years which have passed since the last world forest inventory have undoubtedly seen more activity in assessing the contents of the forest than any previous quinquennium. Up to 1953, in many of the advanced countries, the first postwar national inventories were only just getting into their stride. Since then substantial progress has been made, and most countries in Europe are now able to make a fairly reliable estimate of their growing stock. The same is true for North America and the U.S.S.R. Over the same period, many of the countries in Asia, Africa and Latin America have been able, often using modern inventory methods and obtaining technical guidance from overseas, to ascertain with more precision the growing stock on at least part of their exploited forest, thus widening and improving the basis for estimates of growing stock in all forests-in-use. The new information which has come to light during this period has brought with it some drastic revisions of earlier estimates. How drastic may he seen from the comparative figures set out in Table 13.
TABLE 13. - GROWING STOCK PER HECTARE: IN FOREST-IN-USE
From this Table (which includes reported figures only) it will be seen that coverage has improved in Europe and that the most recent information available indicates a rather higher growing stock per hectare, for conifers and in total, than was reported in 1953. The data for the U.S.S.R. (which relate, actually, to the State Forest Fund - Goslesfond - and thus do not cover all exploited forests) incorporate the results of the national forest inventory which has been proceeding rapidly in recent years. In North America earlier estimates of growing stock have been revised sharply upward; the figures for Canada relate to accessible productive forests and those for the United States to all productive forests. For Latin America the figures show no substantial change, though it will he noted that coverage is low in both years. Africa shows the most drastic change, and this calls for some explanation. First, it will be noted that coverage has fallen somewhat; this stems from the rejection of some earlier figures which have proved, on closer investigation, to be excessively optimistic. Secondly, a number of countries which previously made estimates of total growing stock (all species) on the basis of rather tenuous data, have now submitted rather more precise data covering commercial species only. It is in this region, in fact, that the exclusions from the growing stock estimates (noncommercial species, trees below a certain diameter) loom largest, and the information available is unfortunately insufficient to allow of any grossing up to a total (all species, all diameters) basis. This very important reservation - which also applies, though with less weight, to Asia and Latin America also - should be kept firmly in mind in interpreting the summary tables which follow. In Asia, where coverage was high in both years, new data have raised the earlier estimate for conifers; the lower figure for nonconifers is largely due to classification changes, notably the exclusion of noncommercial species from the estimates for Thailand.
If the reported data on growing stock are taken as a starting point, and such assumptions as seem reasonable are made about the growing stock per hectare in non reporting countries, it is possible to build up a tentative picture of growing stock in all the world's exploited forests. This is done in Table 14.
TABLE 14. - GROWING STOCK IN FOREST-IN-USE
Total growing stock in all the world's exploited forests is thus now estimated in cubic meters at 156 million, as against 101 million estimated on the basis of the results of the last world inventory. This tentative estimate, it will be remembered, excludes - for very many countries - trees below certain diameters and species deemed without present commercial value. The increase as compared with the last inventory is partly due to changes in classification which have led to the reporting of greater areas of forest as " in-use," partly to a definite extension of the area of forest under exploitation, and partly to higher estimates of standing timber per hectare flowing from the most recent inventory information.
It will be recalled that in 1958, for the first time, countries were asked to report on the density of tree cover in their exploited forests. It was believed that this question might throw much needed light on the character of the forests presently taken into exploitation in the different regions of the world. The response to this question was far from complete, but the following table, summarizing the data reported, affords some interesting new indications:
TABLE 15. - ESTIMATED DENSITY IN FOREST-IN-USE
|
Region |
Coverage1 |
Good |
Medium |
Poor |
None |
|
Percentage |
|||||
|
Europe |
86 |
47 |
36 |
13 |
4 |
|
Central America |
24 |
47 |
29 |
18 |
6 |
|
South America |
16 |
51 |
33 1 |
15 |
1 |
|
Africa |
54 |
17 |
39 |
36 |
|
|
Asia |
28 |
32 |
48 |
16 |
4 |
|
Pacific Area |
6 |
22 |
49 1 |
29 |
- |
1 Area of forests-in-use for which data concerning density were reported, divided by total area of forests-in-use.
These figures should not, of course, be interpreted without discrimination. A low tree cover may reflect a temporary phase in the evolution of a forest adequately stocked. Such areas, however, represent a fairly small proportion of the total area of forests-in-use reported on under this heading. The Table reveals that in Europe, where response to this question has been good, there is a surprisingly high proportion of forest with poor or only fair tree cover, when it is borne in mind that it is in this region that management is most intense. In Africa, where data are available for over half the exploited forests, only one sixth of the forest area is regarded as having good tree cover. The data for other regions are too sparse to permit of generalizations; even so, the relatively high proportion of reported forests in all regions described as of poor or nil density points to the danger of assuming that all forests so far taken into exploitation are necessarily rich in content.
Do the data assembled in the inventory permit a rough assessment of the timber content of all the world's forests, including the accessible forests not yet under exploitation and the vast area of forest so far inaccessible? Evidently this is a very cavalier operation, but piecing together the various indications afforded by the inventory, and taking into account the views (reported later) of national forest authorities concerning the proportion of the still inaccessible areas which may prove to be productive, one can hazard the guess - it is no more than a guess - that the volume of growing timber in the world today is of the order of 320 thousand million cubic meters.
The coverage of the reported data on gross increment shown in Table 16 is less than in the 1953 inventory in Europe, the Americas and Asia. Somewhat better returns were received from Africa and the Pacific Area.
TABLE 16. - GROWTH IN FOREST-IN-USE
Insufficient information on losses (fire, shifting cultivation, insect, fungus, etc.) was reported to allow meaningful estimates of net growth by regions. Such estimates as were reported indicate that the magnitude of these losses ranges from a low of about 3 percent of the gross increment in Europe to a high of about 48 percent in the Pacific Area.
The reported data, with such other information as was available, were used to estimate the regional and world gross increment shown in Table 16. These estimates are necessarily rough - when forestry authorities are reluctant to make estimates for a single country it obviously takes courage to make estimates for a whole region. Nevertheless, the gross increment figures were built up country by country and aggregated for the regions. The results reflect the changes countries have made in their growing stock estimates, which were discussed in a previous section, and also changes stemming from new data compiled in many countries, for example in the U.S.S.R. and the countries of North America.
A comparison of the present estimates with the figures in the 1953 inventory shows small increases in the volume of annual growth in Europe, the two Latin-American regions and the Pacific area. As a result of new forest appraisals, the growth estimates for the U.S.S.R. and North America are much higher. For Africa and Asia, however, the new estimates are lower, for two main reasons: many countries changed reports from an " all species " estimate to " commercial species only," and new information indicated in some countries that the former growth estimates were too optimistic.
The growth (gross) for the world's forests-in-use is now estimated to total about 2,800 million cubic meters compared with the 1953 estimate of 2,390 million. Of this volume 51 percent is in the coniferous species; in 1953 the coniferous percentage reported was 45. The change results mainly from the higher growth figures reported for the U.S.S.R. and North America. These two regions account for 60 percent of the annual gross increment of all the world's forests-in-use, 81 percent of the annual volume increase in conifers and 37 percent of that in non-conifers. Changes in gross growth figures arise partly from changes in forest area (already discussed) and partly from revised estimates of growth per hectare.
When calculated on a per hectare basis, the gross increment estimates show a rise in the U.S.S.R. and North America for both conifers and nonconifers, for reasons already mentioned. New data from Africa have influenced the regional estimates upward for conifers, reflecting the favorable growth rates found in many plantations of exotic species, but a drastic decrease has been indicated for the nonconifers. This is partly a result of the change in reporting whereby certain non-marketable species and sizes are left out of the estimates. Many countries also have found that the growth in virgin or newly-cut stands is considerably less than the theoretical volume.
Very favorable per hectare growth figures are reported for both Central and South America. It will be interesting to see whether these figures are confirmed by the new inventories and forest resource appraisals being initiated or in progress in several of the Latin-American countries. The average growth in cubic meters per hectare for the world is estimated at 2.2 for conifers, 2.0 for nonconifers and 2.1 for all species; in the 1953 inventory the figures were 1.8, 2.5 and 2.1, respectively.
An appreciable part of the losses included in Table 16 are a result of the practice of shifting cultivation. In the tropical regions - Asia, Africa, Central and South America - many of the forest lands cannot be considered as dependable sources of industrial products until this practice has been eliminated or controlled. Most countries subject to the waste of shifting cultivation cannot give more than rough estimates of the wood volume destroyed annually, but an average from 14 reporting countries indicates that it amounts to about 17 percent of the gross increment. The figures for a few selected countries are shown in Table 17.
TABLE 17. - LOSSES FROM SHIFTING CULTIVATION IN SELECTED COUNTRIES
|
Country |
Million m³ |
% of gross increment |
|
Philippines |
5 826 |
40 |
|
Viet-Nam, South |
800 |
31 |
|
Senegal |
1 300 |
17 |
|
Sudan |
354 |
12 |
|
Madagascar |
240 |
5 |
The concept of allowable cut is used in many countries to guide the fellings, that may be planned or authorized over a period of time. Many countries in the tropical regions, however, report that their fellings are controlled on other bases, for example by cutting areas or girth limits. It is believed, also, from the reports received that in many instances an allowable cut figure has been set, near or equal to the estimated net growth, as a matter of principle rather than as the expression of a policy which is being effectively implemented. In other words, there would seem to be a number of forest authorities that recognize the desirability of adjusting fellings to growth, even though the related data they report - e.g., on management status - suggest that the means at their disposal for doing so are inadequate.
Two of the largest forested countries, the U.S.S.R. and the United States, do not report allowable cut. Most of the countries of Europe, on the other hand, attach considerable importance to the allowable cut concept. Their management plans for individual forest tracts contain estimates of allowable cut and the figures can be aggregated to derive allowable cut estimates for the countries. In these countries the production of the forests (net growth) and the policy decisions on harvesting (allowable cut) are correlated in the working plans, and the volume of fellings, gives some indication of how well the plans are being carried out. These figures are shown for Europe in Table 18.
TABLE 18. - NET GROWTH, ALLOWABLE CUT AND FELLINGS IN FOREST-IN-USE IN EUROPE
|
Coverage1 |
Total |
Per hectare |
|||
|
Net growth |
Allowable cut |
Fellings |
Net growth |
Allowable cut |
|
|
% |
Million m³ with bark |
m³ with bark |
|||
|
93 |
309 |
276 |
282 |
2.5 |
2.2 |
1 Area of forests-in-use for which data for not growth, allowable cut and fellings were reported, divided by total area of forests-in-use.
Fellings will deviate from allowable cut for particular years because of fluctuations influenced by market conditions, extraction difficulties arising from adverse climate, etc. For a number of* European countries the allowable cut is set by national forest policy at a figure lower than the net growth in order to build up the growing stock to more desirable levels. In a few countries, a different situation exists, the allowable cut figure exceeds net growth, perhaps to allow for conversion of overmature stands to more productive young stands.
During the course of the past few years, FAO has compiled information on medium-term forecasts of forest removals in Europe. For 20 countries for which full information is available, the 1958 removals (which are less than fellings by the amount of logging and transport losses) exceed the allowable cut by 16 percent. At the same time the allowable cut for these countries has been set at 9 percent below net growth. The forecasts show that removals in the year 1965 will still exceed the 1958 net growth by 4 percent. Thus, in certain European countries, market needs and other considerations have so far overruled the objectives set out by the forestry authorities in the management plans, or - and this is known to be true in one or two cases there is tacit recognition of the fact that allowable cut has been set at a conservatively low figure.
TABLE 19. - REMOVALS FROM THE WORLD'S FOREST
Complete felling figures are available from relatively few countries. Removals volumes are, however, published annually in the FAO Yearbook of Forest Products Statistics and cover nearly all the countries of the world.
The difference between the removals and the volume of timber actually felled, which constitutes the amount of losses in logging and transportation, ranges from a low of less than 10 percent as an average for the countries of Europe to as much as 25 to 35 percent for some countries of Latin America and Asia.
The removals volumes shown in Table 19 include not only the recorded removals from forests-in-use, but also such information as is available on unrecorded volumes, removals from trees outside the forests and removals from forests classified as other than " in-use." The latter two types of removals will be discussed in more detail in the section on " other roundwood supplies."
World removals of roundwood have in fact risen considerably since the time of the last inventory.2
2 The comparison in the table and the paragraph which follows is actually with data taken from World Forest Products Statistics, A Ten Year Summary, 1946-1955, which includes more comprehensive figures than were included in the 1953 Inventory report.
World removals have risen by 179 million cubic meters or 12 percent. A bigger proportion of the world's timber output is being used industrially, 56 percent as against 52 percent in 1950-52. It should be noted, however, that statistics for fuelwood are understated in many regions because of the large unrecorded amounts used by local inhabitants. There are grounds for believing that the amounts - very substantial - escaping record are diminishing, so that the fall in fuelwood removals per 1,000 inhabitants, from 281 to 268 cubic meters shown in Table 19 almost certainly reflects a real decrease in consumption.
Industrial wood removals have not only risen in total; they have risen also on a cubic meters per caput basis., from 583 per 1,000 inhabitants to 602, or by 3 percent. The increase is most marked for the U.S.S.R. (12 percent).
A significant proportion of the roundwood removals discussed in the preceding section is derived from sources other than forests under active commercial exploitation. The most important " outside " sources for both industrial wood and fuelwood are trees planted along roads, railways and canals, trees in parks and gardens, trees in windbreaks, brushlands and agricultural zones, the timber of which is collectively termed " trees outside the forests." According to 1958 figures reported to FAO, 37 countries have removals from trees outside the forests with volumes ranging up to 99 percent of total removals in Tanganyika. The figures for some selected countries are shown in Table 20.
TABLE 20. - REMOVALS FROM TREES OUTSIDE THE: FORESTS IN SELECTED COUNTRIES, 1958
|
Country |
11000 m³ |
% of total removals |
|
Tanganyika |
20 503 |
99 |
|
Southern Rhodesia |
2 999 |
95 |
|
Tunisia |
673 |
76 |
|
Italy |
9 902 |
49 |
|
Ceylon |
125 |
39 |
The proportion of industrial wood in the removals from trees outside the forests in 1958 was 6 percent. It is safe to say that the volume of wood harvested from this source is not fully known and deserves further study by forestry authorities in countries where better knowledge of present raw material sources and potential future supplies is needed.
In order to avoid overlooking any important source of roundwood removals the 1958 inventory requested data on volumes derived from forests other than those classified as " in-use." As was expected, removals from such areas are very small, on a worldwide basis slightly over I percent of the reported global volume.
The volume of removals from unrecorded sources, from trees outside the forests and from forests classified as other than " in-use " constitute important elements in the supply of both industrial wood and fuelwood in many countries.
The afforestation accomplishments of 70 countries are reported in the present inventory; 83 countries reported in 1953. The total area reported as afforested was considerably greater, however, with over 3.95 million hectares planted during the five years 1953-57, as compared with 2.65 million planted during the six-year period 1947-52. There is reason to believe that the reports are not complete even though in some regions, for example in Europe, considerable progress in improving afforestation statistics has been made in recent years. Areas afforested privately, without any form of state aid, still escape record in many countries. The regional figures are given in Table 2 1.
TABLE 21. - AFFORESTED AREAS BETWEEN 1953 AND 1957
|
Region |
Number of countries |
1,000 hectares |
|
Europe |
20 |
1 831 |
|
Central America |
2 |
5 |
|
South America |
3 |
159 |
|
Africa |
25 |
634 |
|
Asia |
16 |
1 255 |
|
Pacific Area |
4 |
67 |
|
TOTAL |
70 |
3 951 |
The areas planned for afforestation for the 1953-57 period and reported in the 1953 inventory were exceeded by a number of countries, for example, some noteworthy achievements were recorded in the following (planned areas in parentheses): Denmark 6,000 hectares (3,200), Western Germany 40,000 (20,000), Ireland 33,000 (24,000), Norway 53,000 (31,000), Portugal 138,000 (40,000), Madagascar 50,000 (9,000), Ruanda-Urundi 20,000 (10,000), Sierra Leone 30,000 (1,600), South Korea 492,000 (229,000), Taiwan 205,000 (75,000) and Australia 51,000 (41,000). The largest afforested areas were reported from Spain, Southern Korea, Poland. Belgian Congo, Japan and Taiwan.
The reporting countries expect to afforest 2,578,000 hectares during the quinquennium ending in 1962, a reduction of 35 percent from the area afforested during the previous five-year period.
Some diminutions in forest area have offset the favorable record in afforestation. The largest reduction was reported from the Philippines, where much forest land was reclassified as agricultural land. Other countries reporting large reductions were Senegal, Ghana, Bulgaria, Sudan, Mauritania and Honduras.
With transportation systems steadily improving, more and more of the world's forests are coming within reach of exploitation. It has already been noted that the proportion of the forest area deemed accessible in 1958 is 62 percent, as against 47 percent in 1953. These figures, of course, considerably overstate the improvement which has occurred since, as has already been pointed out, the definition of accessibility has changed and statistics generally have improved. Providing these qualifications are borne in mind, however, the figures in Table 22, summarizing some of the more important reported changes, are of considerable interest.
TABLE 22. - INCREASE IN ACCESSIBLE FORESTS
|
Region |
Number of countries |
Areas which have become accessible 1953-57 |
|
1,000 hectares |
||
|
Asia |
8 |
13 202 |
|
Africa |
7 |
9 900 |
|
South America |
1 |
1800 |
|
Europe |
5 |
722 |
|
Central America |
2 |
213 |
|
Pacific Area |
1 |
8 |
The next World Forest Inventory will no doubt show more clearly the impact of improving communications on forest accessibility.
Among the countries in which improvements in transportation during the next decade will open up large new forest areas are Ecuador, Sudan, Liberia, Burma, Honduras and Thailand.
As the forests become more accessible and as forest industries are developed, more and more areas will be exploited. In response to the inventory question on how much area was expected to be put into use during the decade ending in 1968, 29 countries reported, with the increase in exploited forests expected to total over 28 million hectares. The increases in selected countries are shown in Table 23.
Changes in forest area from productive to unproductive from causes such as misure of land and vegetative cover, from accelerated erosion, flooding for hydroelectric developments, etc., were reported by only 12 countries and involved 850,000 hectares. Cases of deterioration in the productivity of forest lands occur in all parts of the world but statistics on the areas involved are often not available.
TABLE 23. - INCREASE IN FOREST-IN-USE IN SELECTED COUNTRIES
|
Country |
Expected increase by 1968 |
|
|
1,000 hectares |
% of forest-in-use |
|
|
Federation of Malaya |
777 |
353 |
|
Ecuador |
1 000 |
333 |
|
New Guinea (Austr.) and Papua |
405 |
162 |
|
Spanish Guinea |
350 |
146 |
|
Sudan |
2 300 |
70 |
|
Gabon |
5 000 |
50 |
|
Ghana |
791 |
46 |
|
Guatemala |
1 040 |
39 |
|
Belgian Congo |
2 200 |
36 |
|
Viet-Nam, South |
1 000 |
27 |
|
Brazil |
10 000 |
25 |
|
Japan |
1 418 |
11 |
One of the objectives of national inventories of forest resources is to determine the area of forests which are likely to be sources of industrial raw materials. The forest resource base thus includes not only the forests-in-use and accessible productive forests but also the productive forests that are still inaccessible. Information about the more remote forests, mostly inaccessible, are seldom compiled where forest inventories are at the beginning stages. Many countries are, however, assembling this information through inventories, extensive reconnaissance or other means. The replies from 47 countries as to the productive and unproductive area of their inaccessible forests are summarized by regions in Table 24.
TABLE 24. - INACCESSIBLE PRODUCTIVE FORESTS
|
Region |
Number of countries |
Total |
Productive |
|
|
1,000 hectares |
% |
|||
|
Europe |
3 |
391 |
1 255 |
65 |
|
Central America |
7 |
6 657 |
4 900 |
74 |
|
South America |
3 |
35 215 |
21 160 |
60 |
|
Africa |
17 |
120 923 |
78 718 |
65 |
|
Asia |
15 |
50 167 |
32 189 |
64 |
|
Pacific Area |
2 |
778 |
546 |
70 |
It is extremely encouraging to find that no less than 48 countries are able, no doubt on the basis of somewhat sketchy indications in some instances, to make a provisional assessment of the quality of the vast forest areas still beyond physical reach of exploitation. Many conflicting views have been expressed about the ultimate potential of these forests, how valuable they would prove to be when finally penetrated. The data presented in Table 24 show that the forest authorities concerned reckon that a substantial proportion, ranging from three fifths to threequarters, consists of productive forest, forest capable of producing usable crops of wood or other forest products.
The reported data are insufficient to allow of an estimate of regional totals; indeed, it is not known whether the situation in the reporting countries is representative of the general situation in the respective regions. But even the partial figures are striking. The 21 million hectares of inaccessible forest considered productive by the only 3 South American countries reporting, for example, represent an area equivalent to 28 percent of all forests in that region presently under exploitation. In Africa, the 79 million hectares of inaccessible forest reported as productive equals about two thirds of the area of forest presently in use throughout the region.
The report on the 1953 World Forest Inventory made it clear that the world's forests are theoretically capable of furnishing a plentiful flow of products for a world population much higher than that of today. This is confirmed by the new inventory, and in general the latest data suggest that some of the untapped resources of the world are perhaps richer than was at one time supposed. Furthermore, new national inventories have revealed a much higher volume of timber in North America and the U.S.S.R., and a somewhat higher volume in Europe, than earlier figures had suggested.
Of 4,405 million hectares of forested area, only 33 percent are being exploited 2,940 million hectares have not yet been brought into use, and of this area no less than 1,268 million hectares are presently deemed within physical reach of exploitation. The vast area of forest still lying beyond reach of exploitation includes substantial areas which are likely to remain unexploited within the foreseeable future, either because of their quality or their location. Even so, some 50 countries are able to report that well over half of their forests still inaccessible are considered productive in the sense that their composition is such as to warrant the hope that some day, if the need arises, they can economically furnish a flow of forest products. The forests are not, of course, evenly distributed over the earth's surface, and the apparent timber wealth in global terms must not be allowed to obscure the fact that some regions are very rich, others exceedingly poor, in forest, in relation to the populations they have to serve - whether that service is rendered primarily through the timber crop or whether it pertains to the ever-important, and often crucial, protective role of the forest. The inventory contains some indications of the area of land being lost to forest, sometimes through settlement for permanent agriculture, often as a result of the ravages of shifting cultivations. This last is a disturbing feature, not merely for the forest wealth so destroyed, nor even for the disastrous consequences that may ensue for the soil and water regime, but also for its social aspects. Countries in an early stage of development, intent on raising living standards - in both their cultural and material aspects - can ill afford to leave whole sections of their communities living in the neolithic stage. Obviously much more needs to be known about the extent, nature and impact of shifting cultivation. In a world on the move it is idle to claim that under certain forest and soil conditions this is the form of agriculture best adapted to the local environment. For while this judgment may be valid under special circumstances, it is a judgment based on purely technical considerations and one, which fails to take into account human values and the need for human progress.
Such indications as are presented in this inventory concerning areas lost to forest, including shifting cultivation, make it clear that this whittling away of the forest area is not confined to those regions which are relatively well-endowed with forest.
On the other hand, the data assembled on afforestation do suggest that the last five years have witnessed the most energetic effort in history to extend the area of forest in those countries where forest cover is deemed inadequate for the forest effectively to play its productive and protective role. There is evidence, too, that many more countries are seriously considering what the future forest requirements of their populations are likely to be, and there is a gratifying increase in the areas of forest land which are being designated as permanent forest.
It is still the coniferous forests of the world, with their relative homogeneity, accessibility, and usable properties, which are being turned most effectively to account. The three regions of the northern hemisphere, Europe, the U.S.S.R. and North America, with 29 percent of the world's population and 46 percent of the world's forests, account for two thirds of all forests so far brought under exploitation and two thirds of all removals.
Five years ago it was estimated that gross increment in the coniferous forests-in-use was just about in balance with drain (fellings, losses from fire, insects, fungi, shifting cultivation, etc.). The additional resources revealed by this inventory, and to some extent the bringing of new areas in exploitation, suggest that the drain, at around 1,000 million cubic meters with bark, is still considerably less than growth, estimated at 1,400 million cubic meters. In the 709 million hectares of exploited broadleaved forest, gross increment may be reckoned at approximately 1,370 million cubic meters with bark, of which fellings and losses annually drain off perhaps 1,200 million. The very magnitude of natural losses and losses during logging and transportation in some regions show how much has yet to be achieved in forest protection and harvesting methods.
Considerable strides have been made in forest management during the quinquennium, though it is to be feared that some of the figures reported are somewhat overoptimistic and part of the progress reflected by the statistics illusory. There is internal evidence to show that the considerable extension of the area under working plans, for example, in many cases expresses a hope, and an intention rather than a realization, in the sense that although working plans may have been prepared and filed, they are not always rigorously adhered to in the forest. There is little to show that cutting practices have substantially improved, taking the world as a whole, though here again the statistics may conceal a disposition on the part of many forest authorities to bring higher standards to bear in their judgment.
But with all the deficiencies in the information here assembled - and no attempt has been made to hide the fact that serious gaps exist, that data are seldom comparable from country to country and not always consistent over time -three facts still remain. First, the present inventory does present a more comprehensive picture of the world's forest resources than either of its predecessors. Secondly, there has been encouraging progress in the coverage and standard of forest statistics over the last five years. Thirdly, very much remains to be done in most countries before national forest statistics can be regarded as adequate either for the formulation of long-term forest policies or for the sound planning of forest industries.
![]()
![]()
![]()
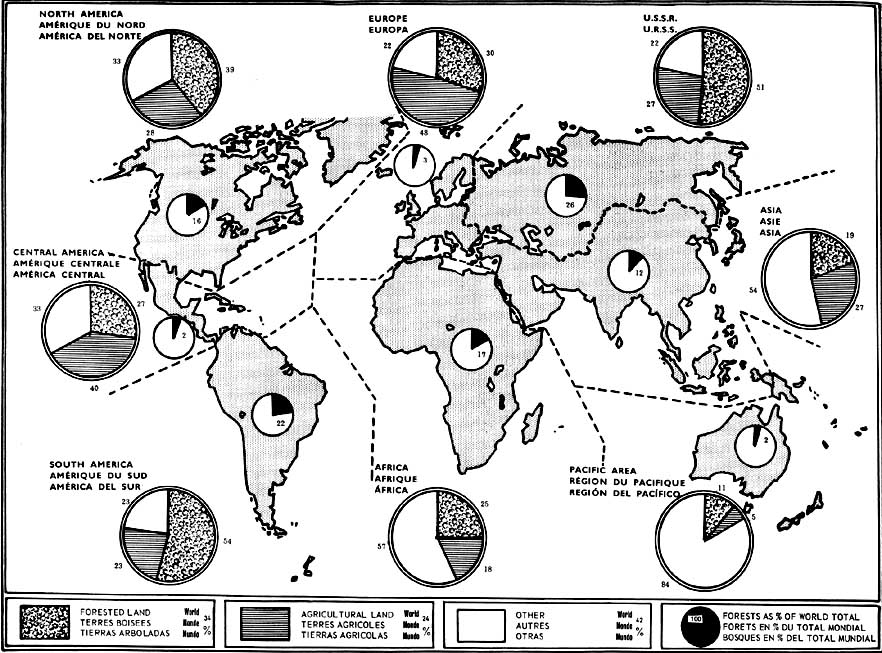
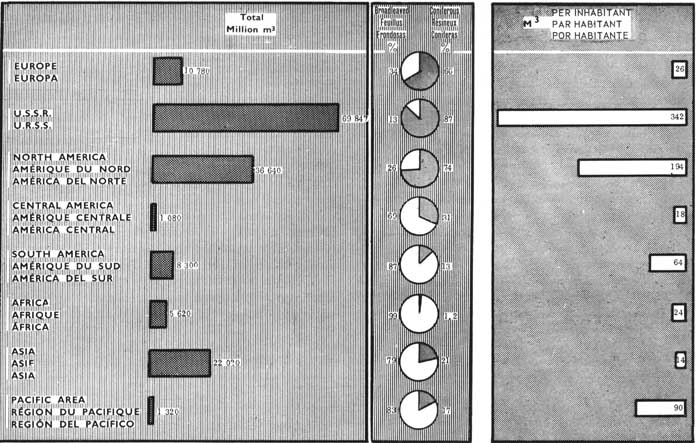