![]()
![]()
![]()
F. LOETSCH
FAO Technical Assistance Officer
Application of Mean Tree Tariffs 1
1See also Unasylva, Volume 11, Number 4 "A forest inventory in Thailand" by the same author, who is Chief of the Forest Research Institute for Inventory and Management, Reinbek, Germany.
IN THE tropics over the last decade extensive areas have been planted with fast-growing species such as Pinus spp., Albizzia spp., Acacia decurrens, Eucalyptus spp., and this trend is likely to gain in importance in the future. The simplification of the management of such stands with short rotations (8 to 30 years) is a problem awaiting solution.
These forests can be perpetuated either by artificial planting or - as with mangrove or bamboo forests -by natural regeneration. The simplest way of ensuring sustained yields is the well-known age-class method, with area and age-class plus possibly site-class as the only regulatory factors. If the forests are regularly treated and thinned and therefore more or less evenaged and uniform in structure and volume, this method is quite satisfactory.
But for various reasons, the structure of the plantations is often far from the normal (no thinning at all up to the mature age or overthinning by serious illicit cutting, are the extreme situations). It is obvious that yield regulation by area for such forests will result in unequal annual cuts which -will completely upset the production schedules of the industries dependent on them. For the most part the forests are being established to supply pulp and paper mills, as in Indonesia, for which a regular sustained supply of raw material is essential.
In Indonesia, the foresters based their estimations of the volume to be expected from mature plantations on the fairly reliable yield tables which were fortunately available for some of the fast-growing species. The deviations from normality (degree of stocking) were either judged ocularly or measured by sample plots. A reliable visual assessment of the degree of stocking needs a high standard of skill. According to the author's experience in Saxony, it is easier to estimate directly the standing volume per area unit than the degree of stocking in relation to a yield table, because the deviation from normality is produced by a number of factors. Also the number of sample plots necessary for obtaining a reliable estimate of the degree of stocking is almost the same as for a direct estimate of volume without the use of yield tables. Another point of even greater importance: the site-class necessary for using the yield table has to be obtained from age and top heigh.2 Height measurements are time consuming and, especially in mountainous areas like those of Java, are often a source of serious error.
2 Either the average height of the 100 largest girthed trees per hectare or the average height of dominants.
All these considerations led the author to the conclusion that a simple method for making volume estimates must be found which needs neither height measurements nor the use of a yield table and is based upon only two elements: diameter at breast height (d.b.h.) and number of trees per unit area. The most suitable seemed to be the "mean tree tariff" method.
Krenn, who first developed such mean tree tariffs, in 1948 pointed out the following facts in his booklet Tarife zur Mamenberechnung von Beständen (Tariffs for the computation of the total volume of stands). First, in regard to European species, the curves drawn for age-classes and for site-classes respectively, giving "diameter over volume" and "diameter over height" diverge in the form of a curved wedge with increasing diameters; secondly, for application in practice, this extent of variation can be taken into account by computing a middle tariff (M) and two other tariffs, an upper and lower one, each differing by 12 percent from the middle tariff for a given girth. Which of the three tariffs should be used for the specific selected mean tree of a stand must generally be decided by visual assessment of the average height range.
Krenn was thus able to dispense with exact height measurements and the drawing of height curves in connection with European species and rotation periods of 80 years and more. But he had to make allowance for substantial differences in the height of mean trees of equal average diameter by the introduction of his upper and lower tariffs.
The computation of volume with the help of the tariff is effected by the simple formula Vha = Nha·V-Dg, or expressed in words: the volume of timber of a stand per hectare (Vha) is found as the product of the number of trees per hectare (Nha) and the tariff volume of the basal area mean tree (V-Dg).
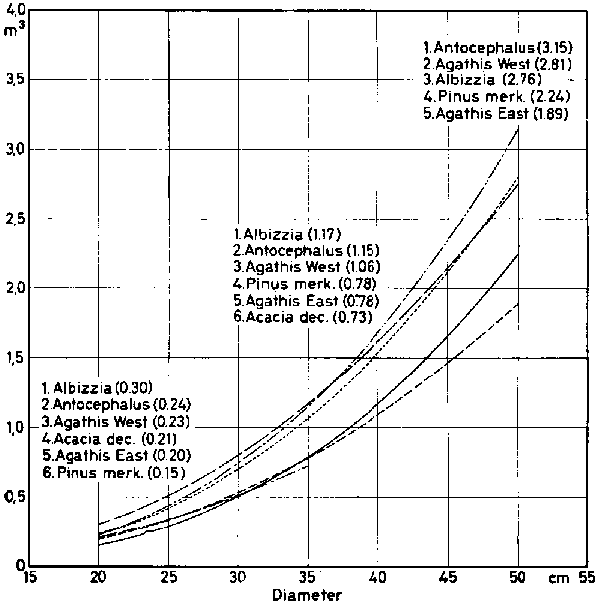
This simple formula makes the measurement of heights unnecessary. It assumes that irrespective of age-or site-class, a certain average height and consequently a certain volume is strictly related to a given diameter of the basal area mean tree. This assumption, however, only applies to European species within a limit of variation of plus or minus 12 percent. For tropical fast-growing species such as Pinus merkusii, Agathis loranthifolia, Acacia decurrens, and Antocephalus cadamba, for which yield tables have so far been computed, it was found that the curves "diameter over height" only diverge a little with the age- and site-classes. The first evaluation resulting from the use of a yield table made it clear that a single tariff for the total volume of timber, without introducing variations of ± 12 percent, was sufficient.
Furthermore it was proved that the relation "diameter of the basal area mean tree" (D) to "volume" (V) clearly followed the exponential function V = a·Db, where a and b are constants. When transferred into logarithmic form, the equation could be expressed as log V = log a + b log D.
This transformation simplifies the method of computing a tariff quite considerably. With the aid of the least squares method, the corresponding optimum straight line was found for each timber species on the double logarithmic paper through computation of the two coefficients of regression, log a and b. More details about the theoretical background of the mean tree tariffs are given in FAO/ETAP Report No. 1281, Application of mean tree Wigs for the further development of forest management of the plantation forests (Indonesia).
The computation of sound mean tree tariffs must be based on a considerable amount of research. Indonesia is in the favorable situation that for 20 to 30 years the Forest Research Institute at Bogor has had under observation hundreds of permanent sample plots. Thousands of felled trees have been measured and cubed in two-meter sections. Yield and volume tables for various species have been prepared.
From this material the writer was to compute mean tree tariffs for the most important species, the coefficients of regression for which are as follows:
|
Species |
log a |
log b |
|
Pinus merkusii |
- 4.65698 |
+ 2.94761 |
|
Agathis loranthifolia (West Java) |
- 4.18010 |
+ 2.72423 |
|
Agathis loranthifolia (East Java) |
- 3.93669 |
+ 2.47980 |
|
Acacia decurrens |
- 3.495W |
+ 2.21496 |
|
Albizzia falcata |
- 3.65761 |
+ 2.41198 |
|
Antocephalus cadamba |
- 4.31180 |
+ 2.83100 |
The tariff curves "volume over diameter of the basal area mean tree" are shown in Figure 1. The tariffs give solid wood under bark down to 7-centimeter minimum diameter without branches. For practical use tariff tables have to be prepared which give the volume down to 3 decimal places for each millimeter of the diameter, as an example shows:
FIGURE 1. - Mean tree tariffs of various last-growing species of Indonesia.
Pinus merkusii
|
D/V |
0 |
1 |
2 |
3 |
4 |
5 |
6 |
7 |
8 |
9 |
|
31 |
0.548 |
0.543 |
0.559 |
0.564 |
0 569 |
0 575 |
0 580 |
0.586 |
0.59 |
0.597 |
|
32 |
0.602 |
0.608 |
0.613 |
0.619 |
0.626 |
0.630 |
0:636 |
0.642 |
0.648 |
0.653 |
Before a tariff can be handed over to a forest administration, a thorough check on its usefulness has to be made. The FAO report already cited dealt to a large extent with the results of such tests in Indonesia which satisfactorily confirmed the theoretical assumptions for Pinus merkusii, Agathis loranthifolia West and East and Acacia decurrens, whereas the tariffs for Albizzia falcata, and Antocephalus cadamba are still of a preliminary character.
Implements for direct reading of basal area
The total volume of a unit area is computed by the mean tree method without dividing the trees into diameter classes. For most fast-growing species this total volume estimate is sufficient as the greatest part of the timber is destined for pulp and paper mills.
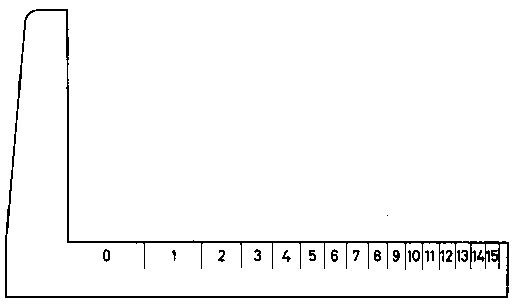
For finding the basal area mean tree of a stand it is more convenient to note down on the tally sheet the two-dimensional basal area instead of the one-dimensional diameter or circumference as is customary. One of the handiest implements for direct reading of basal area is the Visiernwsswinkel designed by Bitterlich. This tool uses the so-called Wanner weights as a scale. The Warmer weight class 1 means 1140 square meter or 0.025 square meter, class 2 correspondingly 2/40 or 0.05 square meter, etc. Multiplying the basal area of a tree, as fractions of square meters, by factor 40, Warmer attains a grouping into classes of equal basal areas indicated by round figures 1, 2, 3, etc., each of a sphere of 0.025 square meter. (This means that the basal area scale is calibrated in units of 0.025 square meter so that class 1 corresponds to a basal area of 0.025 square meter, class 2 to a basal area of 0.05 square meter and so on.)
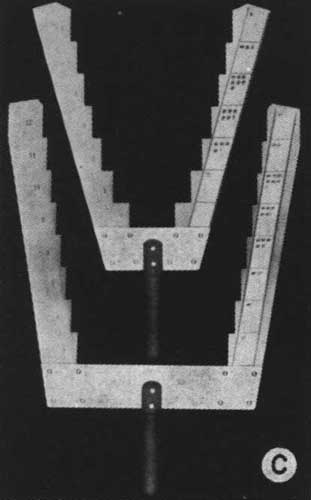
The principles of the Warmer weight's division into classes has proved its worth in regard to a range of diameters between 30 and 80 centimeters. For some tropical species like Acacia decurrens or mangroves the basal area mean tree usually lies between 15 and 30 centimeters d.b.h. It was necessary, therefore, to develop an additional implement for these species with smaller diameters. The Kreisflächenstufenkluppe designed by the writer (Figure 2 c) uses the multiplication factor of 160 instead of 40. The range of diameters from 6.3 to 30 centimeters d.b.h. is divided into 12 equal intervals of 0.00625 square meter. The mathematical background for the construction of this implement is given in FAO report No. 1281.
A practical advantage of this tool lies in the possibility of fastening the tally sheet to the side of the implement, thus saving a second man for recording.
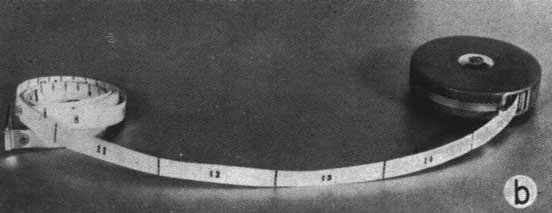
Another easy way for direct reading of Warmer weight classes is to use a tape measuring with a Warmer weight scale (Figure 2 b). This tape is to be recommended especially for forests with trees of bigger diameters, because the reading with the Visiermesswinkel of diameters over 80 centimeters d.b.h. is inconvenient.
Field practices
In using the mean tree method in the case of a smaller stand to control felling losses or for fixing stumpage rates, it is advisable that all trees should be measured. But full enumeration is too costly and also unnecessary for the purpose of drawing up working plans. Careful sampling will suffice. As the result of his work in forests in Europe as well as in southeast Asia, the author has found again and again that the small circular sample plot of 0.05 to 0.01 hectare, spread as systematically as possible, gives the most certain results while costing the least.
It may be taken as a rule that errors of up to 15 percent may be tolerated in individual plantations but that an estimate within about ± 5 percent for the total of all stands due to be cut over during the next management period is necessary to enable forest officers to decide on the total annual cut.
The author carried out statistical calculations with respect to stands of Pinus merkusii as well as Agathis loranthifolia to discover the necessary number of sample plots for both of the cases mentioned above. The broad result of this investigation, the details of which are given in FAO Report No. 1281, are as follows.
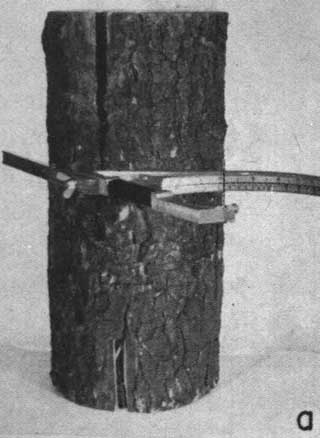
FIGURE 2: (a) "Bitterlich Tarilmmewinkel" with Wanner weight classification.
FIGURE 2: (b) Tape with Wanner weight classification.
Because of the larger number of stems per hectare, statistical conditions are more favorable for Agathis loranthifolia than for Pinus merkusii. With 50 sample plots of 0.02 hectare in Agathis stands, the t·SV margin of ± 15 percent will generally not be exceeded, whereas in Pinus merkusii stands 100 sample plots are necessary to achieve the same accuracy. To obtain results for the total of mature stands of a forest district 500 sample plots are sufficient.
Assuming a minimum size of about 50 hectares for the individual assessment unit (= stand or group of even-aged stands), Agathis loranthifolia would be best served by one sample plot for every hectare (2 percent cruise) and Pinus merkusii by two sample plots per hectare (4 percent cruise).
In mountainous country the process of walking from one sample plot to the next takes up most of the working time. An absolutely systematic distribution of sample plots would require a lot of time to be spent in walking but would also ensure the best statistical efficiency. A compromise therefore seems necessary to meet practical and statistical requirements. Accordingly, the author has proposed for Agathis loranthifolia a completely systematic distribution of sample plots at a distance of 100 meters by 100 meters, while for Pinus merkusii the distance between two adjacent cruise lines should be 100 meters, with only 50 meters between two sample plots.
Serviceable forest maps to the scale 1:10,000 are available for most parts of Indonesia. To ensure random distribution of the sample plots, the basic line is decided by chance and not by deliberate choice (e.g., a ruler is dropped on the map). The entire system of the projected sample plots is drawn along this base line on a sheet of the forest map. The sample plots must be numbered afresh for every assessment unit.
An inventory crew consists of a team leader (he can be a forest guard but must be able to handle a compass and to make reliable entries on a printed form), one man working with Visiermesswinkel and tape for ascertaining the radius of the plot at the same time, and, according to the terrain, one or two men to clear a path or help generally. The team leader, by means of the forest map prepared with the linear sampling system, first looks for the points of entry of the lines into the forest. There are frequently boundary stones, or measured paths and roads. The bearing has been laid down previously. The inventory then proceeds by routine the centers of the circular sample plots being found with the help of a compass and a tape for measuring distances.
The avoidance of any subjective choice is more important than extreme accuracy in the location of plot centers. In Indonesia a general principle is that the area of deeply cut river valleys (mostly stocked with bamboo) are not recorded if they are smaller than 4 hectares. If such areas occur in a plantation, the team leader should ascertain the number of sample plots falling in these valleys and declare them as zero plots. If he fails to do this, errors will result and the volume figure will be much too high.
After the center for a circular sample plot has been determined, the next step is to count the trees within the plot and to determine their basal areas using the Wanner weights. (Tally sheet follows.)
No time-consuming height measurements have to be made. The plot (radius: 7.98 meters) is measured by tape only in really doubtful cases; these generally occur at a distance of between 6.5 and 9.5 meters from the center of the circular area. Experienced teams usually only need to take one radius measurement within a plot circle. If a tree stands exactly on the plot boundary it is included in the sample plot if the accurate distance from the center of the circular sample plot to the heart of the tree is 7.98 meters or less. It is important on slopes that the tape should be held horizontally. Borderline cases necessitating a radius measurement correct to the nearest centimeter are rare. Experience has shown that the performance per team for the system of distribution "one sample plot per hectare" is 20 to 25 circular sample are-as per day, and 30 circular sample plots per day in the case of the "two sample plots per hectare" system.
Where two or three teams are operating, they should work under a university-trained forester. His duty is the entire planning of sample plots, drawing of maps, controlling of the work (daily visits to the teams in the forest) and descriptions of the stands. In the case of Pinus and Agathis, only those stands more than 15 years old need to be inventoried, younger ones merely requiring a few supplementary measurements in addition to visual assessment. The method leads to statistically sound results for estimating the volume of the growing stock, and this can be accomplished in a very short time if organization is good.
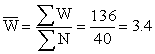
The arithmetical evaluation is very simple: as the example attached shows, for each assessment unit the mean Wanner weight W is found by adding the measured Wanner weight figures and dividing the sum by the number of measured trees

|
Forest district: |
Lembang |
|
Compartment: |
25A |
|
Species: |
Pinus merkusii |
|
Date 27.8.1958 |
|
|
Size of circle sample plot: |
0.02 ha. |
|
Crew leader: |
N.N. |
|
Checker: |
N.N. |
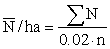

The number of steins per hectare (N/ha.) is obtained by help of the simple formula

if 0.02 is the size of the sample plot.
As already mentioned the calculation of the volume per hectare which it is desired to know, follows the formula
Vh = Nha · VDg
To enter the tariff it is therefore necessary to tranfer the  into Dg.
A conversion table has been constructed for this purpose:
|
Dg |
W |
0 |
1 |
2 |
3 |
4 |
5 |
6 |
7 |
8 |
9 |
|
31 |
3.02 |
3.04 |
3.06 |
3.08 |
3.10 |
3.12 |
3.14 |
3.16 |
3.18 |
3.20 | |
|
32 |
3.22 |
3.24 |
3.26 |
3.28 |
3.30 |
3.32 |
3.34 |
3.36 |
3.38 |
3.40 | |
The entry 3.04 means that for a diameter of 31.1 centimeters the Warmer weight is 3.04 (or rather that a Warmer weight of 3.04 corresponds to a diameter of 31.1 centimeters). From the example given on the tally sheet, W = 3.40 the diameter of the basal area mean tree reads 32.9 centimeters. With this diameter the volume vii, reads 0.653 cubic meter. Hence:
Vha. = 400 x 0.653 = 262 m3/ha.
An inventory with only five plots - given as example - has of course no practical value. To illustrate the growing stock of Pinus merkusii in Java some results of stands assessed are given in the following table (size of sample plot = 0.02 hectare):
|
No. |
Locality |
Age |
N/ha |
Dg. |
VDg |
V/ha=N·VDg |
|
|
Lembang |
1 |
30e |
10 |
584 |
23.4 |
0.239 |
139.6 |
|
2 |
30a |
17 |
268 |
33.4 |
0.683 |
193.0 |
|
|
3 |
30b |
18 |
229 |
33.4 |
0.683 |
156.4 |
|
|
4 |
30c |
21 |
196 |
36.7 |
0.902 |
176.8 |
|
|
5 |
30d |
22 |
150 |
37.3 |
0.946 |
141.9 |
|
|
|
2-5 Total |
17/22 |
206 |
35.3 |
0.804 |
165.6 |
|
|
Tjiremani |
6 |
IX |
19 |
372 |
28.3 |
0.419 |
155.8 |
|
7 |
VIII |
20 |
244 |
32.3 |
0.619 |
166.1 |
|
|
8 |
VIII |
21 |
218 |
33.7 |
0.701 |
152.8 |
|
|
9 |
V, VI |
22 |
243 |
36.3 |
0.873 |
212.1 |
|
|
10 |
I/VI |
23 |
233 |
34.3 |
0.739 |
173.2 |
|
|
11 |
XVI, XVIIII, XX |
? |
266 |
34.1 |
0.726 |
193.1 |
|
|
|
6-11 Total |
19-23 |
281 |
31.9 |
0.597 |
167.7 |
|
Mean tree tariffs for bark weights of Acacia decurrens
Acacia decurrens is managed with a rotation of 6 to 8 years in order to extract tannin from its bark. The debarked wood is sold as fuelwood and can only be regarded as a by-product. The author has attempted to amalgamate the existing correlation between the yield of bark per tree and d.b.h. into a tariff for the bark according to the mean tree method. A tariff was also computed for the fuelwood yield.3
3 W. v. Wülffing's yield table (Meddingen van het Boshouwproofstation, No. 28, 1945) could be drawn upon as a source of information. Hellinga's table (1939 Tectona, Part XXXII) was consulted for comparison. Hellinga, delivered a lecture at Bogor on 3 May 1952, Boshouw en Voodsolproductie, in which he discussed in detail the subject of Acacia decurrens; use has been made of this lecture by the author of this article.
From the three site classes of the yield table the values "mid-diameter over mean weight of bark (wet) for a tree" were extracted. The result on double logarithmic paper was that within the range of diameters from 14 to 35 centimeters the values were very well covered by a straight line. The computed equation was:
log y = 1.8409 + 2.6591 log x where
y = weight of bark per tree
x = diameter of the mean tree
From this equation the tariff was calculated, an example of which is given as follows:
ACACIA DECURRENS WEIGHT OF GREEN BARK PER TREE IN KILOGRAMS
|
D in cm |
0 |
1 |
2 |
3 |
4 |
5 |
6 |
7 |
8 |
9 |
|
17 |
31.4 |
31.91 |
32.4 |
32.81 |
33.3 |
33.8 |
34.3 |
34.8 |
35.3 |
35.8 |
|
18 |
31.4 |
31.91 |
32.4 |
32.81 |
33.3 |
33.8 |
34.3 |
34.8 |
35.3 |
35.8 |
|
19 |
31.4 |
31.91 |
32.4 |
32.81 |
33.3 |
33.8 |
34.3 |
34.8 |
35.3 |
35.8 |
This tariff was carefully checked and it proved suitable for wattle from west Java only, whereas for wattle from east Java the wet weight of bark found by tariff must be reduced by 20 percent. The reason for this discrepancy is that the bark of east Java wattle is thinner. Whether this is due to climate and soil factors or to various subspecies could not be exactly ascertained. The yield tables are based mostly on the older experimental plots of west Java. This study on Indonesian wattle shows that tariffs for bark weight are valid only for limited regions.
The practical value of the mean tree tariff lies in the possibility which it gives for selling on the stump and thus avoiding the weighing of the removed bark with all its drawbacks (time-consuming and losses due to drying if the weighing cannot be done immediately after peeling).
An instrument for ascertaining the basal area mean tree, Kreisflächenstufenkluppe, was constructed (Figure 2 c). The transforming of the quarter Warmer weight into diameter needs a conversion table different from that for the regular Wanner weight. Detailed information is given in FAO/ETA-P Report No. 1281.
Tariff for bamboo inventory
The yield of bamboo is expressed as weight. The planology brigade of east Java (Malang) in 1955 investigated the measured weights for the most important species, Gigantochloa apus, on a sample strip 20 meters broad with a total area of 13.5 hectares. For every culm weighed, the d.b.h. in centimeters was also recorded.
The author has carried out examinations in the light of this information. Classified according to the three local names for bamboo, Apus, Batu and Ulet, diameter groups of 0.5 centimeter were formed, beginning with 3.5 centimeters and ending with 11 centimeters d.b.h. For each group the mean diameter in millimeters and the mean weight of the diameter group in 0.2 kilogram were computed.
These values, inscribed on normal millimeter paper, resulted in parabolic curves. Instead of the diameter, the corresponding value for the basal area (r2p) was now used in the abscissa. The resulting dots clearly followed a straight line, and significant differences between the local subspecies could not be discovered. With the aid of the method of the least squares, the best fitting straight line was computed for the prepared material. The following relation resulted:
y = 1.71297 + 5001.71428 X x where
y = the weight in kilograms
x = the basal area in square meters.
The tariff for the mean weights was computed for Indonesian Gigantochloa according to this formula, using the d.b.h. as initial value.
Because of the high number of culms per hectare (between 2,000 and 7,000) and their growing in dense clumps of various sizes (between 5 and 300 culms) a special design of subsampling had to be selected, a detailed description of which would exceed the scope of this paper and readers are referred to the FAO report already mentioned.
FIGURE 3. - Toot for measuring diameters of bamboo culms using 1/20 Wanner weights as classification.
But it should be pointed out that the author recommended a special and simple implement for direct reading of basal area of the culms based upon 1/20 Wanner weight (see Figure 3).
Conclusion
Developing countries in the tropics need simple but statistically sound methods for forest inventories. For forest plantations with short rotation the mean tree tariff method seems to be promising. For species with a long rotation period (i.e., teak) this method can also be used and even extended to include an assessment of timber quality classes as well as of total volume.
The results achieved in Indonesia appear to be sufficiently significant to justify a broader discussion upon the method itself; because the author believes that with suitable modifications it could also be helpful for other tropical countries.
![]()
![]()
![]()