![]()
![]()
![]()
D. HEINSDIJK
FAO Technical Assistance Officer
The Brazilian Constitution lays down that 3 percent of the annual national income shall be made available for the development of the Amazon basin. The government agency which administers and supervises this development is the Superintendéncia de Plano de Valorização Economica da Amazoaia (SPVEA), with headquarters in Belém de Pard. Early in 1954, an FAO forestry mission started work in the Amazon valley in co-operation with SPVEA. The program of the Mission was based on FAO Report No. 171 to the Government of Brazil on forest development in the Amazon valley, published in 1953. This report recommended the initiation of a forest inventory in selected areas, a recommendation which was accepted by the Brazilian Government and incorporated into the program of SPVEA. The surveys of all the areas initially selected will be completed in 1961.1
1 D. Heinsdijk was assisted in these surveys by B. B. Glerum and G. Smit, who were appointed as assistant experts under an agreement between FAO and the Government of the Netherlands.
Reporting on a recent inspection tour to the Amazon area, the Deputy Director of the Forestry and Forest Products Division of FAO wrote: "As regards the forest reconnaissance survey, a large area south of the Amazon has been covered - the ground survey work involving some very tough expeditions into unexplored jungle far from the main Amazon river. As a result of this reconnaissance, there now exists a fair picture of what this enormous stretch of forest consists of, providing sufficient information to select areas which, by reason of their stocking or their relative accessibility, could, if funds permit, lead to exploitation and industrial development. For instance, three large areas have been provisionally selected as forest reserves suitable for exploitation; one on the Amazon itself, the second one on the Brasilia road to be developed in conjunction with a colonization project, and the third an area some distance West of the Brasilia road containing rich stands of mahogany. One of the important results of the reconnaissance survey has been the locating of hitherto unsuspected valuable mahogany forests lying to the south of the Amazon which form one of the great natural resources of Brazil. I found my Visit to the Amazon an inspiring one because there is there a fine example of what practical types of work can be undertaken by FAO through the means of technical assistance, and I came away convinced that this work should go on and be developed to the maximum Possible extent."
THE FORESTS of the Amazon valley cover an area of approximately 400 million hectares. The only possibility of undertaking a forest survey for an area of these dimensions is through the use of aerial photographs.
The only aerial photographs available for the Amazon valley are trimetrogon photographs taken by United States airmen during the second world war. Trimetrogon aerial photographs are mostly taken for reconnaissance purposes. Three cameras are used; one in the middle for vertical photographs and one on each side for oblique pictures. The three photographs, taken simultaneously, cover a surface area stretching from horizon to horizon at right angles to the directions in which the survey airplane is moving.
With such aerial photographs at hand, the best way to organize and execute a forest inventory is by means of an exploratory or reconnaissance survey (Figure 1). In the case of the Amazon the need was the more pressing since very little or no reliable data concerning the composition of the forests existed.
It was decided that a start would be made with the forests of the central part of the Amazon valley located close to the Amazon river (Figure 2) and its larger tributaries, which are navigable for seagoing vessels. This central part is estimated to extend over an area of approximately 100 million hectares. The aim of the survey was to obtain:
(a) basic data about the composition of these forests;(b) a clear picture of the possibilities of penetrating the forests by way of the smaller rivers and/or by land;
(c) recommendations as to valuable or promising forest areas where coverage and more detailed surveys were warranted.
Confronting the task of surveying such vast forest areas and lacking information as to their composition, the first problem to be solved was where to start the survey. Based on the economic data provided by FAO Report No. 171 the forest area south and southeast of Santarém (halfway between Belém and Manaus along the Amazon river) was chosen. It later emerged that one of the most promising forest areas of the Amazon river was actually surveyed first; a fact which has emphasized the need for a preinvestment economic survey as a basis for planning a forest inventory program.
The survey was made in blocks, the blocks being given limits which are easily recognizable, mostly large rivers with familiar names. At present five blocks have been completed, of which four were surveyed under the direct supervision of the writer and one by B. B. Glerum. The five blocks cover an area of approximately 16,700,000 hectares. The following was the working method.
1. Planimetric base maps were made from the aerial photographs.
2. Forest samples were taken in the field.
3. The reports were prepared.
FIGURE 3. - A draughtsman marking topographical features on oblique photographs.
Mapping
It is not common practice and is also somewhat difficult to make detailed forest maps from trimetrogon aerial photographs. In using the aerial photographs made of the Amazon basin, there was one advantage, that is, the country is practically flat, with maximal differences in height of 150 meters in the planalto or plateau region; this enabled the oblique picture to be used. In country with high and steep hills or in mountainous country the hills and the mountains show their sides on the oblique pictures and conceal all that lies behind. The disadvantages were three in number.
1. The photographs, especially the oblique parts, were mostly clouded or hazy.
2. In some cases the adjoining flight runs were too far apart.
3. In the Amazon valley there are no astronomical stations for ground control, or other geodetic marking points which can be used for mapping purposes.
Strips of maps to the original scale of 1:40,000 were made from the verticals of the trimetrogon flight runs, the strips fitted in as well as possible in between the astronomic station - or other geodetic marking points. These map strips were transferred to 15 minute square base maps; and on these base maps the tie-in points for the obliques of the adjoining (or crossing) flight runs were marked. Using a mirror stereoscope the details Been on the oblique photographs were traced in red pencil and transferred to the base maps with the help of an oblique sketchmaster. Based on observations made in the field, the necessary corrections were adjusted on these base maps and thereafter finished in colored ink (Figure 3).
In view of the limited accuracy of these maps, they were photographed on a scale 1:200,000, traced to that scale and joined block by block into one final map. These final maps do not pretend to have a high degree of accuracy, but they do present an excellent over-all picture of the country surveyed. Copies of these final maps have been included in various FAO reports (Nos. 601, 949 and 992) to the Government of Brazil.
From the verticals of the trimetrogon flight runs, apart from the usual topographical features of the country, such as roads, villages. rivers, etc., the borders of grass, scrub and forest vegetation growing on permanently or temporary waterlogged soil or on dry land, could easily be mapped. This was not always so easy along the borders of the oblique pictures (found around the center of the photograph) but, assisted by field observations, these areas could also be drawn with fair accuracy.
Up to now only the terra firma or dry land forests have been surveyed. Close to the mouth of the Tocantins river and near and on the isles of Marajó varzea or swamp forest was seen which may possibly be of value; its extent justifies a special survey. It has not yet been possible to start this survey. Every effort was made to divide the dry land forests to be surveyed into types by means of pure photo-interpretation to facilitate the sampling procedure. Without first visiting these forests it was easy to map the patches of secondary forest and the savanna or caatinga forests. The latter are low forests with only one tree story; the trees are very close together with small crowns, and are mostly less than 10 meters in diameter, growing more or less to one level. These forests can easily be discerned from the surrounding high forest by their smooth and level crown canopy, which appears as a whitish color on the aerial photographs. On the oblique parts their limits could also be traced without too much difficulty.
The composition of dry land forests surveyed up to the present may be described as very uniform. There are changes in composition but these are mostly gradual changes, never such abrupt changes as between hardwood and softwood forests in the temperate zone. The differences between two adjoining forest types were mostly caused by one or two tree species or were merely different in the abundance of certain species.
This uniformity can best he explained by an example. FAO Reports Nos. 969 and 992 each contain a field record of the enumeration of samples. These two sampling units were taken at random from the records on which the reports were based; they are located 1,200 kilometers apart, one near the Rio Madeira and one south of Belém. In the first sampling unit 60 species and 11 trees were enumerated, and in the second sampling unit, 42 species and 133 trees. The two sampling units had 22 species in common, comprising 53 trees of the first unit and 75 trees of the second unit: that is, more than half of the trees enumerated in these two sampling units belong to the same species. If all indications of place and time were lost from these records, the only possibility of relocating them would be by two tree species, i.e., pan amarelo for the sampling unit near Belém and momorana, or castanha do pacá for the sampling unit near the Rio Madeira, because pan amarelo was only enumerated near Belém and momorana or castanha do pacá, only near the Rio Madeira.
The crown canopies of these forests appear very uniform on the aerial photographs. With sufficient experience both high and low forests can be mapped from the photographs as also can those forests with high and low gross volume; the latter has to be done with the help of crown counts. Low patches in between high forest are not necessarily an indication of change in forest type; they are more often old windfall areas where the forest is growing again to fill the gaps. In practice, the only real forest type mapping from the aerial photographs could be done in planalto or plateau regions where the forest types followed more or less the topography of the country. The other forest type mapping was based on the samples taken in the field and their limits are all more or less roughly drawn.
Sampling units
The aim of an exploratory survey is to obtain information about the nature of the forests under investigation, particularly its variability both as a whole and within and between the various forest types found. To realize this aim in the Amazon valley, survey groups penetrated the area under survey as far as possible and took a sample from the terra firma or dry land forests; within the sample the sampling units covered the forest more or less systematically. The sampling units were taken along transects which were always projected perpendicular to the topography of the country, according to a prearranged plan. Owing to the quality of the aerial photographs and the lack of a good geodetic base for the maps, a transect sometimes coincided with a river or ran parallel with the topography of the country, since the planned direction of the transects could not be changed. However, these were rare exceptions; the transects were mostly well located, with errors in direction of only some degrees. The sampling units were practically all 1 hectare in size; all trees with a DBH (diameter at breast height) of 25 centimeters and more were enumerated 5 meters left and right from the center of the transect over a length of 1 kilometer (1,000 X 10 meters = 10,000 square meters or 1 hectare). The identification of the tree species was supervised and checked up by Dr. Ricardo Lemos Froes and personnel from the Botanical Department of the Instituto Agronomico do Norte in Belém do Pará.
The most difficult part of the survey was the organization of field trips. From the operational bases at Santarem or Belém, practically all transportation was by boat on the large rivers, with launches of 15 to 45 tons, additional transportation being by big canoes with outboard motors or with small canoes for the smaller rivers and creeks which are mostly impossible to navigate for larger vessels because of fallen trees.
A survey party spends the duration of the survey trip, from 30 to 40 days, on its own in the Amazon forests with, as a rule, very little or no communication with the outside world. The paragraphs below give an idea of such a field party, its members and their duties.
Personnel of the survey party
1. Staff
(a) Chief of the survey party, who is responsible for the proper execution of the sampling work. With the help of his assistants he enumerates most of the sampling units.(b) One or two assistants, being trained to take over the duties of chief of a survey party.
(c) Calculator, who makes the enumerations and calculations of the sampling units taken during the trip, so as to enable the chief to spot at once particular changes in composition of the forest surveyed. As more than 300 tree species, from which 100 are more or less commonly found, may be dealt with, careful study of the records is needed in order to analyze composition. The calculator is also trained in photo-interpretation and had to be able to enumerate a sampling unit.
(d) Botanist, who works in close co-operation with the tree namer from the enumeration party. He collects botanical material, which is dried and prepared for transportation in a special shelter in the main camp.
2. Two transects groups
The groups of laborers who cut the transects consisted of the following personnel:
(a) Foreman or "capitão," responsible for the transect cutting of his group (which is selected by himself). With the help of a Bézar compass he keeps his line cutters in the proper direction.(b) Two front cutters, who cut through the underbrush of the forest in front of the foreman, who controls the direction in which they proceed.
(c) Two chain men, who follow directly after the foreman and measure the length of the transect with a chain of 20 meters. After each chain a stick is placed in the ground and after every two chains, i.e., every 40 meters, a number put on the stick. As the scale of the vertical photographs and the base maps is 1:40,000, the number on the stick therefore represents the length of the transect in millimeters if put on the base maps. This is a simple way of recording topographical features of the country encountered along the transects.
(d) Six transect cleaners, who make a clear footpath in the center of the transect (all small stumps are cut and detours made only for very marshy places) with temporary bridges (with a handrail) for inundated forest areas, rivers or creeks. These paths can be walked at an average speed of 4 kilometers per hour. In an emergency a speed of 7 1/2 kilometers per hour was made.
3. Enumeration group
Apart from the survey chief, his assistants and the botanist, this group consists of:
(a) Tree namer, who is usually an older man who has spent his life in the forest, either as a forest worker or as a hunter. He identifies the tree species by cutting the bark. As a rule this is sufficient, otherwise the wood is out or fruits and leaves are sought. It is difficult to find a good tree namer, but the good ones, who have passed the botanist's examinations, seldom make a mistake as long as they work in their own region.(b) Tree namer's assistant, who carries a 5-meter bamboo pole and with it indicates the trees which belong to the sampling unit, 5 meters left and right from the center of the transect. There may be a few cases where the survey chief has to decide if a tree is in or out of the sampling unit, that is, in cases where it is a question of 10 centimeters more or 10 centimeters less; this usually occurs for less than one tree per sampling unit. When the tree namer has measured the circumference, his assistant puts the bamboo pole against the tree to facilitate the estimation of the height made by the surveyor.
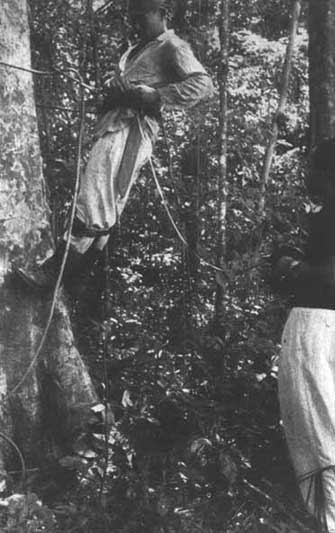
(c) Tree climber, who is a specialist trained in climbing trees with the help of climbing equipment (as used in climbing wooden telephone or light poles). On every sampling unit he climbs at least three trees and measures the length of the merchantable bole with a measuring tape in order to give the surveyor the opportunity to check his height estimates. At the same time, the circumference at the end and in the middle of the merchantable bole is measured; this data being used for the construction of volume tables. He also helps the botanist in collecting material from the standing trees (Figure 4).
(d) Botanist's assistant, who cuts down trees for the botanist and carries the material gathered.
4. Camp personnel
This section consists of the following persons:
(a) Cook, who is also in charge of the storeroom and material. With the calculator he is also responsible for the medical care of the party.(b) Cook's helper, who does most of the very simple cooking.
(c) Professional hunter, whose task is to provide the party with fresh meat. If he is unlucky or game is scarce, some of the cleaners of the transect groups assist him.
5. Transport group
This group is in charge of all transportation by water and looks after the boats and motors. It consists of the personnel of the launch, that is, the captain and his assistant, the engineer and his assistant, and a pilot. A pilot is needed practically everywhere since most of the traveling by launch is at night.
Size and method of travel of a survey party
The total personnel of a survey party is usually about 40 although, when soil surveyors or visitors are added, it can be even more. However, in order to have the work done on time and to keep the party moving smoothly, 40 people can be regarded as a maximum. Otherwise, bigger launches are needed, which have the disadvantage that they cannot enter the smaller rivers and in consequence handicap the mobility of the party. Only during travel by launch does the party live on board. On arrival at the approximate center of a group of planned transects a good campsite is selected and a camp is erected with open shelters by using heavy 5 X 5 meter tarpaulins. The time needed to reach the transect furthest away down or upstream from the camp may not take more than one hour by launch or canoe with or without an outboard motor. A camp usually consists of 10 to 12 tents, washing places, mess tables, kitchen, etc. Including campsite clearing, a camp can be set up in four to eight hours and broken up in one hour.
In the Amazon valley, field trips were made throughout the year. Especially during the rainy Beason, when the water in the smaller rivers and creeks is high, it was much easier to work than in the dry season since the forest could be penetrated better along the waterways. During the 1,149 travel days spent by the survey parties in sampling the five blocks, only five working days were lost through heavy rains.
Planning the sampling procedure
The planning of the sampling procedure for an exploratory survey has its particular difficulties. That the degree of variability of the forests surveyed is not known, cannot be regarded as a handicap or a difficulty since to measure this variability is one of the aims of this kind of survey. The real handicap in some cases may be that no forest type mapping can be done from the aerial photographs before going into the field, so the limits of the forest types inside the dry land forest formation to be surveyed are unknown.
The enumeration of a sampling unit starting directly from the point of entrance into an unknown forest type of this sample unit will be unbiased but, if a second is taken without a prearranged plan, it can be biased. Therefore, the location of the transects to be cut, along which transects the sampling units are to be taken, is planned and put on a provisional map or on aerial photographs. The standard length of the transects was usually 10 kilometers, from which the third, the sixth and the tenth kilometer were enumerated. In some occasions these transects were extended up to 27 kilometers with a subcamp in the middle, and sometimes they were only 6 kilometers long.
The sampling units were taken along these longer or shorter transects in the same sequence. This sequence is based on practical experience. An enumeration party can enumerate two sampling units of one hectare per day along a transect, if they have only to walk 12 kilometers (6 going and 6 coming back) and one sampling unit of one hectare per day if they have to walk 20 kilometers (10 going and 10 coming back). The transects were projected along the rivers and creeks navigable for launches or big canoes with outboard motors.
An attempt was made to get the same number of sampling units in the square of 15 minutes represented by the base maps, but this proved very difficult. In the planalto or plateau region the smaller rivers were very difficult to enter and on top of the plateau there was no water, so it was almost impossible to make subcamps. South of Belém it often happened that the virgin dry land forest was found to have been cut away because the trimetrogon photographs dated from 1942-1944 and since then the population around Belém had increased substantially. On two occasion Indians would not permit the survey parties to enter the forests.
In view of the uniformity of these forests and the experience gathered during the survey of the first block, that is, of the Rio Tapajóz-Rio Xingu region, fewer samples were taken in the other blocks. In the first block approximately 0.03 percent of the dry land forests was enumerated; in the others approximately 0.006 percent.
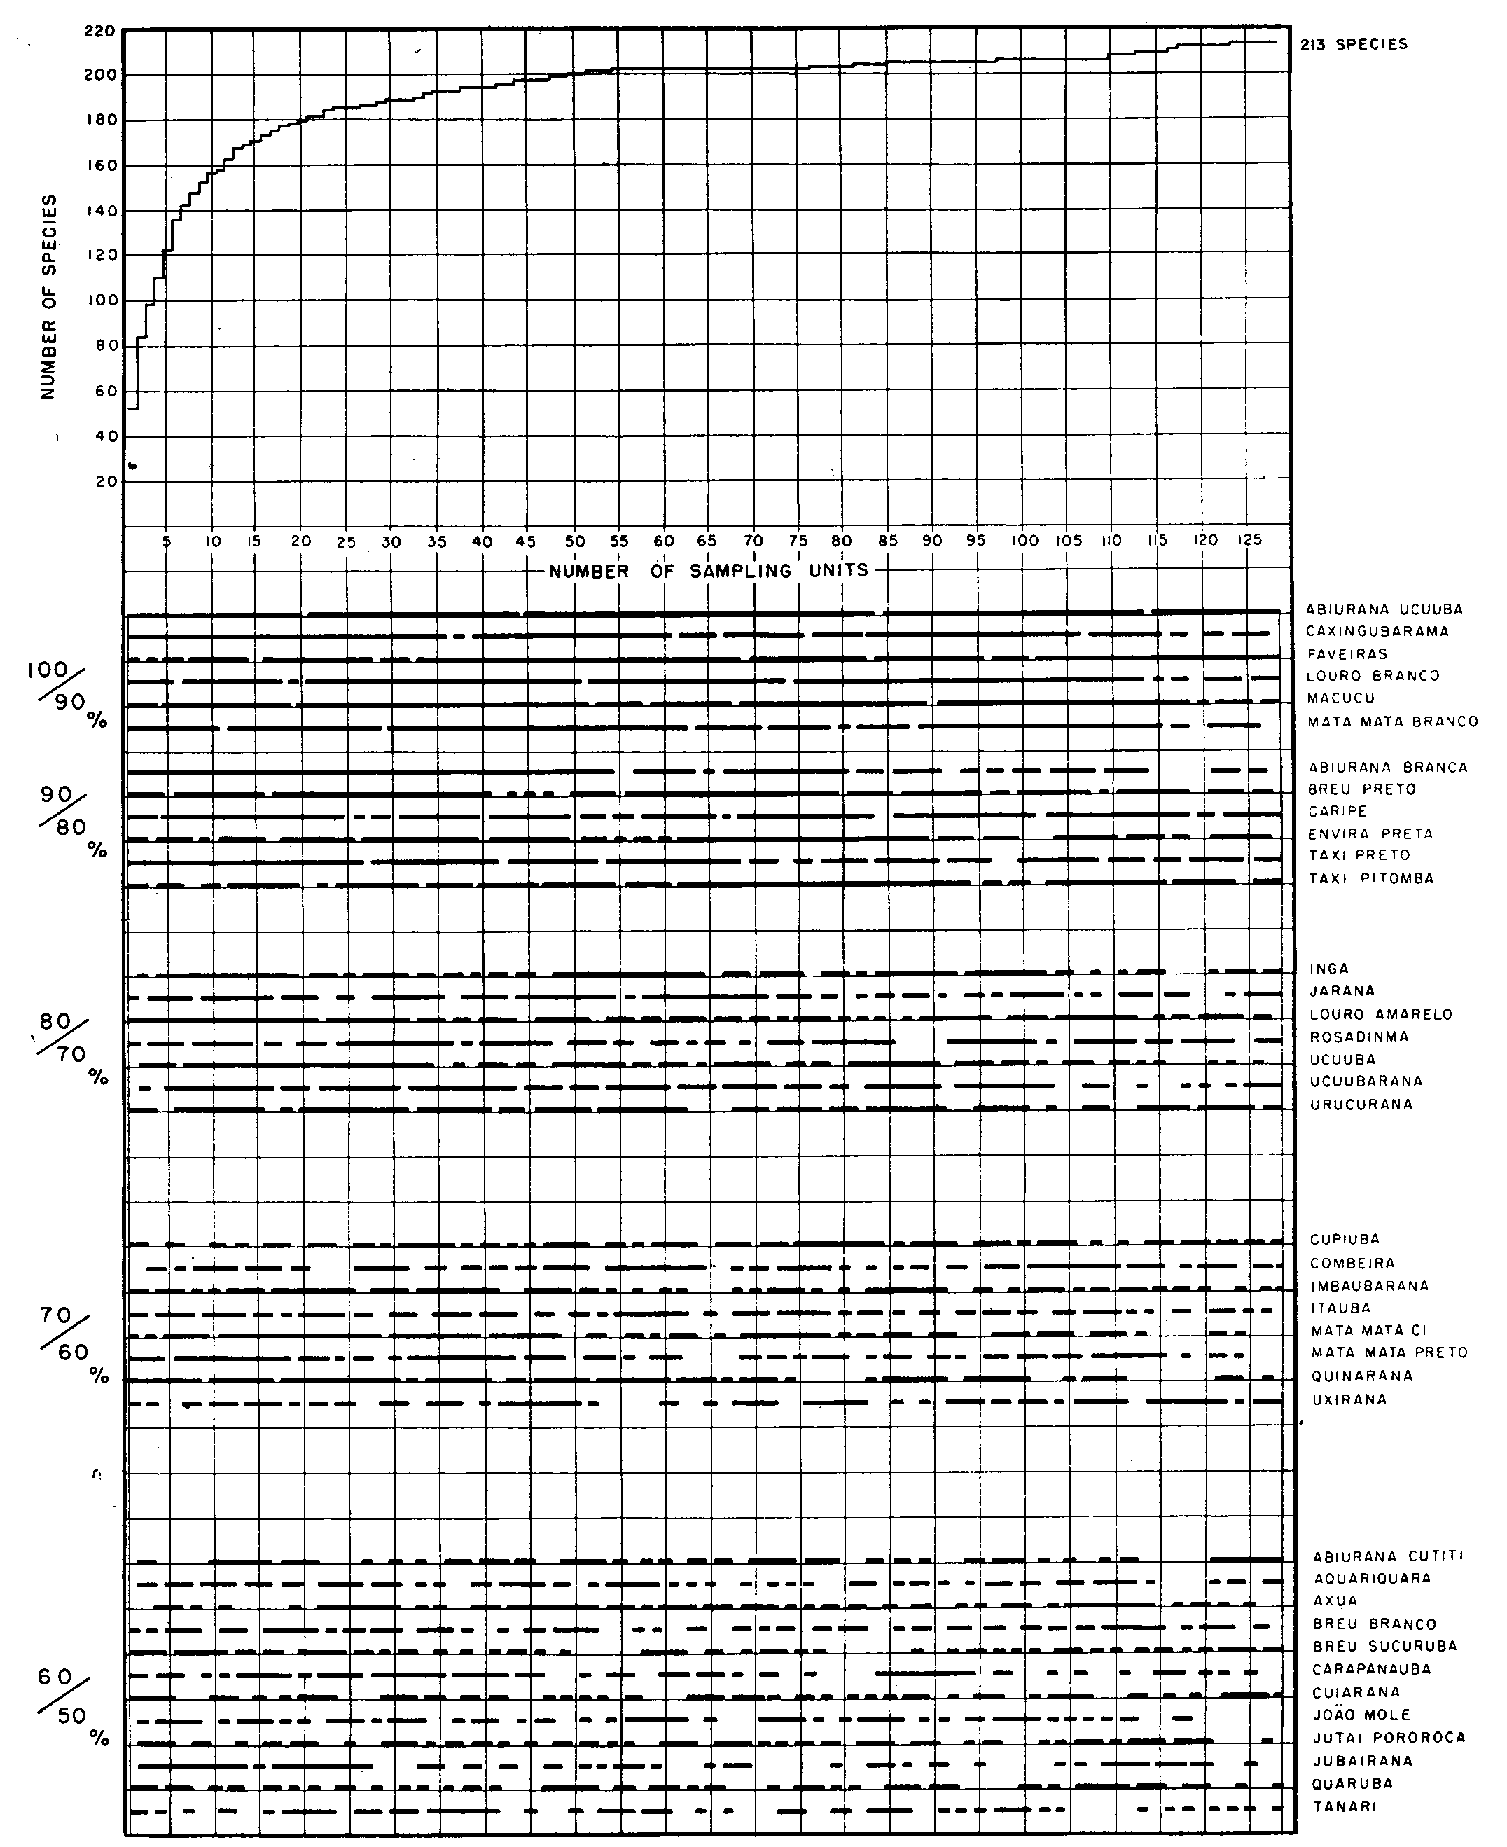
Analyses of composition for all the forests surveyed were made per forest type. All species found in the sampling area were put into presence classes. A species in presence class 100-90 percent meant that this species was found on 100-90 percent of the number of sampling units taken in that type, etc. From each type frequency curves (curva de frequência, das espécies) were made. The sampling units with their numbers appear on the x-axis of this curve, the number of species on the y-axis.
The number of species found in sampling unit No. 1 is indicated above this sample (in the reproduction given in Figure 5, it is 52); the number of tree species found in the sampling unit No. 2 (in the reproduction given it is 84), etc. Above the last sampling unit can be found the total number of tree species enumerated in the sampling units (in the reproduction given it is 213). In all the forest types sampled the majority of the large number of species occurring were already recorded up to sampling units No. 10-15, while in later units only a few additional species were found that had not already been enumerated in this first 10-15. The inference is that one can readily record the commonly and frequently occurring tree species for these forest types from 15 sampling units.
For the purpose of analyzing whether these tree species were, distributed regularly over the sampling units, and so consequently also throughout the forest types surveyed, the species found in the presence classes 100-90 percent, 90-80 percent, 80-70 percent, 70-60 percent and 60-50 percent were given below the frequency curves with an indication in black if found only in a certain sampling unit, named with its number on the x-axis of the frequency curve. This was done to ascertain what species of these presence classes were only enumerated in certain parts of the forest types and could therefore indicate a possible change in composition, as being the indicators or dominant tree species.
Variability of forest types
The next aim of the exploratory survey was to obtain data about the variability of the forest types found. In Belém (where there was no possibility of using punched cards for statistical analyses) every effort was made to get a clear picture of this variability, but after a number of trials with a few sampling units, it became clear that a thorough statistical analysis was needed of as many sampling units as possible, spread out over large forest areas.
After having obtained 918 sampling units of one hectare, the results were sent to the Statistics Department of the Central Organization for Applied Scientific Research in the Netherlands (TNO). This organization was asked if (a) single tree species, (b) some given groups of three species, and (c) the total number of species per hectare occurred according to the Poisson distribution formula, i.e., at random, and how many sampling units would have to be taken in these forest types to obtain an accuracy of 10 percent in respect of the numbers of trees and their volume of merchantable timber, allowing an error of plus or minus 5 percent (actually with a chance of 95.44 out of 100 of being correct). The Poisson distribution formula was used because it deals with the occurrence of isolated instances (the appearance of a single tree) in a continuance of area.
Front the calculations made by TNO it appeared that the distribution of the tree species did, in general, follow a Poisson distribution, but that there were often exceptions where sampling units showed a high number of particular species indicating aggregation or colony forming. In fact, this is one of the most significant findings of these exploratory surveys and explains some features of the nature of the Amazon forests.
In other words, the sampling results showed clearly that practically all tree species were distributed at random but that where the circumstances were particularly favorable for certain species and improved their competitive power in relation to the other species, there was a tendency to aggregation or colony forming. This can only mean that individual tree species of the Amazon forests have the ability to dominate these mixed forests under certain circumstances and very probably have also the ability to form pure stands. Some species dominated large tracts of the understory and others, here and there, the upper story of the forest types sampled.
When a tree species is distributed according to a Poisson distribution or at random, and a 10 percent accuracy in sampling is required with a possible error of 5 percent, it is necessary to enumerate 400 trees of that tree species.2
Tables have been worked out from the presence class data obtained, which enable estimates to be made of the extent in hectares of the sampling required to record this number of trees.
The forester experienced in this kind of work in tropical forests, far from populated centers, would probably regard such surveys with individual species in mind as being very complicated and not very practical. But two examples may be given where more detailed forest surveys have value.
Leasing blocks of government-owned forests
If one of the states in the Amazon valley wants to lease parts of its forests for exploitation in blocks of 10,000 or 20,000 hectares, it would be worthwhile to carry out more detailed forest inventories in a number of such blocks to enable comparisons to be made and hence the proper conditions for the leases. Interest will be not in single tree species but in groups of tree species of current economic value (in the FAO reports referred to previously, several such groups of trees are mentioned).
The number of sampling units of 1 hectare needed to perform more detailed surveys to obtain the volume of standing merchantable timber for such a group can be taken with a large safety margin as 200. This means that for a block of 10,000 hectares, a 2 percent survey is needed and for a block of 20,000 hectares a 1 percent survey.
1 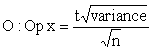 in which 'p' is percentage, 't' a probability factor, 'x' average number of trees per sampling unit and 'n' the number of sampling units. One of the characteristics of the Poisson distribution is that 'x' or the sampling average is equal to the variance. When 10 percent is substituted for p; 2 for t, being the approximate value for a possible 15 percent chance of making a mistake, and for variance: 9. or the sampling average, 400 the formula
  or
or  trees is obtained.
Commercial exploitation
For a commercial firm wishing to exploit a limited number of species, for example, cedro (Cedrela odorata) and freijo (Cordia geoldiana) or pan amarelo (Euxylophora paraensis), acapu (Vouacapoua americana) and sucupira (Bowdichia nitida), it is possible to indicate in the regions covered by the exploratory surveys the forest types where the greatest volume of standing timber of these species per hectare can be found. Provided this volume per hectare and all other circumstances make commercial exploitation appear a reasonable proposition, the company will be prepared to finance a closer inspection of the selected areas, particularly for working out the extraction plan and costs.
A practical solution in, for instance the case of cedros and freijos is to select at random 40 squares of 1 x 1 kilometer and enumerate in these squares all trees of these species. With four good (local) forest workers and a surveyor, one square can be done in one to one and a half days (depending on the undergrowth). The other species require other variations.
TABLE 1. - NUMBER AND SUE OF THE PARTS OF THE SQUARES OF 1 X 1 KILOMETER WHICH HAVE TO BE SURVEYED TO OBTAIN DATA ABOUT AT LEAST 400 TREES OF A TREE SPECIES BELONGING TO A CERTAIN PRESENCE CLASS
|
Presence class |
Size of sample in with a given with a high degree of accuracy |
Number and size of sampling units to be selected at random unit |
Extra transects needed per sampling |
kilometers |
|
percent |
number |
kilometers |
||
|
10-20 |
4 000 |
40 |
1.0 X 1.0 |
- |
|
20-30 |
2 000 |
40 |
0.5 X 1.0 |
1.0 |
|
30-40 |
1 200 |
40 |
0.3 X 1.0 |
2.0 |
|
40-50 |
800 |
40 |
0.2 X 1.0 |
2.0 |
|
50-60 |
600 |
40 |
0.15 X 1.0 |
2.0 |
|
60-70 |
500 |
40 |
0.125 X 1.0 |
2.0 |
|
70-80 |
400 |
40 |
0.100 X 1.0 |
2.0 |
|
80-90 |
300 |
40 |
0.075 X 1.0 |
2.0 |
It is very probable that following the indications given in Table 1, more than 400 trees of a given species will be enumerated, so the accuracy in estimate of volume of standing merchantable timber will also be high. It is recommended that a survey should be made of all trees of the species under investigation from DBH 25 centimeters up, even though most probably exploitation will be limited to trees with a DBH of 50 or 60 centimeters.
At the time these exploratory surveys were started the exchange rate of the Brazilian cruzeiro was 60 to the US dollar. This rate rose at one time to 160 and is at the time of writing between 130 and 140 to the US dollar. Simultaneously the cost of living has gone up substantially.
The actual costs of all the work carried out in the Amazon are known, and have been converted into terms of travel days and sampling percentages. Taking the survey of an area of 3.5 million hectares as normal for one survey group per year, the costs of the groups were between 284 and 53 cruzeiros3 per square kilometer of area mapped and between 379 and 76 cruzeiros per square kilometer of dry land forest surveyed. Including salaries of the whole team, material, photographs, reports, etc., costs were between 341 and 110 per square kilometer for the whole area mapped and between 450 and 147 for the dry land forests surveyed.
3 The upper limits are for the first block with the highest sampling percentage and the lower limits for the area close to Belém where the least time was lost in travel to and from the forests.
It is difficult to express a reasonable average of costs per hectare for this kind of survey, because the sampling percentage varies with the degree of uniformity of the forests under survey. But in terms of US dollars costs may be put at 1 to 4 cents4 per hectare of dry land forest surveyed. This does not include the cost of aerial survey since existing aerial photographs were used.
4 135 cruzeiros = US $1.00.
The costs of a more detailed survey are estimated at 60 US cents per hectare which is high and would not be justified except on an area where the reconnaissance survey had indicated that exploitation was indeed worthwhile. The surveys carried out by the FAO mission have in fact already given sufficient indications as to where precisely further forest investment is a safe proposition.
|
Correction In the article "Some problems of regional planning in forestry" in Unasylva, Volume 15, No. 2, on page 85, Figure 3 and Table 2, instead of "district f, sphere IX" read "district f, sphere VIII." |
![]()
![]()
![]()