![]()
![]()
![]()
Milk production costs differ from country to country, from one producer area to the next, and among production economies. Determining production costs is therefore a delicate matter and should be done on a case-by-case basis. Extrapolating from the figures obtained can only produce approximative results.
A certain amount of data are needed on the context of the dairy farm or business to be costed:
geographical context
economic climate
available farmland
staff
products other than milk
herd size and composition
fodder system
animal housing and milking systems.
The gross margin produced by the activity “milk production” can be expressed in terms of:
number of dairy cows
ha of fodder area
number of labourers
available capital.
The choice of which ratio to use will depend on the individual farm situation, i.e. on its own limiting factors.
A livestock producer with a fixed installation which he does not wish to modify will be more apt to select “number of dairy cows”. He may indeed have a fixed amount of labour to work with the herd, for which reason he wishes to maintain a constant number of animals.
A livestock producer with a limited amount of land is more apt to choose “hectares of fodder area”, though he may modify the herd size if he is willing to make new investments.
If available labour is the limiting factor, the farmer will try to get the maximum gross margin per labour unit available on the farm.
Available capital is the limiting factor for many farmers. In this case gross margin will be compared to the capital invested.
If a government wishes to develop dairy production, then, it should establish a farm-gate milk price which will make dairy production more profitable in terms of the ratio chosen by the farmer than other possible farming activities in that area. The cost price of one litre of milk is therefore not the main criterion for a milk producer. He ought rather to look at the gross margin in terms of the specific limiting factor of his own farm.
What we usually see in the developing countries is that fodder cropland and dairy potential are so underexploited that any effort to intensify production and adapt resources to stock requirements initially entails reduction of costs per unit of milk produced. Logically then, by simultaneously intensifying fodder production and dairy production, the cost of producing milk begins to drop as production rises, significantly pushing up gross margin.
Specialization and intensification, however, mean boosting production at the cost of rising operating expenses (more fertilization for fodder crops; diversification of the fodder system; changes in how the livestock production system is run and in the basic livestock diet; better fodder quality; using more concentrates; adding more dairy cows and breeding better milkers, and so forth).
Like any enterprise, an agricultural enterprise needs to be broken down into main headings corresponding to its specific activities.
These main headings may include:
dairy production
livestock production
cereal production
food crop production, etc.
These cost centres correspond to the different purposes the farm has set itself. It is quite rare, particularly in the developing countries, to find mono-purpose farms.
To ensure that these various sections of the farm run smoothly, the farmer also needs to develop a number of auxiliary sections:
agricultural equipment
repair and maintenance shop
harnessing and treating water
storage areas for fertilizer, veterinary stocks, plant protection products, harvests and the like.
And, like any enterprise, the farm will have structural costs which will, of course, be relatively minor for small farms.
Farms, unlike most industrial or commercial enterprises, are often both a consumption unit the farmer and farm family) and a production unit. So cost accounting will need to reckon in all withdrawals in cash or in kind by the farmer to meet his/her own needs.
Agricultural economics uses the term “farm income”. This is the amount remaining to the farmer and farm family after operating expenses. Such income therefore serves to remunerate the labour and capital supplied by these people.
Farm income differs from available income because part or even all of it may have been used during the year due to a variation in stocks or to investment expenditure. On the other hand, it includes costs which are not translated into actual expenditures of money such as depreciations.
In order to account for auxiliary charges, which are counted in cost accounting, we shall speak of the income of the business enterprise:
| Business income | = | Farm income | - | Auxiliary charges |
Auxiliary charges basically comprise:
The rental value of land owned by the farmer. This is the potential rental value of the land which the farmer would have to pay were he forced to rent.
The interest from capital commitments (excepting land).
Wages not paid to the farmer and his family.
| Farm income | = | Farm output | - | Operating expenses |
The farm output consists of the product of the various activities on the one hand, and of such various yields as:
subsidies
work done for third parties
financial proceeds
work done by the enterprise for its own benefit.
Farm income not being the same as available income, it would be in the farmer's interest to draw up both a chart of fiscal year finances (see Table 1) and a budgetary estimate for the following financial year. This second table will enable him to avoid a cash flow problem, indicating how much he can withdraw for his own reasons.
Unvarying rules for evaluating stocks and fixed assets must be strictly followed. Only the enterprise's own land appears on the inventory. For the first inventory, the average price of land of equal quality in the area will be taken as a base datum. Land purchased during the financial year will be inventoried at purchase value. The inventory value of buildings, equipment and installations equals the purchase value less cumulative write-off from previous financial years. Livestock will be listed under stocks, not capital.
There should be three categories of commodities in stock:
Supplies in stock
Harvest stores
Advances for crops. This includes all sums earmarked for future harvests such as seeds in the ground, fertilizers, and so forth.
Supplies and advances for crops are inventoried at purchase value. Harvest stores such as cereals, straw and hay are inventoried in bulk by amount at the probable market rate at the time the inventory is made. For unmarketed crops such as silage and fodder beets, the fodder unit value will be reckoned in comparison with equivalent market commodities such as hay.
The milk produced in a dairy establishment can be marketed in different ways. It may be:
sold to a dairy
retailed
used for farm family consumption or part of it given to hired farm laboureres
used to feed calves
used as the raw material for a processing unit producing pasteurized milk, cheese, yoghurt or butter.
These different marketing systems should be compared to determine the more profitable one for a given dairy farm.
Cost accounting makes it possible to compare the cost price of milk with the purchase price paid by the dairy. If the dairy buys refrigerated milk, the cost of refrigeration will have to be subtracted from the price of one litre of milk to get the price of one litre from the milking room.
For retail sales, distribution costs must be added to the cost price of milk from the milking room to check whether retail sales are more profitable than selling to the dairy.
Milk consumed by the farm family or farm workers will be accounted for at cost price and listed under the heading : “benefits in kind”.
The cost price of milk will be compared to substitute feeds to determine which would be preferable: to save it for feeding calves or to sell the milk and buy substitute feeds.
If the calves are milk-fed, the estimated milk price can be lowered as milking costs do not have to be taken into account. Such milk will constitute an internal sale between the “milk production” section and the “livestock production” section. The price of this milk will be considered as proceeds for the “milk production”section and charged to the “livestock production” section. This internal sale system is essential for determining returns per activity or operation, but has no bearing on the overall returns of the dairy farm.
The price paid by the dairy for the raw material will be the basic figure considered in deciding whether or not a processing unit is an attractive proposition.
| PURPOSE OF EXPENDITURE | SUM | RESOURCES | SUM |
|---|---|---|---|
| THIS YEAR, I USED MY RESOURCES FOR: | THIS YEAR, I DERIVED MY RESOURCES FROM: | ||
| 1) My own needs | 1) My farm income | …… | |
| - Cash withdrawals | …… | plus yearly write-off | …… |
| - Withdrawals in kind | …… | …… | |
| TOTAL: | …… | TOTAL: | …… |
| 2) My “exceptional” purchases and expenses | 2) My exceptional resources | ||
| - Purchase of equipment | …… | - Resale of equipment | …… |
| - Other investments | …… | - Resale of other goods | …… |
| - Other miscellanous losses | …… | - Other miscellaneous profits | …… |
| - Loan repayments (capital) | …… | - Loans received | …… |
| …… | - Subsidies and other inputs | …… | |
| TOTAL: | …… | TOTAL: | …… |
| 3) To increase the value of my stocks | 3) Reduced value of my stocks | ||
| - Livestock | …… | - Livestock | …… |
| - Other stocks | …… | - Other stocks | …… |
| TOTAL: | …… | TOTAL: | …… |
| 4) For third parties | 4) For third parties | ||
| - To reduce my debts and short terms | …… | - Increase of my debts and short terms | …… |
| - To increase my debts | …… | - Reduction of my debts | …… |
| - To increase my assets | …… | - Reduction of my assests | …… |
| (bank and cash on hand) | …… | (bank and cash on hand) | …… |
| TOTAL: | …… | TOTAL: | …… |
| GRAND TOTAL OF MY EXPENDITURE: | …… | GRAND TOTAL OF MY RESOURCES: | …… |
Livestock is one of the major assets of an agricultural enterprise specializing in milk production. A set of criteria are commonly used to describe herd composition, trends, reproduction and milk production. These criteria are used for technical management of the animals and constitute useful elements for evaluating economic performance.
Herd size also needs to be compared to available fodder crop area to make sure the herd will be properly fed.
3.3.1 Herd composition
The following are used to describe herd composition:
NUMBER OF DAIRY COWS: This is the number of dairy cows actually present in the stable during the financial year. The presence of both milkers and dry cows, whether present all or part of the year, is counted in days and the total number of days divided by 365. The number of dairy cows present comprises the reference number of animals for reckoning the average annual performance of all cows.
NUMBER OF DAIRY COW LIVESTOCK UNITS (DCLU): This is the number of dairy cows present, expressed as “livestock units”.
The large animal unit (LU) is a reference animal with an energy requirement of 3 000 fodder units (FU). It stands for a 600 kg dairy cow present on the farm for twelve months and producing 3 000 litres of milk with a fat content of 40 g, and one calf.
In using this unit, the number of dairy cows present is replaced by an equal number of standard dairy cows requiring 3 000 fodder units (see following chapter). The following formula is used to obtain the value of the LU equivalence ratio for a dairy cow:
K = 0.067 W + (0.0002 b + 0.005) Y + 0.21
in which:
K = equivalence ratio W = weight in hundreds of kg b = butterfat rate in grams per litre Y = annual milk output in hl
In actual fact, the LU equivalences are approximative. Often a simplified table showing the data listed on page is sufficient.
NUMBER OF BOVINE LIVESTOCK UNITS: This is the number of dairy cow livestock units plus other bovines for livestock or beef production, which are in turn expressed in LU, i.e. in cattle consuming 3 000 fodder units. Of course the concept of LU based on the comparison of animals of different categories to a multiple or fraction of a cow with specific characteristics is debatable. Moreover, the energy requirements of the animal are simply a common denominator used for comparison. No account is taken of the fact that requirements may be satisfied by different types of fodder.
In any case, this system of equivalence does have the merit of providing an order of magnitude of herd size based on a single unit of measurement. This makes it easier to compare performances and numbers of units at the different work stations, and to calculate simple ratios involving several animal categories.
RELATIVE IMPORTANCE OF DAIRY COWS WITHIN THE HERD AS A WHOLE: DCLU/BLU (%): This is the proportion of all bovine livestock units (BLU) represented by dairy cow livestock units (DCLU). This ratio illustrates the extent of dairy specialization. A high ratio may indicate that reproduction is partly or just barely assured. A low ratio expresses the presence of a complementary livestock production activity such as young animals or fattening stock. Then again it may be an indication that the herd is beginning to grow.
AGE AT FIRST CALVING: This is the average age of cows giving milk for the first timme during the last fiscal year.
AVERAGE LACTATION RANK: This is the sum R of lactation rankings in terms of the number of dairy cows present. This ratio indicates the average age of the dairy production unit, which is the outcome of renewal and culling decisions taken in the past. An exact calculation would need to take into account how long each cow had held its present rank as of the date of estimation of average rank. In practice, one can use (R - 0.5).
“LARGE ANIMAL UNIT” EQUIVALENCE OF A HERD OF FARM CATTLE
DAIRY COWS
| Live weight kg | 500 | 600 | 700 |
|---|---|---|---|
| Milk production at 4% in kg | |||
| 2 000 | 0.80 | 0.87 | 0.93 |
| 3 000 | 0.93 | 1.00 | 1.06 |
| 4 000 | 1.06 | 1.13 | 1.19 |
| 5 000 | 1.19 | 1.26 | 1.32 |
BREEDING CALVES (0 to 3 months)
| Average daily gain (kg) | 0.50 | 0.75 | 1.00 | 1.25 | 1.50 |
| LU | 0.05 | 0.06 | 0.07 | 0.09 | 0.11 |
HEIFERS
| from 3 months to 1 year | 0.40 LU (growth from 100 to 300 kg) |
| from 1 to 2 years | 0.60 LU (growth from 300 to 450 kg) |
| from 2 to 3 years | 0.90 LU (growth from 450 to 550 kg) |
FATTENING CATTLE (weight 450 to 700 kg)
| Average gain 0.75 kg/day | 0.8 LU |
| Average gain 1 kg/day | 0.95 LU |
| Average gain 1.25 kg/day | 1.05 LU |
3.3.2 Herd trends
The latest trends are shown by renewal and culling rates calculated over the course of the last fiscal year:
RENEWAL RATE: The renewal rate is the ratio of new milkers (cows giving milk for the first time) to the total number of cows in the herd.
The datum “age at first calving” may be added to give a fuller picture.
CULLING RATE: This is the number of cows culled from the total herd of dairy cows during the past fiscal year.
Late culling of cows who calve regularly and on schedule and are consistently good milkers up to an advanced lactation rank, may be economically attractive. As long as the depreciation of the animal's value (annual drop in sale price when culled) is less than the extra gain from continuing to use the cow, there is no point in culling unless a breeding programme introduces high-potential breeding animals which promise to show profit in current variable charges.
3.3.3 Herd reproduction
Technical control of breeding consists of measuring the rate of success at the different stages of fertilization, gestation and calving.
FERTILITY RATE OR SUCCESSFUL INSEMINATION AND GESTATION RATE: This is represented by the number of females calving with respect to the number of females inseminated. A high fertility rate depends on close surveillance of the cows, timely interventions (40 to 70 days after calving) when the animal is on heat, and satisfactory herd health.
RATE OF PROLIFICITY OR SUCCESSFUL CALVING: This is the proportion of viable newborn calves out of the total number of cows giving birth.
FECUNDITY RATE OR RATE OF SUCCESSFUL REPRODUCTION: This is the proportion of viable newborn calves out of the total number of females mounted. It equals the sum of the rates of fertility and prolificity.
AVERAGE INTERVAL BETWEEN CALVINGS FOR THE HERD AS A WHOLE (expressed in days): The target should be some 365 days, if necessary culling the least fertile females. Reducing the average interval between calvings by 18 days in a herd of 60 cows is no minor achievement considering that this means an additional 2 to 3 calves plus the extra milk produced.
X = average interval between calvings
Y = number of dry days (average)
Outside a range of:
360 days < x < 380 days and 60 days < y < 90 days, herd performance is not satisfactory, as this includes periods of underexploitation (or, exceptionally, over-exploitation) which lower the overall milk performance. The answer is animal hygiene, feeding, systematic fertility planning records, and also culling specific individuals for whom maintenance and veterinary costs are abnormally high for the milk they produce between calvings.
3.3.4 Estimation of herd worth
The herd represents a major part of the variable capital of the dairy farm. This capital should therefore be estimated at the start and close of the fiscal year.
Generally speaking, the livestock population of an agricultural enterprise is considered a stock subject to re-evaluation each financial year, rather than a capital asset.
There are two categories of livestock on the farm:
Breeding stock
These animals are present on the farm for several financial years. The value of the animal for inventory purposes will be taken as value at the time it enters the breeder category. This figure will remain constant until the animal is sold or dies.
(b) The replacement herd and dairy cows
The net sale value of each animal will be the figure retained for inventory purposes, with reference to market quotations on the day of the inventory. This figure is, of course, an estimate.
If the herd estimate at the end of the fiscal year is higher than at the beginning one will have:
| Difference | + | Proceeds from animal sales | - | Value of animal purchases | = | Profit or loss from herd |
Example:
| Estimated value of herd at beginning of financial year | 100 000 |
| Estimated value of herd at close of financial year | 130 000 |
| Proceeds from animal sales | 10 000 |
| Value of animal purchases | 50 000 |
30 000 + 10 000 - 50 000 = - 10 000
A loss of 10 000 on the herd is thus recorded for the financial year. This loss usually has two main causes - either the animals die during the financial year or there is a substantial drop in market quotations.
If the herd estimate at the end of the financial year is lower than at the beginning we will have:
| Proceeds from sale of animals | - | Value of purchases of animals | - | Variance from estimation | = | Profit or loss on herd |
Example:
| Estimated value of herd at beginning of financial year | 200 000 |
| Estimated value of herd at end of financial year | 180 000 |
| Proceeds from sales of animals | 70 000 |
| Total value of purchases of animals | 10 000 |
70 000 - 10 000 - 20 000 = + 40 000
During the financial year the farm therefore realized a profit of 40 000 on the value of the herd.
For “milk production”, sales proceeds will be taken to mean actual sales receipts from off-farm sales and also fictitious sums which represent internal sales between work stations. Likewise, the value of purchases corresponds to real expenditure plus fictitious expenditure from internal sales between work stations.
It is also recommended that week-old calves who are to remain on the farm be listed as an internal sale between the “milk production” work station and the “livestock production” work station in order to differentiate clearly between milk production and livestock production costs.
Profits from the herd, milk sales and the sale of fertilizer will count as proceeds of the dairy side of the farm.
Should there be herd losses, the proceeds corresponding to the dairy side will equal:
(sale of milk + sale of manure) - herd losses.
Note 1
The dairy herd produces manure which is used as fertilizer on the farm to improve soils on which the fodder to feed the dairy cows is grown. Alternatively, the fertilized crops may be sold off-farm. This is why it is a good idea to reckon the value of manure, counting it as a proceed for the dairy farm (the system of internal sales will reckon it as a charge for user sections).
Once the stock has been defined, the cropland to feed the stock needs to be designated.
In cost accounting, all operating expenses for this are attributed to milk production.
3.4.1 Energy value of feeds and milk production
Lucrative milk production consists of getting the highest possible yield at the lowest possible cost per litre of milk compatible with good herd health.
A balanced diet is a prerequisite to high yield. The feed ration is all feed distributed to the animal over a 24-hour-period to ensure coverage of maintenance and production requirements - milk or meat. Both quality and quantity are important in feed rations. The question is which feeds and how much.
Each feed ration has its characteristic:
Energy level.
Protein, fat, carbohydrate, mineral and vitamin content.
Bulk, i.e. the volume of the ration (which depends on the fibre content or roughage).
Livestock watering conditions.
Energy requirements may be evaluated in fodder units (FU). The reference element “barley” is used, in which the nutritional value of 1 kg of barley corresponds to one fodder unit.
Other feeds are compared to this standard:
| 1 kg of barley or 1 FU | ( 1.65 kg bran |
| ( 0.96 kg wheat | |
| ( 1.00 kg soyabean | |
| ( 1.6 to 2 kg hay | |
| ( 6.6 kg grass | |
| ( 6.5 to 10 kg fodder | |
| ( 1.25 kg oats | |
| ( 3.125 kg oat straw | |
| ( 0.94 kg soyabean or groundnut cake | |
| ( 7.14 kg grass silage | |
| ( 5.26 kg maize silage |
Really strict equivalents using the fodder unit are not really possible because different animal species use what they digest in different ways. Another difference is whether the food is used for maintenance, growth, milk production, labour or gestation, etc.
One fodder unit for a fattening pig, for example, is 1 650 kcal and for bovines 1 883 kcal at average production levels.
In some countries, the energy value is indicated directly in kilo-calories rather than in FU.
Maintenance requirements represent some 0.75 Fu per 100 kg of live weight.
Supplementary rations in the following proportions depending on the age of the dairy cow will also be needed:
| 2 years | … | 1.00 supplementary fodder unit |
| 3 years | … | 0.60 supplementary fodder units |
| 4 years | … | 0.30 supplementary fodder units |
| 5 years | … | 0.15 supplementary fodder units |
The figures also needed to be corrected during the gestation period (growth of the foetus). It is a good idea to add, at the different periods of gestation:
| 4 months | … | 0.2 FU |
| 5 months | … | 0.4 FU |
| 6 months | … | 0.7 FU |
| 7 months | … | 1.0 FU |
| 8 months | … | 1.5 FU |
| 9 months | … | 1.5 FU |
At current estimates, production of one litre of milk increases energy requirements by roughly 0.4 FU.
The feed/production ratio is the first thing to look at in breaking down the per litre cost of feed.
A dairy cow needs fodder for maintenance. This can be thought of as a fixed cost inherent in the existence of the herd.
Maintenance requirements depend on the livestock species and the age and physiological status of the individual animal. A growing animal requires more feed to form new tissue and to grow. A gravid animal requires more feed for the growth of the foetus.
The main contribution of any feed in excess of these requirements will be towards milk production.
When total feed consumption is compared to milk production, it becomes obvious that a good milker requires considerably less feed per litre of milk than a poor one (Graph 1). Production costs therefore tend to drop as milk cow yields rise.
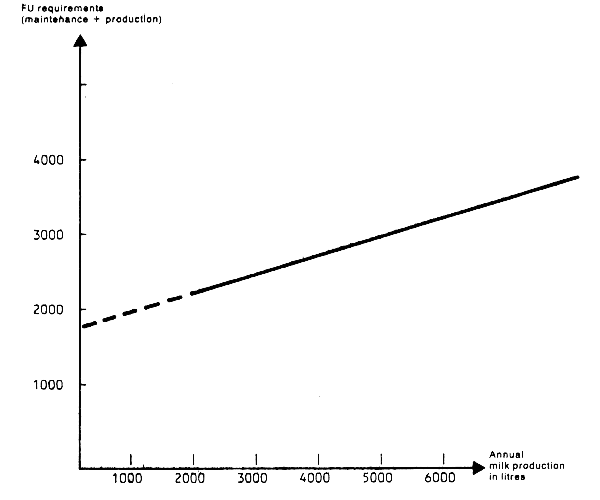
Graph 1. FODDER UNIT (FU) REQUIREMENTS BY MILK PRODUCTION
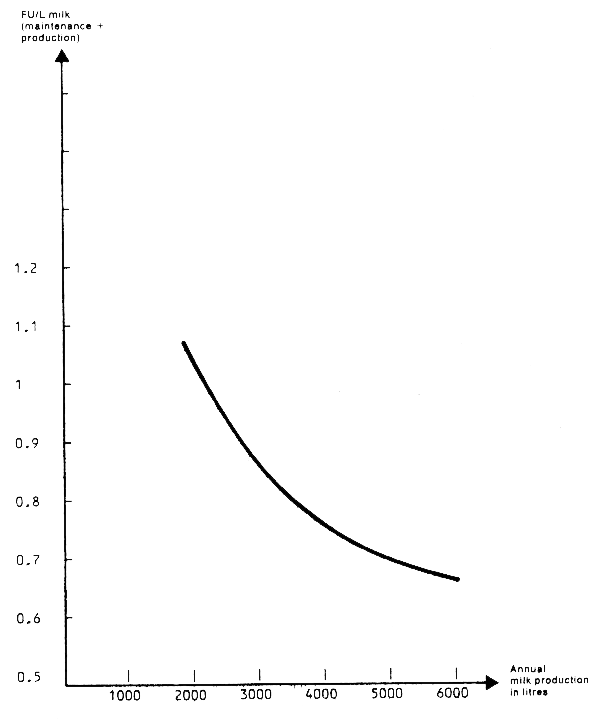
Graph 2. FODDER UNIT (FU) REQUIREMENTS PER LITRE OF MILK IN ACCORDANCE WITH ANNUAL MILK PRODUCTION
This statement should really be qualified by the following comments:
Costs differ substantially according to whether the diet consists of fodder grown on the farm, fodder purchased off-farm, coarse fodder or concentrates. So feed costs will vary greatly depending on what can be grown on the dairy farm and what is available on the local market.
Moreover, imported feed may be very cheap, as when it is subsidized by a producer country or enjoys preferential tariffs, but this situation can change from one day to the next, and the dairy famers' budget should include a contingency plan.
Concerning coarse fodder, fodder type, fertilization, farming and harvesting techniques, etc. make for a considerable disparity in per hectare productivity, and this is also reflected in costs.
Graph 1 shows neither the full complexity nor all components of the diet. The extra energy and nitrogen inputs of high-level production also entail extra costs.
The linear representation of production/consumption used in most feed tables is of only relative value short of a given volume of production, so far as the genetic potential of the animal and the livestock producer's expertise at getting the most from his stock are concerned.
3.4.2 Selecting the ration
The dairy cow is a converter of feeds which are, in the main, and out of necessity, produced right on the farm. These considerable masses of coarse fodder, which make up the basic diet, can only be grown near the livestock production area, and generally cost less per unit than commercial feed.
Grasslands have always been prime, potential, fodder-growing areas for dairy production. Dairy cow production is a natural choice in areas where soil and climate allow grass cover to thrive year round - or at least long enough to ensure partial coverage of fodder requirements.
Fodder conservation techniques are of considerable importance in producing surpluses to be kept and distributed at intervals over considerable periods of time. They allow a more constant livestock diet throughout the year, which is decisive in improving dairy performance.
Purchases of concentrated feeds or internal transfers of feeds produced on the multi-cropping livestock-production complex may be necessary to ensure balanced rations, because of animal intake capacity, fodder quality or carry-overs of fodder stocks.
Indeed, intensified dairy farming with supplementary feeding is only acceptable where economically justified, i.e. where the extra expense is offset by the additional income.
The most precise economic and technical analyses are those covering individual animals over time at various stages in the milk and fodder production process.
In current practice, the livestock producer works out a type of ration for the different periods of the year in accordance with his stock's milking capacity and fodder supplies available on the farm. He estimates the fodder's nutritional value, i.e. the ability to cover a given period of milk production, and then supplements it by concentrates. An economic analysis of the ration should touch on both the suitability of the fodder system selected and the performance of the supplmentary feed. In economic terms this means the profitability of the various fodder/concentrates associations.
The technical objective is to provide the animal at all times with large amounts of farm-produced fodder. A sound fodder system is one which assures year-round, regular supplies, whilst matching the patterns and possibilities of the farm.
There are no simple economic criteria for shared fodder systems. Production costs and the nutritional characteristics of the fodders within the system must both be borne in mind, plus the cost of supplementary feeding. A fodder budget based on feed rations plus information on expenses specific to fodder production can serve as the basis where what is involved is a single area on which different fodder combinations are grown. Indeed fodder budgets or operation models, based on technical and economic data, can suggest fodder systems appropriate for a specific farm and dairy establishment.
Going for intensive dairy production systems in most cases means setting aside a permanent grasslands area as the basic source of coarse fodder, at the same time improving grasslands productivity and adding new fodder crops. Even at highly intensive levels of dairy production, improved milk performance not only requires feed supplements in the form of concentrates, but also increased fodder production.
3.4.3. The area under fodder
The area under fodder consists of all cropland on the farm used for growing fodder.
The area under fodder includes:
The main fodder area (MFA), used primarily for growing coarse fodder:
Permanent grasslands (PGL) (pastures, grass, meadows, hay meadows, etc.).
Temporary and man-made grasslands.
Annual fodder crops (maize, fodder, grain silage).
Weeds used as fodder.
The areas under grain for animals, when the grain is harvested dry, do not form part of the MFA.
The additional fodder area (AFA):
Intercropped fodder crops (two or more crops are grown on the same plot the same year, each of which is harvested at the same season.
The crop with the longer growing cycle or the more important one is called the main crop and the others catch-crops.
The area under crops whose by-products are used for fodder: beet tops and pulp, pea pods, and so forth.
These two categories of fodder area taken together are often referred to as the total fodder area (TFA).
TFA = MFA + AFA
Fodder area costs are charged to livestock activities connected with the fodder area, the cost is proportional to the number of LU.
The farmer therefore needs to monitor the following:
Milk production response to fodder intake.
Performance of areas used for fodder production.
The usual technical yardstick is the average main fodder area/livestock unit. This is the ratio between the number of dairy cow equivalents and the main fodder area.
| TOTAL | |
|---|---|
| FIXED COSTS | |
| - Depreciation of equipment and buildings specific to this section | … |
| - Allocation of structural costs | … |
| VARIABLE COSTS | |
| - Seeds or seedlings | … |
| - Fertilizer or manure | … |
| - Plant protection products | … |
| - Direct labour costs | … |
| - Costs broken down by auxiliary sections | … |
| - Maintenance of section-specific buildings and equipment | … |
| TOTAL COSTS | |
| TOTAL PRODUCTION IN FU | … |
| COST PRICE OF FU | … |
In the developing countries, milk production tends to be extensive and so the goal of dairy development programmes is to improve productivity, thus reducing the labour component of production costs. One result of improved labour productivity is to expand the role of working capital.
The dairy farm takes on a new dimension and structures change. The same or a smaller workforce, the same or less land, much more capital, much more milk - all of which, in terms of production costs, modifies the pattern of expenditure. Service and equipment charges rise, depreciation costs and capital remuneration take on new weight, gains per unit produced are smaller but production volume shoots up. To sum up, earned income, which is what remains when all factors other than labour have been remunerated, is only assured or improved by boosting production and putting more capital into the new dairy undertaking.
In the developing countries, an active dairy policy entails:
a sharp reduction in the number of workers for a given output;
a reduction in the cost price of milk;
greater labour efficiency.
This turnabout can only take place if the farmer has either his own capital or easy access to credit. So if a government wishes to develop milk production, it should make credit accessible to milk producers on preferential terms.
On small farms, the farmer and his family are the major source of labour and the corresponding costs are included in the auxiliary charges. On large farms, on the other hand, labour is distinct from capital. Workers receive a salary, but do not share in the proceeds of the enterprise. For a comparison of the performance of highly different production units, therefore, all auxiliary charges will need to be considered and a reference unit chosen to identify jobs done on the farm. Reference units will vary from country to country in accordance with custom or tradition and, more frequently, in accordance with specific national legislation.
The term used in France is human labour unit (HLU) or labour unit (LU).
The human labour unit (HLU) is reckoned as equal to a total annual workload of 2 400 hours. The number of hours is subject to a corrective factor based on age and type of work.
| HLU for a full-time, able-bodied worker | ||
|---|---|---|
| Age | Man or woman | |
| 14 to 16 years | …… | 0.5 |
| 16 to 18 years | …… | 0.7 |
| 18 to 60 years | …… | 1.0 |
| 60 to 65 years | …… | 0.8 - 0.5 |
| Over 65 | …… | 0.5 - 0.3 |
The labour unit (LU) is a standard labour unit equivalent to the work done by one full-time person based on a figure of 2 300 hours per year (288 eight-hour days). Part-time workers are counted in fractions of LU based on the actual amount of hours worked on the farm.
The total annual workforce on the farm is a known factor when the reference unit is selected. Jobs should then be classified according to whether they are to be attributed to an activity or work section with or without distribution keys. These will be called either direct or indirect jobs.
This job classification assumes that a record is kept of job time, i.e. the time spent on a job directly attributable to a specific operation.
The number of HLU available on a farm is one of its definable criteria. The number of HLU may or may not be a limiting factor in a country or region. This depends on whether there is a possibility of hiring off-farm labour or not. Another factor is whether labour costs allow a profitable cost price.
The data on farm area and its use, available labour, the herd, and herd performance can be summarized in a table describing the dairy farm (see Table 3).
Costing and management audits of a dairy farm should look at the present situation of the farm and budget forecasts designed to increase farm profitability drawn up accordingly.
A milk cost price estimate should include a table describing the dairy farm supplying the milk. This will avoid guesswork.
| Farmland: 58.4 ha | Labour | Numbers | HLU | |
| Kind of operation (self-owned | Dairy farmer | 1 | 1 | |
| (rental 58.4 ha 100% | Spouse | 1 | 0.5 | |
| Animal housing: open-air | Worker | |||
| Milking system: stalls 2 × 3 | permanent | 1 | 1 | |
| Yearly milk yield per cow: 5 139 kg | TOTAL | 3 | 2.5 | |
| Fat content: 41.0 g/1 | Working capital per | |||
| Protein content: 32.0 g/1 | HLU: 315 000 francs | |||
| Crop distribution: | Area | % of farmland | % of MFA | |
|---|---|---|---|---|
| Cereals-Wheat | 2 | ha | 3 | |
| Barley | 6 | ha | 10 | |
| Fodder cropland | ||||
| - Maize | 8 | ha | 14 | 16 |
| - Temporary grasslands | 6 | ha | 10 | 12 |
| - Natural grasslands | 36.4 | ha | 62 | 72 |
| Summary: - Grains | 8 | ha | 14 | |
| - MFA | 50.4 | ha | 86 | |
| - Total farmland | 58.4 | ha | ||
Herd composition
Summary:
| Numbers | Coeficient | LU | |||||
|---|---|---|---|---|---|---|---|
| beginning | end | middle | |||||
| Rearing calves + 2 years | 35 | 33 | 20.08 | 0.9 | 18.07 | Dairy cows | 65.25 |
| Rearing calves1 to 2 years | 18 | 11 | 21.66 | 0.6 | 13.00 | Other bovines | 41.27 |
| Rearing calves- 1 year | 11 | 28 | 25.50 | 0.4 | 10.20 | Total LU | 106.52 |
| Dairy calves | 79 | 60 | 65.25 | 1 | 65.25 | LU/ha MFA = | 2.11 |
These data described the basic components of the farm - the geographical context and economic climate are additional considerations.
Auxiliary cost centres vary in number in accordance with the type of farm.
There is almost always a cost centre for farm equipment not specific to a given activity. This never includes a milking machine (used in only one work section), for example, but does include a tractor.
Here are other possible auxiliary cost centres:
Water extracted by pumping from a well or reservoir, perhaps including water purification facilities.
Site development
Transformer
Steam.
The costs of these auxiliary sections are then subsequently broken down by the various user sections.
This paper covers only the agricultural equipment centre.
3.7.1 Agricultural equipment centre
A wide range of equipment including tractors, ploughs, cultivators, harrows, hoes, rollers, and fertilizer spreaders may be included in this section.
For the most important equipment such as the tractor, total costs must be related to production time and user sections subsequently billed pro rata by user hours.
Table 4 breaks down the hourly cost of “driver plus tractor”. This table does not show structural costs, which will be divided among the principal sections. However, if the farm were to plan to rent a tractor and driver from a third party for services rendered, the preceding hourly cost should also be billed as part of structural costs.
| DESCRIPTION | TOTAL | ||
|---|---|---|---|
| 1. | FIXED COSTS | ||
| - | Depreciations: | ||
| - Tractor and accessories | … | ||
| - Tractor shed | … | ||
| - Fuel storage | … | ||
| - Fuel pump | … | ||
| - | Taxes and insurance on tractor | … | |
| 2. | VARIABLE COSTS | ||
| - | Fuel | … | |
| - | Oil | … | |
| - | Tyres | … | |
| - | Maintenance and repair (spare parts) | … | |
| TOTAL COSTS (FIXED + VARIABLE) | … | ||
| TOTAL COSTS PER HOUR OF WORK (1) | … | ||
| HOURLY COST FOR DRIVER (SALARY + CHARGES) (2) | … | ||
| HOURLY COST (TRACTOR + DRIVER) (1) + (2) | … | ||
The basic characteristic of structural charges (which primarily concern the structure of the farm) is that they are stable from one year to the next. In practice, however, this is a short-term stability, as any major decision by the farmer will modify the situation.
These charges chiefly include:
Rentals and rental charges or capital remuneration;
Floating labour;
Land taxes and taxes not levied on a specific activity;
Depreciation of administrative buildings and staff premises, depreciation on administrative equipment and miscellaneous;
Various management expenses: transport, telephone, stamps, stationery, bookkeeping;
Insurance;
Financial costs;
Costs which cannot be attributed to a specific activity (car or multi-purpose pickup, water, electricity, etc.).
| DESCRIPTION | TOTAL | ||
|---|---|---|---|
| FIXED COSTS | |||
| - | Depreciations: | ||
| - | dairy-specific buildings - stables, animal housing, milking room. | … | |
| - | specific equipment | … | |
| - | Fixed costs of dairy fodder production areas. | … | |
| - | Share in structural costs. | … | |
| VARIABLE COSTS | |||
| - | Invoicing auxiliary centres | … | |
| - | Variable costs of dairy fodder production areas | … | |
| - | Purchase of feed (off-farm | … | |
| (by internal transfer | … | ||
| - | Direct labour including charges | … | |
| - | Purchase of tools | … | |
| - | Maintenance and repair of specific equipment | … | |
| - | Veterinary products and fees | … | |
| - | Livestock production costs (stud costs, check-ups) | … | |
| - | Cleaning products | … | |
| - | Energy (electricity, water, gas, steam) not invoiced by auxiliary sections | … | |
| TOTAL: FIXED COSTS + VARIABLE COSTS | … | ||
| USE | TOTAL | RESOURCES | TOTAL | ||||
|---|---|---|---|---|---|---|---|
| THIS YEAR, I USED MY RESOURCES FOR: | THIS YEAR, I GOT MY RESOURCES FROM: | ||||||
| 1) | Private purposes | 1) | Agricultural earnings | …… | |||
| - Cash withdrawals | …… | plus yearly depreciation | …… | ||||
| - Withdrawals in kind | …… | …… | |||||
| TOTAL: | …… | TOTAL: | …… | ||||
| 2) | “Exceptional” purchases and costs | 2) | Exceptional income | ||||
| - Purchase of equipment | …… | - Resale of equipment | …… | ||||
| - Other investments | …… | - Resale of other goods | …… | ||||
| - Miscellanous losses | …… | - Miscellaneous profits | …… | ||||
| - Loan repayments (capital) | …… | - Loans received | …… | ||||
| - Subsidies and other inputs | …… | ||||||
| TOTAL: | …… | TOTAL: | …… | ||||
| 3) | Increasing the value of my stocks | 3) | Decreasing the value of my stocks | ||||
| - Livestock | …… | - Livestock | …… | ||||
| - Other stocks | …… | - Other stocks | …… | ||||
| TOTAL: | …… | TOTAL: | …… | ||||
| 4) | Third parties | 4) | Third parties | ||||
| Reducing my debts and short terms | …… | Increasing my debts and short terms | …… | ||||
| - Increasing my credits | …… | - Reducing my credits | …… | ||||
| - Increasing my assets | …… | - Reducing my assets | …… | ||||
| (bank and cash on hand) | (bank and cash on hand) | ||||||
| TOTAL: | …… | TOTAL: | …… | ||||
| GRAND TOTAL OF USES: | …… | GRAND TOTAL OF RESOURCES: | …… | ||||
| AMOUNT | ||
|---|---|---|
| FIXED COSTS | ||
| - | Depreciation of section-specific equipment and buildings | … |
| - | Allocation of structural costs | … |
| VARIABLE COSTS | ||
| - | Seeds or seedlings | … |
| - | Fertilizer or manure | … |
| - | Plant protection products | … |
| - | Direct labour | … |
| - | Costs invoiced by auxiliary centres | … |
| - | Maintenance of section-specific buildings and equipment | … |
| TOTAL COSTS | ||
| TOTAL PRODUCTION IN FU | … | |
| COST PRICE OF FU | … | |
| Result | ||||
|---|---|---|---|---|
| Farmland | Labour | Numbers | HLU | |
| Kind of operation (self-owned | … | Owner | … | … |
| (rental) | … | |||
| Spouse | … | … | ||
| Type of stabling | … | Worker | ||
| Milking system | … | (permanent) | … | … |
| Yearly milk yield per cow | … | TOTAL | … | … |
| Fat content | … | Working capital | … | |
| Protein content | … | per HLU | … | … |
| Crop distribution: | Area | % cropland | % MFA | |
|---|---|---|---|---|
| Cereals | - Wheat | … | … | … |
| Barley | … | … | … | |
| Areas under fodder | … | … | … | |
| - Maize | … | … | … | |
| - Temporary grasslands | … | … | … | |
| - Natural grasslands | … | … | … | |
| Summary: | - Cereals | … | … | … |
| - MFA | … | … | … | |
| - Total cropland | … | … | … | |
Composition of herd
Summary:
| Numbers beginning end middle | Coefficient | LU | |||||
|---|---|---|---|---|---|---|---|
| Rearing calves + 2 years | … | … | … | … | … | Dairy cows | … |
| Rearing calves 1 to 2 years | … | … | … | … | … | Other bovines | … |
| Rearing calves - 1 year | … | … | … | … | … | Total LU | … |
| Dairy cows | … | … | … | … | … | LU/ha MFA | … |
These data describe the basic components of the dairy farm; it also has a geographical context and an economic climate.
| DESCRIPTION | AMOUNT | ||
|---|---|---|---|
| 1. | FIXED COSTS | ||
| - | Depreciation: | ||
| - Tractor and attachments | … | ||
| - Tractor shed | … | ||
| - Fuel storage tank | … | ||
| - Fuel pump | … | ||
| - | Tractor insurance and taxes | … | |
| 2. | VARIABLE COSTS | ||
| - | Fuel | … | |
| - | Oil | … | |
| - | Tyres | … | |
| - | Maintenance and repair costs | … | |
| (Spare parts and labour) | |||
| TOTAL COSTS (FIXED + VARIABLE) | … | ||
| TOTAL COSTS PER HOUR OF WORK (1) | … | ||
| HOURLY COST FOR DRIVER (SALARY + CHARGES) (2) | … | ||
| HOURLY COST (TRACTOR + DRIVER) (1) + (2) | … | ||
| DESCRIPTION | AMOUNT | |
|---|---|---|
| FIXED COSTS | ||
| - | Depreciations: | |
| - on buildings specific to dairy activities (stable, animal housing, milking room) | … | |
| - specific equipment. | … | |
| - | Fixed costs of dairy fodder-production areas, | … |
| - | Share of structural costs. | … |
| VARIABLE COSTS | ||
| - | Invoicing auxiliary centres | … |
| - | Variable costs of dairy fodder-production areas | … |
| - | Purchase of feed(- off-farm | … |
| (- by internal transfer | … | |
| - | Direct labour including charges | … |
| - | Purchase of tools | … |
| - | Maintenance and repair of specific equipment | … |
| - | Veterinary products and fees | … |
| - | Livestock production costs (stud costs, check-ups) | … |
| - | Cleaning products | … |
| - | Energy (electricity, water, gas, steam) not invoiced by auxiliary centres | … |
| TOTAL: FIXED COSTS + VARIABLE COSTS | … | |
![]()
![]()
![]()