![]()
![]()
![]()
Forests are recognized as an integral part of national economies, providing a wide range of production inputs, environmental goods, food, fuel, medicines, household equipment, building material and raw materials for industrial processing. Forests support agriculture by providing materials for farm implements, harvesting and transportation equipment, crop storage containers and dryers as well as fuel for crop processing. However, these multiple benefits and services are valued differently by different people. Moreover, local, national and international interests also differ. For a number of reasons, the roles that forests are expected to play in local, national and global development change dramatically over time.
Roads, commerce and agrarian populations have penetrated and settled on much of the world's forest land; few forest areas remain disconnected from national interests. Forest areas have undergone ‘agrification’, involving the use of forests and trees in farming systems and the formation of agricultural mosaics within forest systems. Forests are increasingly managed for their range of products and services, their ability to support rural well-being and their capacity to promote industrial opportunities. Forests provide large, albeit different, ranges of goods and services for virtually all patterns of human settlement and livelihood. They are not just contiguous blocks of timber, but are active parts of life everywhere.
Economic development strategies increasingly recognize the capital values of forests in national policies and programmes that modify forest stocks, qualities and distributions. Forests are now widely acknowledged as both productive capital stocks and as components of public infrastructural systems. As ecological analogues of industrial capacity and physical infrastructure, forests are entering the central equations of macro-economic growth, often with new definitions of what the forest is and does.
Conventional national accounting systems overstate sustainable income in two ways. First, the accounts disregard depreciation of forest and other natural capital. Second, the costs of mitigating or offsetting the side-effects of resource depletion (e.g. anti-sedimentation measures in a deforested watershed) are not subtracted from national income.8 This conveys the wrong message: that income gained from depleting forest resources can continue forever.9
Advances in national accounting make it possible to incorporate explicitly the capital value of forest resources as productive stocks, and to assess the effects of changes in them on national productive capacity. Some countries are establishing new accounting systems that measure the depreciation of forest resources due to cutting in excess of their reproductive capacity and their appreciation due to reforestation, regeneration and growth. For instance, the French system shows trade-offs between the economic, ecological and social functions of natural resources. This system, known as the ‘natural patrimony accounts’, records separate accounts for forests, wildlife, water and soil.
Forest systems provide services that, in their absence, would require capital expenditures or reductions in human well-being. For example, by storing water, regulating flows, protecting channels and cleansing impurities, forests form a structure of hydrological services akin to structures for transportation and communication. Recent economic methods make it possible to account for these infrastructural services on a national scale.
Forests represent productive assets that are used as a means for attaining national development objectives, including equity, stability, investment and growth. Programmes in community forestry have become central to rural development programmes that seek to build more productive relations between rural communities and publicly-owned natural resources. Community forestry programmes are widely implemented to strengthen investment incentives and encourage civic participation in the growth and use of forests and trees.
Forests have emerged as significant factors in economic and political relations among nations. For example, forests have taken on foreign policy dimensions through their association with issues concerned with trade and the environment. Forest conditions increasingly affect national dependence on international trade and on processing capacity for wood products and production inputs. Trading patterns grow more complex as wood-exporting nations shift emphasis from primary to secondary and tertiary forms of production, increase their purchasing power and diversify their consumption requirements.
Changes in the extent and quality of forests have become the subject of global environmental concerns: changing forest conditions raise concerns over biological diversity and global climate change. These developments create pressure on national governments to consider forests in the realm of international relations. Some nations are already moving towards international agreements that tie matters of economic and environmental trade together in the service of larger, global interests.
For all of these reasons, national forest politics and policies have evolved out of a narrow sectoral prerogative to enter the pluralized mainstream of political interests involving highly diverse groups. The perspectives and demands of these politically diverse groups have proliferated, placing a significant strain on the institutions of forest policy that evolved when forests meant only timber belonging to the state and were controlled by a small professional cadre. These competing pressures, combined with a wider understanding of the importance and complexity of forests' non-wood services and values, are strongly influencing forestry policy today.
Individual forest ecosystems provide many protective, scientific and commercial services, ranging from living space and food to climate regulation and genetic resources. At the national level, however, countries are interested in their entire forest system and how they contribute collectively to national development as sources of goods and services, as forms of insurance against excessive risk and as economic and social assets.
Sources of revenue, foreign exchange and financial equity
Forests supply materials for domestic industry, for export and for import substitution in the form of wood, fibre, processed products, energy and a wide variety of medicinal, ornamental and speciality forest products.
Timber typically has been a primary source of capital for forested nations, through the trade of wood for currency, the use of forests as equity for loans and debt relief and the exchange of concessionary rights for physical infrastructure. Canada, Côte d'Ivoire, India, Indonesia, Malaysia, Norway, Sweden, the Russian Federation, Thailand and the United States, among many other countries, have relied on the transformation of forest capital to help build their industrial and agricultural capacities; Laos, Myanmar and Viet Nam appear to be pursuing a similar strategy today.
Beyond this initial stage of forest transformation, some nations attempt to create employment and increase incomes by building industrial capacities to process wood into finished goods. Finland, Germany, Indonesia, Italy, Malaysia, Singapore, Thailand and the United States have followed this path, using wood from both domestic and foreign sources. Thailand derives substantial foreign exchange from trade in furniture, orchids, speciality foods, medicinals and wildlife. This stage requires more complex market and tenure systems than those that prevailed when timber was the forest's main contribution. Japan's forest industries rely heavily on imports of tropical and temperate hardwood and coniferous logs; the country accounts for 30 percent of global industrial roundwood imports and about 45 percent of all tropical hardwood imports. Although Japan's own forests are capable of providing for industrial production, economic and environmental considerations and high extraction costs mean a preference for imports.10
Forests also attract recreational users. Since tourism and recreation may require infrastructural investment beyond the requirements of a processing industry, this economic activity usually awaits later stages of industrial and commercial growth.
Thus, nations must make strategic trade-offs between converting forest capital for industrial and commercial activities, providing access to non-timber products, using forests as energy sources, and increasing future income streams from tourists attracted to pristine forests.
Sources of rural income
Rural populations depend on the products of forests as well as on their environmental services. Forests contribute to food security in many ways. In many developing countries, forests are a primary source of energy, protein, oils, medicines and staple foods for a significant proportion of the rural population and, more importantly, for the most vulnerable among them. In general, forests are most important for food during seasonal or periodic famines or shortages of crop-based foods. At least three-quarters of the world's people depend largely on folk medicine. Brazil has recorded at least 3 000 medicinal plants, India more than 2 000 and Malaysia some 1 000.
As sources of income, forests are important in a distributive sense, creating opportunities that cannot be generated on a national scale or through incipient market systems. National accounts typically do not record such in-kind forest incomes, although these are essential to the well-being of hundreds of millions of people (especially those groups who depend on the forest as their only source of cash income).
Rural populations also use, protect and create forests as sources of agricultural inputs; they depend on tree products to sustain soil fertility and structure, to feed livestock and to maintain desired moisture regimes and water flows.
Such non-monetized production inputs are not recorded in national accounts, although their decline would reduce monetized production, require compensation through augmented monetized inputs of capital and labour or increase pressure to clear forest for cultivation.
At early stages of market participation, rural populations use commercial forest products to generate cash income. For instance, India has extensive commerce in ‘minor’ forest products which resident communities harvest, process and sell. Examples include silk, cigarette wrappers, food and feed, charcoal, oils, lac and resins, spices and medicines.
Shares of national assets
Forest tenures have become part of broader strategies designed to distribute national assets to achieve a desired mix of economic growth, equity and stability and to conserve environmental opportunities for future generations.
Tenurial patterns have diversified over the past several decades, reflecting the variety of forest functions, growing populations and political expectations, and expanding technical, financial and organizational capacities. To pure de jure state ownership, or de facto local control, have been added a wide variety of quasi-public structures of land and market control. These include systems of state-local cooperative management, local management structures and private tenures for forest activities on corporate, farm and household scales. Forest distribution therefore involves choices within and among fiscal, educational, industrial, agrarian and stabilization policies.
Ecological systems providing biodiversity
The world's forests are both laboratories for the natural selection of genetic resources of plants and animals and dynamic storage banks for these genes. Tropical forests are considered to contain more than 50 percent of all the living species on the planet, including a great proportion of higher plants and mammals. For example, there are 50 indigenous tree species in Europe north of the Alps. In Malaysia, an area of forest covering just 50 ha was found to contain 830 tree species and, in Peru, nearly 300 species of trees have been recorded on a single hectare.
Infrastructure
Forests provide infrastructural services without which development opportunities decline. They stabilize streamflow and microclimates, protect land and earth structures such as roads and canals, drain and shade the land, and purify the atmosphere. Urban trees cool towns, conserve energy and absorb pollutants, substituting for more conventional infrastructure which would otherwise be needed. Strategically placed trees can reduce home air-conditioning needs by 10 to 15 percent by providing shade, and can reduce heating requirements by shielding wind.
The economic and social consequences of changes in forests ecosystems are difficult to predict. Changes in the dynamics of river basins, ecological regions or wildlife systems, for example, may reduce or increase different aspects of human well-being; without sufficient knowledge, the unpredictability of the consequences tends to rise with the extent of change. The inundation carrying logs through Thai villages, boulders falling on to Nepalese villages, and habitat-deprived elephants rampaging through Indian villages are recent examples of catastrophes that well-managed forests can prevent.
Although the concept of ‘forest as infrastructure’ is not yet widely supported, the absence of forests clearly requires constructed infrastructure at the expense of other potential uses of scarce capital.
Sources of energy
Forests supply energy that would otherwise be unavailable or would cost more to obtain. Wood continues to be the primary fuel in most tropical nations and a significant fuel in many others. Wood may substitute for fossil fuels and agricultural biomass, alleviating cost pressures on competing needs for these resources.
Nutritional problems arise where people lack sufficient fuelwood to cook their food adequately and where its substitution with dung reduces the fertility and productivity of their fields. Fossil fuel replacements, whether for energy or fertilizer, can be expensive in foreign exchange or in lost future opportunities for domestic use. Energy policies in nations of South Asia and Africa have placed significant emphasis on fuelwood plantations.
Sources of potentially tradable global services
Forests supply many global benefits: they store carbon; maintain diverse, unique and rare forms of life; store biotic potential; and encompass natural phenomena that have yet to be understood. These global attributes are gaining value rapidly as institutions evolve to protect them and develop means to translate them into tradable forms. The Global Environmental Facility (GEF) was established to finance national provision of such services.
Debt-for-nature swaps, long-term purchases of forest carbon storage for industrial atmospheric emissions, environmental conditions in trade agreements and international contracts for biological prospecting rights are early examples of the gradual development of international trade in global environmental services.
Cultural heritage
In recent years, forests have become more widely recognized as homes of cultures. International concern and appreciation for the value of traditional cultures and their knowledge of nature have contributed to the preservation of forest regimes and increased attention to the needs of forest dwelling communities as a matter of national interest.
The many conventional economic contributions of forests are well documented, particularly the value of wood energy and solid wood and fibre products. The annual value of fuelwood and wood-based forest products to the global economy is estimated to be more than US$ 400 000 million, or about 2 percent of GDP (see Table 2 on page 24). In the developing countries, fuelwood accounts for US$70 000 million and forest industry products for US$ 63 000 million. Estimates for the developed countries are US$26 000 million for fuelwood and US$259 000 million for wood products.
Table 1
Forest products in the economy, 1991 (US$ million)
| production | percent of GDP | imports | exports | percent of trade | consumption | |
|---|---|---|---|---|---|---|
| World | 417 665 | 2 | 107 613 | 98 050 | 3 | 427 228 |
| Africa | 24 552 | 6 | 4 333 | 1 562 | 2 | 27 322 |
| Algeria | 139 | 0 | 348 | 0 | 0 | 487 |
| Angola | 284 | 4 | 8 | 0 | 0 | 292 |
| Benin | 205 | 11 | 2 | 0 | 0 | 206 |
| Botswana | 57 | 2 | 0 | - | - | 57 |
| Burkina Faso | 351 | 11 | 5 | 0 | 0 | 357 |
| Burundi | 163 | 15 | 5 | - | - | 169 |
| Cameroon | 690 | 6 | 120 | 201 | 15 | 610 |
| Central African Republic | 149 | 12 | 0 | 15 | 20 | 134 |
| Chad | 179 | 15 | 4 | - | - | 183 |
| Congo | 188 | 7 | 2 | 129 | 16 | 62 |
| Côte d'Ivoire | 698 | 9 | 28 | 278 | 10 | 448 |
| Egypt | 280 | 1 | 2 730 | 0 | 0 | 3 010 |
| Equatorial Guinea | 39 | 4 | - | 19 | 42 | 20 |
| Ethiopia | 1 703 | - | 4 | 0 | 0 | 1 707 |
| Gabon | 271 | 6 | 6 | 226 | 12 | 52 |
| Gambia | 35 | 12 | 0 | - | - | 35 |
| Ghana | 729 | 12 | 11 | 93 | 9 | 647 |
| Guinea | 180 | 6 | 1 | 1 | 0 | 180 |
| Guinea-Bissau | 28 | 6 | 0 | 2 | 8 | 26 |
| Kenya | 1 508 | 19 | 24 | 4 | 0 | 1 529 |
| Lesotho | 23 | - | 5 | - | - | 28 |
| Liberia | 331 | - | 3 | 78 | 31 | 255 |
| Libyan Arab Jamahiriya | 32 | 0 | 52 | - | - | 84 |
| Madagascar | 358 | 13 | 3 | 2 | 1 | 359 |
| Malawi | 340 | 15 | 8 | 0 | 0 | 348 |
| Mali | 231 | 9 | 2 | - | - | 233 |
| Morocco | 239 | 1 | 239 | 3 | 0 | 475 |
| Mozambique | 642 | - | 5 | 1 | 0 | 646 |
| Niger | 203 | 8 | 5 | 0 | 0 | 208 |
| Nigeria | 4 667 | 16 | 98 | 11 | 0 | 4 754 |
| Reunion | 1 | 0 | 55 | - | - | 56 |
| Rwanda | 219 | 13 | 6 | - | - | 224 |
| Sao Tome and Principe | 1 | 0 | 0 | 0 | 0 | 1 |
| Senegal | 217 | 4 | 31 | - | - | 248 |
| Sierra Leone | 124 | 14 | 2 | 0 | 0 | 126 |
| Somalia | 276 | - | 1 | 0 | 0 | 277 |
| South Africa | 2 710 | 3 | 232 | 381 | 2 | 2 561 |
| Sudan | 967 | 13 | 9 | - | - | 976 |
| Swaziland | 132 | 20 | 1 | 75 | 13 | 57 |
| Tanzania, United Republic | 1 427 | - | 13 | 3 | 1 | 1 437 |
| Togo | 53 | 3 | 5 | 0 | 0 | 59 |
| Tunisia | 209 | 1 | 183 | 9 | 0 | 382 |
| Uganda | 674 | 23 | 2 | 0 | 0 | 676 |
| Zaire | 1 619 | 21 | 9 | 24 | 3 | 1 604 |
| Zambia | 556 | 17 | 6 | 0 | 0 | 562 |
| Zimbabwe | 421 | 8 | 19 | 8 | 0 | 433 |
| North/Central America | 133 391 | 2 | 16 907 | 29 624 | 5 | 120 674 |
| Belize | 8 | 2 | 5 | 2 | 1 | 11 |
| Canada | 30 482 | 5 | 1 840 | 16 931 | 13 | 15 391 |
| Costa Rica | 248 | 5 | 81 | 22 | 1 | 307 |
| Cuba | 276 | 1 | 193 | 2 | 0 | 467 |
| Dominican Republic | 41 | 1 | 85 | 0 | 0 | 126 |
| El Salvador | 200 | 3 | 22 | 3 | 0 | 219 |
| Guatemala | 323 | 3 | 70 | 19 | 2 | 373 |
| Haiti | 216 | 9 | 10 | 0 | 0 | 226 |
| Honduras | 281 | 9 | 136 | 31 | 3 | 386 |
| Jamaica | 14 | 0 | 67 | 0 | 0 | 81 |
| Mexico | 3 546 | 1 | 676 | 133 | 0 | 4 089 |
| Nicaragua | 173 | - | 7 | 3 | 1 | 177 |
| Panama | 103 | 2 | 56 | 1 | 0 | 158 |
| Trinidad and Tobago | 10 | 0 | 54 | 0 | 0 | 64 |
| United States | 97 470 | 2 | 13 467 | 12 478 | 3 | 98 459 |
| South America | 23 729 | 3 | 1 110 | 2 633 | 3 | 22 206 |
| Argentina | 1 511 | 2 | 102 | 193 | 2 | 1 420 |
| Bolivia | 71 | 2 | 4 | 30 | 4 | 45 |
| Brazil | 16 369 | 4 | 247 | 1 472 | 5 | 15 144 |
| Chile | 2 233 | 8 | 77 | 836 | 9 | 1 474 |
| Colombia | 1 304 | 3 | 129 | 17 | 0 | 1 416 |
| Ecuador | 691 | 7 | 163 | 26 | 1 | 828 |
| French Guiana | 8 | 2 | 2 | 4 | 6 | 6 |
| Guyana | 4 | 1 | 1 | 4 | 1 | 1 |
| Paraguay | 341 | 6 | 21 | 28 | 4 | 334 |
| Peru | 398 | 1 | 109 | 4 | 0 | 503 |
| Suriname | 13 | 1 | 3 | 1 | 0 | 15 |
| Uruguay | 216 | 3 | 30 | 17 | 1 | 229 |
| Venezuela | 571 | 1 | 221 | 0 | 0 | 792 |
| Asia | 108 178 | 2 | 26 894 | 12 336 | 2 | 122 736 |
| Afghanistan | 329 | 6 | 1 | - | - | 330 |
| Bangladesh | 1 257 | 6 | 33 | 0 | 0 | 1 290 |
| Bhutan | 63 | 22 | 0 | 10 | 11 | 53 |
| Brunei Darussalam | 21 | 2 | 17 | 0 | 0 | 39 |
| Cambodia | 288 | - | 0 | 18 | 43 | 270 |
| China | 29 316 | 8 | 3 904 | 829 | 1 | 32 392 |
| Cyprus | 7 | 0 | 85 | 0 | 0 | 92 |
| Hong Kong | 151 | 0 | 1 936 | 861 | 1 | 1 226 |
| India | 15 227 | 5 | 399 | 39 | 0 | 15 587 |
| Indonesia | 11 869 | 10 | 295 | 3 601 | 12 | 8 563 |
| Iran, Islamic Republic | 723 | 1 | 467 | 0 | 0 | 1 190 |
| Iraq | 19 | 0 | 117 | - | - | 136 |
| Israel | 162 | 0 | 405 | 26 | 0 | 541 |
| Japan | 27 184 | 1 | 12 453 | 2 139 | - | 37 497 |
| Jordan | 13 | 0 | 56 | 9 | 1 | 60 |
| Korea, DPR | 275 | 1 | 5 | 1 | 0 | 279 |
| Korea, | ||||||
| Republic | 4 279 | 2 | 2 612 | 506 | 1 | 6 385 |
| Laos | 173 | 15 | 1 | 16 | 21 | 158 |
| Lebanon | 71 | 3 | 41 | 0 | 0 | 112 |
| Malaysia | 4 683 | 10 | 499 | 3 120 | 9 | 2 061 |
| Mongolia | 143 | 5 | 1 | 0 | 0 | 144 |
| Myanmar | 933 | 8 | 5 | 148 | 35 | 790 |
| Nepal | 802 | - | 4 | 0 | 0 | 806 |
| Pakistan | 1 408 | 3 | 153 | 0 | 0 | 1 561 |
| Philippines | 1 890 | 4 | 161 | 94 | 1 | 1 956 |
| Singapore | 266 | 1 | 964 | 643 | 1 | 597 |
| Sri Lanka | 375 | 4 | 76 | 0 | 0 | 451 |
| Syrian Arab Republic | 12 | 0 | 53 | 0 | 0 | 65 |
| Thailand | 2 613 | 3 | 1 210 | 136 | 0 | 3 687 |
| Turkey | 2 274 | 2 | 385 | 48 | 0 | 2 612 |
| Viet Nam | 1 348 | 9 | 13 | 93 | 5 | 1 267 |
| Europe | 83 934 | 1 | 55 965 | 47 567 | 3 | 92 331 |
| Albania | 174 | 4 | 2 | 1 | 0 | 175 |
| Austria | 4 239 | 2 | 1 558 | 3 285 | 8 | 2 512 |
| Belgium/Luxembourg | 1 817 | 1 | 3 451 | 1 926 | 2 | 3 342 |
| Bulgaria | 578 | 3 | 101 | 45 | 1 | 634 |
| Former Czechoslovakia | 2 308 | 7 | 106 | 427 | 4 | 1 987 |
| Denmark | 584 | 0 | 1 766 | 417 | 1 | 1 933 |
| Finland | 8 959 | 7 | 512 | 8 238 | 36 | 1 233 |
| France | 9 328 | 1 | 6 152 | 3 842 | 2 | 11 638 |
| Germany | 16 703 | - | 12 567 | 6 819 | 2 | 22 451 |
| Greece | 447 | 1 | 999 | 100 | 1 | 1 346 |
| Hungary | 662 | 2 | 339 | 135 | 1 | 865 |
| Ireland | 185 | 0 | 467 | 136 | 1 | 516 |
| Italy | 4 942 | 0 | 6 166 | 1 818 | 1 | 9 289 |
| Netherlands | 2 201 | 1 | 4 399 | 2 433 | 2 | 4 167 |
| Norway | 2 400 | 2 | 708 | 1 517 | 4 | 1 592 |
| Poland | 2 338 | 4 | 127 | 250 | 2 | 2 214 |
| Portugal | 1 972 | 3 | 738 | 1 209 | 7 | 1 501 |
| Romania | 1 570 | 5 | 80 | 171 | 4 | 1 479 |
| Spain | 4 372 | 1 | 2 784 | 1 120 | 2 | 6 036 |
| Sweden | 10 756 | 4 | 1 168 | 9 873 | 18 | 2 051 |
| Switzerland | 1 570 | 1 | 2 136 | 1 283 | 2 | 2 423 |
| United Kingdom | 4 222 | 0 | 8 853 | 1 727 | 1 | 11 348 |
| Former Yugoslavia, SFR | 1 609 | 2 | 689 | 795 | 7 | 1 503 |
| Oceania | 5 395 | 2 | 1 477 | 1 553 | 3 | 5 319 |
| Australia | 2 980 | 1 | 1 216 | 471 | 1 | 3 724 |
| Fiji | 41 | 3 | 16 | 48 | 13 | 10 |
| New Caledonia | 1 | 0 | 10 | - | - | 11 |
| New Zealand | 1 971 | 5 | 212 | 885 | 10 | 1 298 |
| Papua New Guinea | 361 | 11 | 5 | 114 | 7 | 253 |
| Samoa | 7 | 4 | 1 | 0 | 0 | 8 |
| Solomon Islands | 32 | 16 | 1 | 35 | 42 | 2 |
| Vanuatu | 3 | 2 | 0 | 1 | 5 | 2 |
| Yemen | 12 | - | 10 | 0 | 0 | 22 |
| Former USSR | 38 485 | 2 | 927 | 2 773 | 4 | 36 639 |
| TOTAL DEVELOPED COUNTRIES | 285 377 | 1 | 86 716 | 83 652 | 4 | 288 441 |
| TOTAL DEVELOPING COUNTRIES | 132 289 | 4 | 20 897 | 14 398 | 2 | 138 787 |
Table 2
Annual value of fuelwood and wood-based
products to the global economy (US$ '000 million)
| forestry | industry | total | GDP* (percent) | |
|---|---|---|---|---|
| developing countries | 70 | 63 | 133 | 4.1 |
| developed countries | 26 | 259 | 285 | 1.4 |
| world | 96 | 322 | 418 | 1.8 |
* gross domestic product (percent)
The real value of the forestry sector's contribution has increased over the last 3 decades at an average annual rate of 2.5 percent. Growth of the value of energy from the forest in developing countries has averaged 2.5 percent while the value of wood in energy has declined in developed countries. The forest industry has averaged 3 percent growth world wide, but at a rate of 6 percent for developing countries.
No comparable global estimate is available for non-wood services and benefits of forests, but some country estimates do exist. An FAO study of non-wood forest product use in Greece, Italy, Morocco, Spain, Tunisia and the coastal zones of France and Algeria indicate that Mediterranean trade in cork, resin, mastic gum, honey, mushrooms, wild fruit and wild game, added to the value of trees used in livestock production, had an estimated value of more than US$1 000 million in 1992.11 The export of rattan by Southeast Asian countries is approximately $300 million per year, and exports of gum arabic by Sudan is around US$70 million per year.
FAO estimates that the forestry sector provides subsistence and wage employment equivalent to 60 million work years world-wide, 80 percent of which is in developing countries.12 Much of this is in fuelwood and charcoal related activities. An estimated 3 000 million people depend on fuelwood as their main source of household energy, consuming more than one-half of the world's wood production. In many urban areas of developing countries, families may spend 20 to 30 percent of their income on fuelwood and charcoal.13 In 1992, global wood consumption included 1 870 million m3 of fuelwood and 1 600 million m3 of industrial roundwood.
Global per caput consumption of forest products has increased by nearly 1 percent per year over the past three decades. Between 1961 and 1991, the value of global wood consumption more than doubled in real terms, growing by an average of 2.7 percent per year. During the same period, global roundwood production increased by 75 percent, fuelwood nearly doubled and industrial roundwood increased by 50 percent. Among processed products, sawnwood increased by 20 percent, wood panels by 600 percent and paper by 350 percent. Three countries, Canada, the Russian Federation and the United States, account for more than one-half of all the world's industrial roundwood production.
These substantial increases in the volume of wood-based products have been achieved with a relatively small increase in industrial roundwood production. This is explained by improved efficiency in sawnwood and plywood production, the recovery of wood residues for the manufacture of other wood-based panels and in paper manufacture, and increased recycling of used paper in paper manufacture. In addition, wood residues make important contributions as a fuel source, improving energy efficiency in many wood industries.
The developed countries consume most of the world's sawnwood and wood-based panels (300 m3 per 1 000 people per year for housing and furniture) and paper (150 tonnes per 1 000 people per year for communications, packaging and hygiene). Average annual developing country consumption of sawnwood and wood-based panels is 30 m3 per 1 000 people and consumption of paper is 12 tonnes per 1 000 people.
11 FAO. 1993. More than wood. FAO Forestry Topics Report No. 4. Rome.
12 FAO. Agriculture towards 2010. (in press).
In developing countries, 80 percent of wood is consumed as fuel. Fuelwood accounts for 58 percent of energy use in Africa, 15 percent in Latin America and 11 percent in Asia. In more than 40 countries and in many of the least-developed countries, wood is the source of more than 70 percent of national energy consumption. Wood supplies the basic energy needs in communities where people lack access to, or cannot afford, alternative fuels; where wood supply is scarce, twigs and leaves may be used.
About one-quarter of global timber production enters into international trade. Exports have currently reached about $98 000 million, representing about 3 percent of world merchandise trade (see Table 3). Trade in wood-based products is growing more rapidly than production. The developed countries dominate trade flows, accounting for more than 80 percent of total trade. Moreover, trade is concentrated in a handful of countries: the top five importers, United States, Germany, Japan, United Kingdom and Italy, accounted for 50 percent of world imports; the top five exporters, Canada, United States, Sweden, Finland and Germany, accounted for more than 50 percent of world exports. Brazil, Indonesia and Malaysia account for 10 percent of world exports and 50 percent of developing country exports.
Table 3
Value of exports of wood-based products (US$ '000 million)
| total | trade* (percent) | |
|---|---|---|
| developing countries | 14 | 1.9 |
| developed countries | 84 | 3.5 |
| world | 98 | 3.1 |
For several major exporters, forest products are an important component of their external trade; in the case of Cambodia, the Central African Republic, Equatorial Guinea, Finland, Laos, Liberia, Myanmar and the Solomon Islands, timber products exceed 20 percent of total exports; in the case of Canada, Cameroon, Congo, Côte d'Ivoire, Gabon, Fiji, Finland, Indonesia, Malaysia, New Zealand, Swaziland and Sweden, they exceed 10 percent. Canada exports almost 50 percent of its production.
Other countries are heavily dependent on imports. This is particularly the case with paper; some 80 developing countries depend on paper imports for more than half of their supply. Even the United States, which is the world's largest producer and second largest exporter of forest products, is also the largest importer of forest products.
An important trade feature among the developing countries has been the increase in manufactured products as a share of their total exports. In 1961, 54 percent of export value was unprocessed roundwood while, by 1992, this proportion had dropped to 20 percent of a much larger total.
While tropical timber accounts for only a small portion of world trade and of total timber production, it is significant in a number of countries. In Malaysia, the export of sawnwood and wood-based panels accounted for more than 60 percent of production in 1991 and 1992. Indonesia exports more than 80 percent of its wood-based panels and plywood. Other countries with high export shares include the Congo, Côte d'Ivoire, Gabon, Ghana, Liberia and Papua New Guinea.
Around 80 percent of industrial roundwood from tropical countries is imported by four Asian countries—China, Japan, Thailand and the Republic of Korea. Japan is the single largest importer, accounting for 45 percent of imports in 1992.
The outlook for forestry development is increasing demand for products and services and, at the same time, intensifying competition for the use of forest land. As a source of energy, forests will continue to play a major role for many developing countries, although the overall growth of their total energy consumption will be much faster that the growth of wood used for energy. The annual growth in fuelwood and charcoal consumption in the developing countries is expected to be approximately 1.6 percent from 1990 through 2010 (see Table 4). The world's industrial roundwood consumption is projected to grow by about 2.5 percent during the period 1990–2010: a 3.8 percent growth rate in developing countries and 2 percent in the developed countries.
Table 4
Current and projected consumption of forest products (1990–2010)
| 1990 | growth (1990–2010) | 2010 | |||||||
|---|---|---|---|---|---|---|---|---|---|
| *m3 or †tonnes (million) | percent | *m3 or †tonnes (million) | |||||||
| world | developed | developing | world | developed | developing | world | developed | developing | |
| fuelwood and charcoal* | 1 800 | 240 | 1560 | 1.4 | 0.8 | 1.6 | 2 400 | 280 | 2 120 |
| industrial roundwood* | 1 650 | 1 270 | 380 | 2.5 | 2.0 | 3.8 | 2 700 | 1 900 | 800 |
| sawnwood* | 485 | 373 | 112 | 2.5 | 1.5 | 4.1 | 790 | 500 | 250 |
| panels† | 125 | 108 | 17 | 4.6 | 4.3 | 6.5 | 310 | 250 | 60 |
| paper† | 238 | 196 | 42 | 3.1 | 2.3 | 5.8 | 440 | 310 | 130 |
Extensive and reliable quantitative and qualitative knowledge about forests and ecosystems are indispensable for today's foresters, policy-makers and scientists. This information is required to develop appropriate strategies and programmes to conserve and manage this important renewable natural resource. It is also the only way to monitor global trends in forest cover and the supply of goods and services forests provide.
FAO's first forest assessment, the 1947 World Forest Inventory, focused on industrial wood production capacity. Over time, new concerns emerged and the need to evaluate forests for their many other values became more apparent. Subsequent FAO global forest assessments continued to cover industrial wood production capacity but also attempted to capture information about fuelwood resources (1970s) and tropical deforestation (1980s). FAO's most recent resource assessment describes the state of forests in 1990 and assesses changes during the 1980s, including forest fragmentation, logging intensity, biomass conditions and plantations (1990s).14
The 1990 assessment estimates world forest area to be 3 442 million ha: 27 percent of the earth's area or 0.64 ha per caput. FAO's definition of forests includes ecological systems with a minimum of 10 percent crown coverage of trees. In addition to areas classified as forests, 1 700 million ha contain woody vegetation, shrubs, scrub and forest fallow. These woodlands often have forest characteristics but do not meet the minimum tree cover definition of open or closed forests.
The quantity of biomass provides a broad indication of the forest's potential for wood fibre supply (for products and energy use) and its significance in the carbon cycle. Existing estimates of woody biomass are still rough and are only indicative. The knowledge base is improving quickly, however. Current estimates place total above-ground woody biomass at 440 500 million oven dry tonnes. These estimates suggest that 70 percent of the world's woody forest biomass is located in the tropical zone, highlighting the important role tropical forests play in carbon storage. Brazil accounts for 25 percent of the woody biomass with 16 percent of the world's forest area, while the former USSR accounts for 12 percent of the woody biomass with 22 percent of the forests.
The regional distribution of world forest cover is presented in Table 5 on page 28. Three countries and the former USSR account for more than 50 percent of the world's forest area: the former USSR (22 percent), Brazil (16 percent), Canada (7 percent) and the United States (6 percent). Latin America and the Caribbean is the most forested region with 48 percent of its land area covered with natural forests and plantations. Africa and the developing countries of Asia have a much lower relative forest cover (18–19 percent). In Europe and North America, forest cover is about the world average, while it is higher in the former USSR (35 percent), highest in Japan (64 percent) and lowest in Australia (5 percent).
Per caput forest area varies greatly between regions ranging from more than 2 ha in tropical Latin America and the Caribbean, to around 0.15 ha in non-tropical developing countries and in the developing countries of Asia and the Pacific. Some countries in the tropical wet zone (French Guyana, Gabon, Guyana and Suriname) have more than 15 ha per caput.
Table 5
Total forest area related to land area and population
| region | land (million ha) | forest (million ha) | forest cover as a percentage of total land | forest (ha/cap) | other wooded land (million ha) | forest and other wooded land (million ha) |
|---|---|---|---|---|---|---|
| Europe | 550 | 149 | 27 | 0.26 | 46 | 195 |
| former USSR | 2 139 | 755 | 35 | 2.15 | 187 | 941 |
| North America | 1 835 | 457 | 25 | 1.65 | 293 | 749 |
| Pacific (developed) | 818 | 71 | 8 | 0.51 | 106 | 178 |
| Africa | 2 964 | 545 | 18 | 0.85 | 591 | 1 137 |
| tropical | 2 237 | 529 | 24 | 1.09 | 554 | 1 083 |
| non-tropical | 727 | 16 | 2 | 0.10 | 38 | 52 |
| Asia and the Pacific region | 2 613 | 497 | 19 | 0.17 | 163 | 660 |
| tropical | 901 | 338 | 38 | 0.21 | 115 | 453 |
| non-tropical | 1 712 | 159 | 9 | 0.11 | 48 | 207 |
| Latin America and the Caribbean countries | 2 016 | 967 | 48 | 2.16 | 292 | 1 260 |
| tropical | 1 650 | 924 | 26 | 2.31 | 267 | 1 191 |
| non-tropical | 366 | 43 | 12 | 0.89 | 25 | 68 |
| developing countries | ||||||
| tropical | 4 788 | 1 791 | 37 | 0.73 | 935 | 2 726 |
| non-tropical | 2 806 | 218 | 7 | 0.13 | 111 | 329 |
| total developed | 5 342 | 1 432 | 27 | 1.07 | 631 | 2 064 |
| total developing | 7 594 | 2 009 | 26 | 0.50 | 1 047 | 3 056 |
| grand total | 2 936 | 3 442 | 27 | 0.64 | 1 678 | 5 120 |
Figure 1
Forest and other wooded land (components, 1980–90)
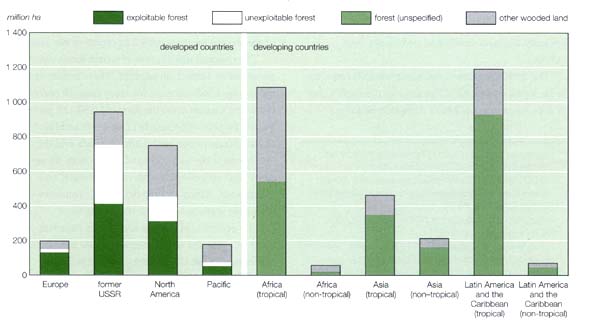
Table 6
Forest cover state and change by ecological zone for tropical countries
| ecological zone | land (million ha) | natural forest (million ha) | natural forest cover as a percentage of total land | deforestation 1980–1990 percent/year |
|---|---|---|---|---|
| wet | 935 | 715 | 77 | 0.6 |
| moist deciduous | 1 294 | 591 | 46 | 1.0 |
| dry and very dry | 1 241 | 238 | 19 | 0.9 |
| hill and mountain zone | 719 | 203 | 28 | 1.1 |
| desert | 589 | 8 | 1 | 1.0 |
| total tropical countries | 4 778 | 1 756* | 37 | 0.8 |
* excludes some small tropical countries
The tropical zone contains 1 790 million ha of forests: 37 percent of the land area and 0.73 ha per caput. The tropical zone may be divided into six ecofloristic zones: the tropical rain forests, the moist deciduous forests, the dry zone, the very dry zone, the desert zone and the hill and mountain forests. About three-quarters of the tropical forest is in the tropical rainforest and the moist deciduous forest zones. Dry lowland formations and upland formations each constitute about 12 to 13 percent of the total tropical zone forest.
Table 6 shows that 77 percent of the land area in the wet zone is still covered with natural forest. The corresponding percentages are 46 in the moist deciduous, 19 in the dry and very dry and 29 in the hill and mountain forest zones. The entire wet zone (commonly referred to as the tropical rain forest zone) and the moist zone are assumed to have been completely forested. In the heterogeneous hill and mountain zone, it is assumed that the original forest cover was slightly less. A corresponding estimate for the dry and very dry zone is difficult to make.
Deforestation and degradation are major tropical forest issues. For the 1980–90 period, the annual estimated loss in natural forest area is 12.1 million ha (0.8 percent in tropical and 0.5 percent in non-tropical developing countries). The rates, causes and effects of deforestation differ greatly between countries and regions. These differences are due to population density and growth rates, the extent and quality of forest resources, levels and rates of development, the structure of property rights and cultural systems. In the assessment of the tropical forest resources, a high correlation has been found between the change in the forest area and the change in population density. According to the model used, the process of population/forest interaction resembles a biological growth process where deforestation is observed to increase relatively slowly at initial stages of increases in population density, much faster at intermediate stages and slowly in the final stages.
The exact nature of the relationship varies between ecological zones. The lowest annual deforestation rate is observed in the wet zone. Deforestation rates are much higher in the moist, dry and hill and mountain zones. These zones have more favourable conditions for agriculture and high population pressure.
Recent estimates suggest that nearly two-thirds of tropical deforestation worldwide is due to farmers clearing land for agriculture.15 The largest losses of forest area are taking place in the tropical moist deciduous forests, the zone best suited for human settlement and agriculture. In the decade 1980 to 1990, an estimated 61 million ha were deforested, more than 10 percent. The proportion of moist deciduous area still forested is 46 percent (only 29 percent in Asia). In contrast, 76 percent of the world's rain forest zone is still covered in forest. During the past decade, the total area of rain forest cut was 46 million ha.
The FAO/ECE Forest Resources Assessment 1990 is studying changes in forest area in the industrial countries. While the data are incomplete, the emerging picture demonstrates a net gain in area of forest and other wooded land in Europe of nearly 2 million ha during the 1980s; small increases in New Zealand and Australia, and a net decrease of 3.2 million ha in the United States. The former USSR reported a net increase in forest and other wooded land of 22.6 million ha between 1978 and 1988, principally as a result of natural regeneration and planting and sowing on agricultural and other non-forest land, e.g. for shelterbelts. There is, however, an element of uncertainty in this figure as other sources report an increase in the area of forest of 21.7 million ha, partially offset by a decrease in other wooded land of 11.1 million ha.
In practically all the developed countries, fellings have remained below net annual increment and, in some cases, by a substantial margin. In the exploitable forests, in which most of the fellings occur, 1990 fellings reached only 74 percent of the increment. The corresponding regional figures are 80 percent in North America; 74 percent in the former USSR; 71 percent in Europe and perhaps no more than 50 percent in the developed countries of the Pacific region. The lower rates are not a new development: the evidence suggests that the increment in Europe has exceeded fellings for at least 40 years, maybe much longer. This data also confirms reports of a long-term build-up of growing stocks and woody biomass in most developed countries.
The temperate zone includes two basic ecological formations: mixed temperate forest and boreal forest. The mixed temperate forests comprise coniferous and broad-leaved species, including both deciduous and evergreens. The boreal forests extend between the Arctic tundra and the temperate zones in a circumpolar belt and consist of mainly coniferous species. The boreal forests are vast; they cover 920 million ha— 27 percent of the earth's forest area—and contain more than 70 percent of its coniferous forests.
Public concern about quality of temperate forests and how they are managed and used is widespread and growing.16 Concerns include forest quality, health, and the ability of current forest policies and of management practices in the various categories of ownership to balance forest quality with competing demands for timber, jobs, wildlife conservation, water resources, landscape and recreational benefits.
Forest plantations are established for a variety of reasons including the production of industrial roundwood, fuelwood and poles, and for soil conservation and shelters. Plantations cannot provide the full range of goods and services supplied by a natural forest. They are tree crops, analogous to agricultural crops, with a simplified ecology of one or, at most, a few species usually chosen for their yield and ease of management. The primary purpose of most plantations is to produce wood or other products quickly and cheaply. Their role, which is a highly valuable one, complements national or global forestry management strategies.
The available data on plantation areas suggest that the 68 million ha in developing countries provide a growing proportion of their commercial wood consumption needs (see Table 7). An additional 14 million ha of rubber, coconut and oil palm plantations are not included in the area of forest plantations. The latter are mainly in Asia and the wood obtained from them is increasingly important. In the temperate and boreal zone, many forests are managed in a manner that makes the distinction between planted forest and naturally regenerated forest of little significance. Thus the following discussion relates mainly to forest plantation in developing countries.
Plantations can be highly productive. The increment of timber from a tropical plantation may be 30 m3 per hectare compared with 2 to 8 m3 per hectare from a managed natural forest. Annual yields of up to 70 m3 per hectare have been attained in Brazil from clones of hybrids of eucalyptus species. Such exceptional figures must, of course, be treated with caution. Experience shows that the yields assumed at the planning stage of many plantations are overestimated.17 A recent review of tropical plantations concluded that planning is generally poor, particularly for vital issues such as matching species and site. The study also noted that plantation projects are often designed in haste, with scant attention paid to important issues because of time and financial constraints.18 However, tree plantations that are well planned and managed can be highly productive and are ideal for supporting the large-scale wood industries required to satisfy future demands for wood and wood fibre.
![]()
![]()
![]()