


Preliminary indications suggest that cereal food aid shipments in 2000/01 could reach 10 million tonnes, close to last year's estimated volume. Shipments to the Russian Federation are forecast to decrease sharply, following this year's improved harvest in that country. However, food aid needs are expected to be larger: mostly in Africa, but also in the Democratic People's Republic of Korea and the southern countries of the CIS.
According to the latest information supplied by the World Food Programme (WFP), total cereal shipments in 1999/2000 (1 July through 30 June) under programme, project and emergency food aid amounted to 10.2 million tonnes, down 800 000 tonnes from the previous year, despite larger shipments to the Russian Federation (table A.10). Among the individual cereals, only shipments of coarse grains (mostly maize) registered an increase, rising by over 200 000 tonnes; those of rice fell by 700 000 tonnes and those of wheat declined by nearly 400 000 tonnes.
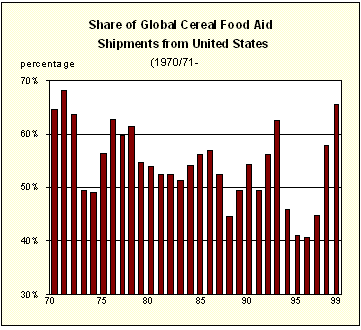
Cereal shipments from the United States rose to 6.7 million tonnes in 1999/2000, accounting for nearly 65 percent of the world total, up from 58 percent in 1998/99, largely on account of higher shipments to the Russian Federation. This level of shipments from the United States is comparable only to two periods in the past: the early 1970s and 1993/94. Out of the total of 6.7 million tonnes, wheat accounted for nearly 4.3 million tonnes, down 300 000 tonnes from 1998/99. The decline in wheat shipments was more than offset by the rise in coarse grains (mostly maize), which increased from 900 000 tonnes in 1998/99 to 1.3 million tonnes in 1999/2000. By contrast, cereal donations from Japan, mostly rice, declined sharply while those from the EC also fell. Shipments from most other origins remained close to 1998/99 levels.
On the recipient side, shipments to the Russian Federation in 1999/2000 soared to 2.4 million tonnes, which was close to the record shipped in 1993/94 and was up nearly 500 000 tonnes from the previous season's already high level. Larger shipments of coarse grains accounted for most of this increase. Overall, 830 000 tonnes of coarse grains were sent to the Russian Federation, up 300 000 tonnes from 1998/99. At over 1.5 million tonnes, the volume of wheat shipments as food aid to the Russian Federation in 1999/2000 was up by 65 000 tonnes from the previous season.
Excluding the Russian Federation, total food aid shipments to the rest of the world in 1999/2000 registered a decline of about 1.3 million tonnes, or 14 percent to 7.7 million tonnes. Nevertheless, even at
this reduced level, food aid by major donors exceeded the "minimum commitments" agreed under the 1999 Food Aid Convention (FAC) by at least 2.8 million tonnes. It should be noted that the 1999 FAC sets the minimum "guaranteed annual tonnage" at around 4.9 million tonnes (in wheat equivalent). Also, the Russian Federation is not among the eligible food aid recipients under Article VII of the Convention2/.
Total cereal shipments as food aid to the Low-Income Food-Deficit Countries (LIFDCs) in 1999/2000 fell to around 7 million tonnes, down 1.1 million tonnes from 1998/99. Most of the decline was in Asia, while shipments to Africa rose slightly. In Asia, Bangladesh was the largest recipient (964 000 tonnes) followed by the Democratic People's Republic of Korea (733 000 tonnes) and Indonesia (438 000 tonnes). Nevertheless, total shipments to these three major food aid recipient countries registered a drop of about 1.4 million tonnes, or 39 percent, compared to 1998/99. By contrast, in Africa, shipments to Ethiopia in 1999/2000 doubled from the previous year to 1.2 million tonnes. After Ethiopia, Rwanda (179 000 tonnes) and Kenya (120 000 tonnes) ranked the second and the third largest food aid destinations in Africa. Among the LIFDCs in Latin America and the Caribbean, cereal shipments to Cuba, Haiti and Honduras increased slightly. Most of the increase was in the form of wheat, while rice and maize shipments declined. Among the LIFDCs in Europe, smaller shipments were made to Albania and Bosnia-Herzegovina but shipments to former Yugoslav Republic of Macedonia increased from 6 000 tonnes in 1998/99 to 92 000 tonnes in 1999/2000.
_______________
| 1995/96 | 1996/97 | 1997/98 | 1998/99 | 1999/2000 estim. |
||||
| ( . . . . . . . . . . . . . . . thousand tonnes . . . . . . . . . . . . . . ) | ||||||||
| WORLD | 7 397 | 5 605 | 6 241 | 11 034 | 10 228 | |||
| LIFDC | 6 264 | 4 487 | 5 267 | 7 908 | 6 779 | |||
| Africa | 2 526 | 2 061 | 2 281 | 2 583 | 2 647 | |||
| Sub-Saharan | 2 305 | 1 871 | 2 172 | 2 532 | 2 555 | |||
| Others | 221 | 190 | 109 | 50 | 92 | |||
| Asia | 3 911 | 2 526 | 3 132 | 5 158 | 3 827 | |||
| East Asia and SE Asia | 877 | 685 | 1 015 | 2 381 | 1 427 | |||
| South Asia | 1 210 | 906 | 1 127 | 2 017 | 1 568 | |||
| Others | 1 824 | 934 | 989 | 760 | 832 | |||
| Latin America and the Caribbean | 602 | 611 | 553 | 974 | 739 | |||
| Others | 358 | 407 | 275 | 2 320 | 3 015 | |||
According to WFP, total shipments of non-cereals as food aid reached 1.6 million tonnes in 1999 (January-December)1/, this was up 700 000 tonnes, or 80 percent, from the previous year and the highest in 5 years. However, as in the case for cereals, most of this increase was due to higher shipments to the Russian Federation. Total shipments of non-cereals to the Russian Federation soared from only 400 tonnes in 1998 to a record 800 000 tonnes in 1999, most of which included pulses (595 000 tonnes, mainly from the United States) and meat (159 000 tonnes, mainly from the EC). Total shipments to the LIFDCs rose slightly to 635 000 tonnes. Smaller shipments were recorded for several countries, such as Indonesia (down 33 000 tonnes), Kenya (down 13 000 tonnes), Sierra Leone and Democratic People's Republic of Korea (down 9 000 tonnes in each country) and Uganda (down 8 000 tonnes). These declines were largely offset by bigger shipments to many other LIFDCs, including Uzbekistan, the Philippines, Nicaragua, Honduras, Liberia and Eritrea.
| 1995 | 1996 | 1997 | 1998 | 1999 estim. |
|
| ( . . . . . . . . . . . . . thousand tonnes . . . . . . . . . . . . ) | |||||
| WORLD | 1 261 | 987 | 895 | 915 | 1 627 |
| LIFDC | 670 | 615 | 580 | 627 | 635 |
| Africa | 455 | 392 | 313 | 302 | 296 |
| Asia | 234 | 255 | 275 | 341 | 313 |
| Latin America and the Caribbean | 152 | 148 | 170 | 232 | 152 |
| Others | 420 | 193 | 136 | 39 | 866 |
Among the non-cereal food categories, shipments of nearly all commodities, except for edible fats and vegetable oils, rose in 1999 as compared to 1998. Shipments of pulses surged to 1 million tonnes, 133 percent more than in 1998. At this level, food aid in pulses represented 62 percent of the overall total food aid of non-cereals in 1999 and also accounted for almost 13 percent of world trade of pulses in that year.
Nearly 85 percent of shipments of pulses in 1999 originated in the United States. The near triple expansion in shipments from the United States more than offset the declines from most other origins, including Australia, Canada and the EC. Another major non-cereal food category is meat and meat products, the shipments of which showed a dramatic increase, from only 4000 tonnes in 1998 to 163 000 tonnes in 1999. The increase was mostly due to a rise in shipments from the EC.
| 1995 | 1996 | 1997 | 1998 | 1999 estim. |
Change from 1998 | |
| ( . . . . . . . . . . . . . thousand tonnes . . . . . . . . . . . . . .) | ||||||
| Butter oil | 1.8 | 1.1 | 0.4 | 0.2 | 0.2 | - |
| Dry fruit | 1.9 | 6.7 | 2.6 | 0.2 | 1.1 | 0.9 |
| Edible fats | 3.5 | 9.0 | 4.3 | 6.9 | 1.0 | -5.8 |
| Fish & products | 19.0 | 15.9 | 14.5 | 10.2 | 15.9 | 5.7 |
| Meat & products | 6.6 | 8.0 | 8.6 | 4.2 | 162.6 | 158.4 |
| Milk | 54.6 | 25.9 | 17.3 | 24.9 | 50.5 | 25.6 |
| Other dairy products | 13.0 | 4.0 | 0.9 | 0.2 | 1.4 | 1.2 |
| Pulses | 729.5 | 508.2 | 405.5 | 433.8 | 1 010.7 | 577.0 |
| Sugar | 83.1 | 49.3 | 49.2 | 26.7 | 31.2 | 4.5 |
| Vegetable oils | 315.5 | 285.4 | 286.3 | 355.0 | 300.1 | -54.9 |
| Other foods | 32.3 | 73.4 | 105.1 | 52.6 | 52.0 | -0.6 |
| Total | 1 260.8 | 987.1 | 894.8 | 914.7 | 1 626.8 | 712.1 |
Cereal contributions to the WFP administrated International Emergency Food Reserve (IEFR) for 1999 reached 1.7 million tonnes, down 200 000 tonnes from 1998. For non-cereals, total contributions reached 315 000 tonnes, up more than 100 000 tonnes from 1998 (Table A. 11). As of October 2000, pledges to the 2000 IEFR have exceeded 580 000 tonnes for cereals and nearly 100 000 tonnes for non-cereals. To-date, these pledges are slightly below the pace observed for the corresponding period in 1999. Contributions to the 1999 Protracted Relief and Refugee Operations (PRROs), also directed by the WFP, amounted to about 468 000 tonnes for cereals, down 70 000 tonnes from 1998. For other food commodities, the 1999 contributions exceeded 200 000 tonnes, twice as much as in 1998. By October 2000, already some 1.2 million tonnes of cereals and nearly 170 000 tonnes of non-cereals have been pledged under the 2000 PRROs. Higher cereal contributions so far in 2000 mostly reflect a tripling in contributions from the United States.
