![]()
![]()
![]()
Estimating totals from samples is a basic use of data. The methodology of raising is closely linked to the hierarchy of stratification. The stratification at each level, from the single trip interview to the estimate of total landings of the country, should be designed to make the raising from one level to the next level possible and dependable. There are usually a number of different options available for raising the samples to totals as will be demonstrated by the examples in this section. There is no universal methodology, which will lead to the best estimate in all cases. The elements of methodology given here should be considered examples. These examples should be sufficiently representative to cover most actual cases.
Some raising procedures are based on a rational methodology, where the raising factors can be estimated from observations. This applies to the well-defined strata. However, not all strata are well defined. Usually there is an “Other strata”. We may for example have the gear-strata “Trawl”, “Gillnet”, “Purse seine”, “Lines” and “Other Gears”.
Very often, this “other group” is not sampled, because it represents a large group of rare gears. Thus, when raising from “Trawl”, “Gillnet”, “Purse seine”, “Lines” to total fishery, we may be in the situation that the raising factor has to be “guessed”, that is based on a combination of general knowledge and common sense. Needless to say, the stratification should be designed to minimise the uncertainty from the “Other Strata”.
The basic principle of raising interview samples is illustrated by Figure 4.4.1.
If interviews containing information about the catch (or landings) per day can be combined with information on total effort and activity, a simple multiplication should provide the estimate of the total catch (or landings). If other effort measures (see Section 3.1.2) are available, they may replace the “fishing days”, which may improve the estimation of total landings.
Figure 4.4.2 elaborates on the content of the three boxes in Figure 4.4.1. The samples (the interviews) contain information on the landings and the duration of the fishing trips. In addition, the fishers are requested to tell about their recent level of activity, that is, the number of days they were actively fishing during last month. This allows for the estimation of the monthly catch of one vessel by:
(Catch of vessel/month) = (Catch / fishing day / vessel) x (fishing days / month)
Figure 4.4.1 Raising of catch per unit of effort to total catches.
Figure 4.4.2 Further details on the estimation of total landings expanding Figure 4.4.1
If only vessels are considered that are very similar (i.e. vessels belonging to the same fleet) then we can assume that all vessels have approximately the same catch. If we know the number of vessels in the fleet, then the catch of the fleet can be estimated from:
(Catch of fleet in a month) = (Catch of one vessel in a month) x (Number of vessels in fleet)
Note that the “(Catch of one vessel in a month)” means the “average catch” of the sampled vessels.
The “number of vessels” is the number of vessels fishing from the province in question. Here, the “province” is used as an example of a geographical stratum. The “number of vessels” includes the local vessels as well as the vessels from other provinces. If a vessel remains the entire month in the province, then it is counted as one vessel. If it remains in the province a certain fraction of the month then it is counted as that fraction. Often, the number of days registered as fishing from a province should be available from the coast guard, the harbour police or some other local authority. In each fishing port, the appropriate local authority should register the visiting vessels from other provinces, identifying their base port. In the following, we shall refer to the local authority, which records the arrival and departure of non-local vessels, as the “coast guard”.
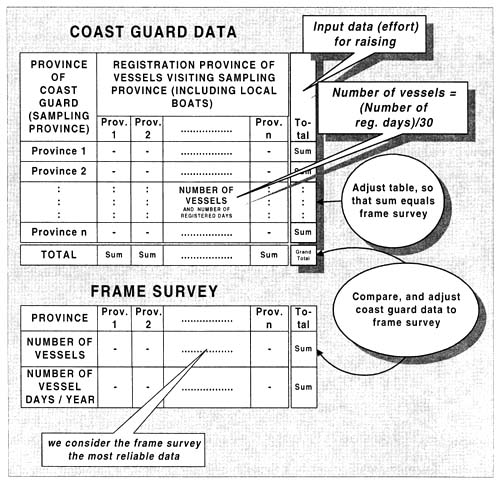
Figure 4.4.3 Estimation of number of (active) vessels from coast guard data and frame survey.
If, however, there is a suspicion that the “coast guard” does not register all vessels, the coast guard registrations should be supplemented by independent data collection. Frame survey data can be used for that purpose. As explained earlier, the frame survey provides a list of the number of vessels registered in each province by fleet. If the frame survey is correct, and the registrations recorded by the “coast guard” are representative for all vessels (also those not registered with the coast guard), then it is possible to use the incomplete “coast guard” data to allocate the fishing fleets to provinces of the country. The principles for this estimation procedure are illustrated in Figure 4.4.3.
The “coast guard” may not regularly record the fishing days, but they should, as a minimum, record the number of days the vessel is registered in the harbour under the jurisdiction of the coast guard station in question. They should record the registration number of the vessel, when it registered and the number of days it plans to register at the port. If a vessel registers for two weeks and then decides to stay another two weeks, there will be two registrations in the file of the coast guard. However, for the calculations, this does not matter, as such a vessel would appear as two half vessels.
The frame survey may also be used to collect information on the annual fishing activity (i.e. the number of days fishing during the year). This information, if available, may be used for estimation of the number of active vessels, rather than just the number of vessels. With these data, it should be possible to improve the estimate of total effort, but the procedure for allocation of effort to provinces (or landing places) remains the same.
The catch (or landings) information contained in an interview form has three hierarchical levels of samples and sub-samples. Figure 4.4.4 presents a hypothetical example, with three commercial groups and three species represented in each commercial group. The recording on an interview form represents a “fishing trip” (see Chapter 5 for an example of a trip-interview form).
The first level is the recording of the total weight of the landings from a commercial group. W(t,cg) is the total weight of commercial group “cg” of fishing trip “t” (see list of symbols below). Thus the total landings of trip “t” is the sum over commercial groups, ∑cg W(t,cg). From each commercial group, the enumerator may take a subsample to estimate the species composition. The weight of this subsample is denoted WS(t,cg).
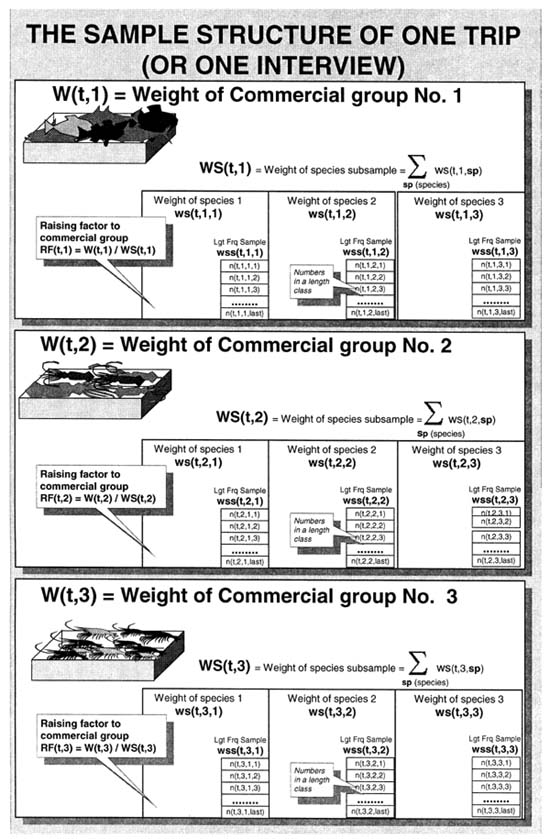
Figure 4.4.4 The sample hierarchy of a trip (or interview) sample.
| List of symbols used for the trip data: | |
| cg | = index of commercial group |
| sp | = index of species |
| lc | = index of length class (body length interval) |
| t | = index of time (date) |
| W(t,cg) | = weight of commercial group cg landed from trip t |
| WS(t,cg) | = weight of species composition sample from commercial group cg landed from trip t |
| WS(t,cg,sp) | = weight of species sp in the sample from commercial group cg landed from trip t |
| wss(t,cg,sp) | = weight of a subsample of species sp in the sample from commercial group cg landed from trip t |
| n(t,cg,sp,lc) | = frequency of length group lc of species sp in the sample from commercial group cg landed from trip t |
| RF(t,cg) | = W(t,cg) / WS(t,cg), Raising Factor for species composition sample |
| RFL(t,cg,sp) | = W(t,cg) / wss(t,cg,sp), Raising Factor for length frequency sample |
The weight of species “sp” in the sample is denoted “ws(t,cg,sp)”, and thus,
WS(t,cg) = ∑cg ws(t,cg,sp).
The weight of a species in the sub-sample is raised to the total commercial group by the raising factor
RF(t,cg) = W(t,cg) / WS(t,cg).
That is, the estimate for the total weight of species “sp” landed in commercial group “cg”, becomes:
(Total weight of species “sp” in commercial group cg) = RF(t,cg) × ws(t,cg,sp)
From the species composition sample, the enumerator may take a sub-subsample, for length frequency. Length frequency samples will be taken only for a limited number of selected species. Here it is assumed (as an example) that the length frequencies are used for VPA (Virtual Population Analysis). In the following, we shall refer to the species selected for length frequency sampling as the “VPA species”.
The weight of the length frequency sample from species “sp” in commercial group “cg”, is denoted wss(t,cg,sp). The number of specimens “sp”, in length class “lc”, (or the length frequency) is called n(t,cg,sp,lc).
This number is raised to the total commercial groups by the raising factor:
RFL(t,cg,sp) = W(t,cg) / wss(t,cg,sp):
(Total number of specimens, species “sp” in length class “lc”, in commercial group “cg”) =
RFL(t,cg,sp) x n(t,cg,sp,lc)
The raising of trip records from one fleet to the total province is illustrated by Figure 4.4.5. The “province” is here used as an example of a geographical stratum.
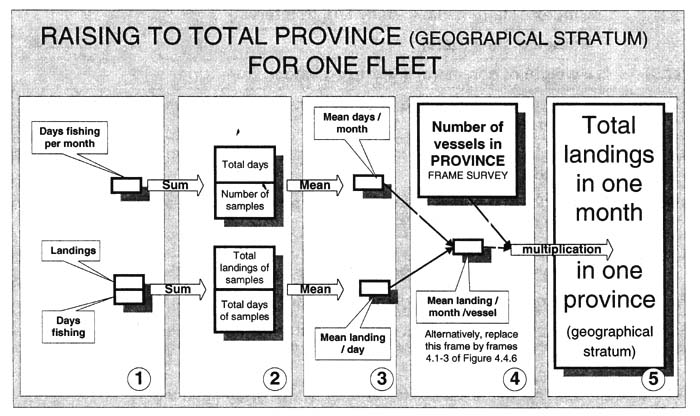
Figure 4.4.5 Raising to total province (geographical stratum) for one fleet.
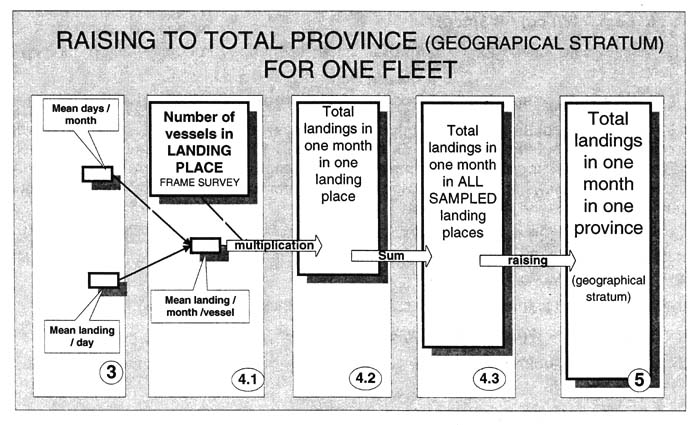
Figure 4.4.6 Additional steps in the raising to total province (geographical stratum). Extension of Figure 4.4.5.
The recording of the fishing activity (number of fishing days last month) and the catch and number of fishing days is summed over all sampled trips (the two leftmost frames in Figure 4.4.5). The third frame indicates the calculation of the mean value of activity level and catch per day. Combining the catch per day and the activity level, provides an estimate for the average catch during the month of one vessel in the fleet in question. Multiplying the catch per month per vessel by the number of vessels gives the estimate of the total catch of the province.
The raising procedure may contain some more steps, as it might be natural first to compute the total catch of a landing place and then sum the landing places within the province. These steps would replace frame 4 of Figure 4.4.5 with three steps (4.1, 4.2, 4.3) as illustrated by Figure 4.4.6.
The raising of samples to the total for the country can follow several structures in the fishing sector. Two alternative structures to follow in the raising procedure are discussed in this section, namely the “province-structured raising” and the “fleet-structured raising”. Which alternative to select depends on which structure provides the most homogeneous strata. If the fleets can be defined for the entire country, the fleet-structured raising may be preferable, whereas if the fleets are province specific, the province structure is preferred. Again, the “province” is used as an example of a geographical stratum.
Figure 4.4.7 illustrates raising from one fleet in one province (or a landing place) to the total country landings using the province-structured raising. As mentioned in the foregoing section, the raising may start with the total landings of a landing place (case B) or the total landings of a province (case A). In case of A, we “bypass” the landing place level and start the calculation at the province level. That may be the approach for very small provinces, but most often case B should apply. In case B, the raising is made on the landing place level and then the landing places are summed. It is not possible to give a universal rule for the procedure, as the choice will depend very much on the local conditions.
The raisings described here from the sampled part to the whole population. The raising factors from the sampled fleets to the total set of fleets is expected to be close to 1, as the programme should sample all major fleets. The raising in some cases may have to account for an “other-group”, that is, a heterogeneous group which is difficult to sample, and for which only some less quantifiable knowledge is available. This type of “less quantifiable knowledge” could be that it is “rather insignificant” at most 2% of the total, and we may then apply the raising factor 1.015 as the best “guesstimate”. The raising arrows in Figure 4.4.8 marked by an asterisk (*) indicates a raising from “all sampled units” to “all sampled units + other units”. When not marked, the raising can be made based on quantitative observations, for example the “number of vessels”, which would be calculated as:
RAISING FACTOR = (TOTAL NUMBER OF VESSELS)/(NUMBER OF VESSELS IN PROVINCES SAMPLED BY THE PROGRAMME)
Figure 4.4.8 illustrates the “fleet-structured raising”. In this case, the raising is made within the fleets until the very last step, where the “other fleets” are accounted for. In the “province-structured raising” the raising to “all fleets” either took place at the province level (Case A in Figure 4.4.8) or at the landing place level (Case B). The “province” is included in the steps to account for provinces not covered by the sampling programme, but differences between fleets in the provinces are ignored.
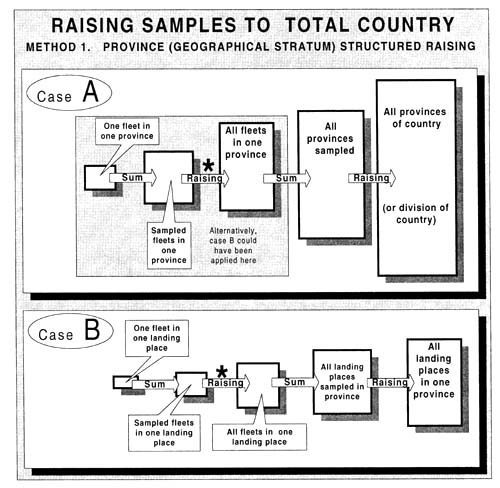
Figure 4.4.7 Raising samples to the country total landings using “province-structured raising”. The raising arrows marked by an asterisk (*) indicate a raising from “all sampled units” to “all sampled units + other units”.
Figure 4.4.8 Raising samples to the total country landings using “fleet-structured raising”. The raising arrow marked by an asterisk (*) indicates a raising from “all sampled units” to “all sampled units + other units”.
Two sets of tables (Tables 4.4.1 and 4.4.2) present a hypothetical example to illustrate the raising procedures in the foregoing sections. Table 4.4.1 (Sub-Tables a to k) illustrates Method 1: “the province-structured raising” and Table 4.4.2 (Sub-Tables a to i) Method 2: ".the “Fleet-structured raising”
The example deals with three species, all of which occur in two commercial groups. This example is perhaps not realistic, but covers most cases that may be met, although they are unlikely to occur all at the same time. The examples are constructed using spreadsheet software.
The first part of Table 4.4.1 (Sub-Tables a-e) refers to the vessels of a single fleet in a single province. As an example, we consider the period of one month. In practice, this period may well be a quarter of the year or half a year or it may be a fishing season.
The table starts by illustrating the raising of an interview sample to total trip, where species composition and length frequency samples have been collected. Sub-Table a illustrates the summation of commercial groups (resulting in Sub-Table c) and the raising of species composition samples to total landings of one trip by commercial group. It also illustrates the raising of length frequencies to total trip.
Sub-Table b contains the activity levels (here expressed in number of days fished per month, D) and the “coast guard data”, that is, the number of days registered in the base port (DR). As this example deals with the month of January, DR/31 is the fraction of the month the fishing vessel was registered in the base port, and consequently, D*DR/31 is the number of days fishing from the base-port during the month. The activities are also based on samples. Here three samples are taken from fleet A and four samples are taken from fleet B. From the samples, the average number of fishing days/vessel during the month can be estimated. This average number of days combined with the number of vessels by fleet is usually collected by the “Frame survey”. The total number of vessels by fleet will be introduced later in the raising process.
Sub-Table c contains the landings by species, because the weight of species is summed over commercial groups. The table illustrates the summation of sampled trips, here exemplified by the sum of two trips.
Sub-Table d contains the sum of sampled trips from Sub-Table c, and Sub-Table e contains the mean catch per day derived from Sub-Table c divided by the total number of days Sub table c represents.
Combining the average landings per day with the number of vessels fishing from the base port during the month (not necessarily the entire month) gives an estimate of the total landings by the fleet during the month. This is illustrated by Sub-Table f, which now contains two fleets A and B, and fleet B has been given the same processing as fleet A. We assume in the present example that only fleets A and B have been sampled. The sum of fleets A and B thus represents the total landings by sampled fleets (Su-table g).
Sub-Table h illustrates the raising from “Sampled fleets” to “All fleets” in province A. This is where “Other fleets” are accounted for. Sub-Table h contains two provinces (A and B) and we assume that these provinces are the only ones sampled. The sum of sampled provinces, illustrated by Sub-Table i, represents all landings (i.e. all fleets) combined, and therefore the following summations and raising are not fleet-specific. This is the reason for calling the method of Table 4.4.1 the “province-structured raising”.
Sub-Table j illustrates the raising from “sampled provinces” to all “Provinces”. This raising may be based on observations from earlier years, when these provinces might have been sampled to estimate the relative size of the landings. The raising may be of the same questionable character as the accounting for “other fleets” if little is known about the non-sampled provinces. Other data may be available which can give the relative size of the non-sampled provinces. Such data may be the number of fishers, the total income from fisheries, the income from export of fisheries products, the investments in the fishing sectors of the province, etc. The relative size of the fishery may also be derived from the number of vessels, but then we are in the “fleet-structured raising”, which is illustrated by Table 4.4.2.
TABLE 4.4.1 EXAMPLE TO ILLUSTRATE METHOD 1: THE PROVINCE-STRUCTURED RAISING PROCEDURE
Sub-Table A: Data from one Trip, by Commercial Group, Fleet A
| ONE FISHING TRIP | PROVINCE A | MONTH 1 (January) | |||||||||
| FLEET A | TRIP 1 | ||||||||||
| DIRECT OBSERVATIONS | PROCESSED DATA | ||||||||||
| Raising factor to comm. gr. Species sample RF(t,cg) a) | Weight of species raised to total comm.gr b) | Raising factor to comm.gr. Length frq. sample RFL(t,cg)c) | Length Frq. raised to total comm.group d) | ||||||||
| Index of Comm. Group cg | Weight of Comm. Group W(t,cg) kg | Weight of Spec. Comm. Sample WC(cg) kg | Index of species sp | Weight of species ws(t,cg,sp) | Weight of Length Frq. Sub-sample Wss(t,cg,sp) | Index of length class lc | Length Frequency (number) n(t,cg,sp,lc) | ||||
| cg=1 | 136 | 17 | sp=1 | 6 | 2 | lc=1 | 25 | 8.00 | 48 | 68 | 1700.0 |
| lc=2 | 20 | 1360.0 | |||||||||
| lc=3 | 1 | 68.0 | |||||||||
| sp=2 | 7 | 4 | lc=1 | 15 | 56 | 34 | 510.0 | ||||
| lc=2 | 7 | 238.0 | |||||||||
| lc=3 | 0 | 0.0 | |||||||||
| sp=3 | 4 | 1 | lc=1 | 13 | 32 | 136 | 1768.0 | ||||
| lc=2 | 8 | 1088.0 | |||||||||
| lc=3 | 2 | 272.0 | |||||||||
| Total | 17 | Total | 136 | ||||||||
| cg=2 | 483 | 23 | sp=1 | 8 | 4.5 | lc=1 | 2 | 21.00 | 168 | 30.2 | 60.4 |
| lc=2 | 13 | 392.9 | |||||||||
| lc=3 | 23 | 695.1 | |||||||||
| sp=2 | 9 | 5.7 | lc=1 | 1 | 189 | 23.9 | 23.9 | ||||
| lc=2 | 8 | 190.9 | |||||||||
| lc=3 | 18 | 429.5 | |||||||||
| sp=3 | 6 | 3.8 | lc=1 | 2 | 126 | 35.8 | 71.6 | ||||
| lc=2 | 17 | 608.4 | |||||||||
| lc=3 | 23 | 823.2 | |||||||||
| Total | 23 | Total | 483 | ||||||||
| a) Raising factor for species composition sample, RF(t,cg) = W(t,cg)/WC(cg) | |||||||||||
| b) = ws(t,cg,sp)*RF(t,cg) | |||||||||||
| c) Raising factor for length frequency sample, RFL(t,cg) = W(t,cg)/wss(t,cg,sp) | |||||||||||
| d) = n(t,cg,sp,lc)*RFL(t,cg) | |||||||||||
Sub-Table B: Activity Data and Days Registered in Port, Fleets A and B
| ACTIVITY LEVEL | FLEET A | ACTIVITY LEVEL | FLEET B | ||||
| Sampled Vessel | Number of active days during month | Number of days registered in base port | Number of active days in base port | Sampled Vessel | Number of active days during month | Number of days registered in base port | Number of active days in base port |
| No. | D(A) | DR(A) | D(A)*DR(A)/31 | No. | D(B) | DR(B) | D(B)*DR(B)/31 |
| 1 | 16 | 15 | 7.74 | 1 | 16 | 15 | 7.74 |
| 2 | 19 | 31 | 19.00 | 2 | 19 | 31 | 19.00 |
| 3 | 17 | 20 | 10.97 | 3 | 21 | 31 | 21.00 |
| Average | 12.57 | 4 | 17 | 15 | 8.23 | ||
| Average | 13.99 | ||||||
Sub-Table c. Species Composition and Length Frequencies for two Trips (summed over Commercial Groups)
| FLEET A | TOTAL FOR TRIP 1: | Species | Total Landings a) | Length Class | Total Length Frequency a) |
| PROVINCE A NUMBER OF DAYS = 7 | |||||
| Species 1 | 216 | lc=1 | 1760.4 | ||
| MONTH 1 (JANUARY) | sp=1 | lc=2 | 1752.9 | ||
 | lc=3 | 763.1 | |||
| Species 2 | 245 | lc=1 | 533.9 | ||
| sp=2 | lc=2 | 428.9 | |||
| lc=3 | 429.5 | ||||
| Species 3 | 158 | lc=1 | 1839.6 | ||
| sp=3 | lc=2 | 1696.4 | |||
| lc=3 | 1095.2 | ||||
| Total | 619 | ||||
| FLEET A | TOTAL FOR TRIP 2: | Species | Total Landings a) | Length Class | Total Length Freq. a) |
| PROVINCE A NUMBER OF DAYS = 11 | |||||
| Species 1 | 405 | lc=1 | 1201.0 | ||
| MONTH 1 (JANUARY) | sp=1 | lc=2 | 1617.0 | ||
 | lc=3 | 8035.0 | |||
| Species | 371 | lc=1 | 709.0 | ||
| sp=2 | lc=2 | 1105.0 | |||
| lc=3 | 1571.0 | ||||
| Species 3 | 641 | lc=1 | 1742.0 | ||
| sp=3 | |||||
| lc=2 | 1531.0 | ||||
| lc=3 | 978.0 | ||||
| Total | 1417 | ||||
Sub-Table D Summation over Sampled Trips
| FLEET A | TOTAL FOR ALL SAMPLED TRIPS | Species | Total Landings | Length Class | Total Length Frequency |
| PROVINCE A | TOTAL NUMBER OF DAYS =18 | ||||
| MONTH 1 (JANUARY) | Species 1 | 621 | lc=1 | 2961.4 | |
 | sp=1 | lc=2 | 3369.9 | ||
| lc=3 | 8798.1 | ||||
| Species 2 | 616 | lc=1 | 1242.9 | ||
| sp=2 | lc=2 | 1533.9 | |||
| lc=3 | 2000.5 | ||||
| Species 3 | 799 | lc=1 | 3581.6 | ||
| sp=3 | lc=2 | 3227.4 | |||
| lc=3 | 2073.2 | ||||
| Total | 2036 | ||||
Sub-Table e Average (per Day) over sampled Trips.
| FLEET A | Average/day for all sampled trips | Total Landings | Length Class | Total Length Frequency | |
| PROVINCE A | Divide by 18 (total number of days) | Species | |||
| MONTH 1 (JANUARY) | Species 1 | 34.5 | lc=1 | 164.5 | |
 | sp=1 | lc=2 | 187.2 | ||
| lc=3 | 488.8 | ||||
| Species 2 | 34.2 | lc=1 | 69.0 | ||
| sp=2 | lc=2 | 85.2 | |||
| lc=3 | 111.1 | ||||
| Species 3 | 44.4 | lc=1 | 199.0 | ||
| sp=3 | lc=2 | 179.3 | |||
| lc=3 | 115.2 | ||||
| Total | 113.1 | ||||
Sub-Table F Raising to Total Fleet of Province A for two Sampled Fleets
| FLEET A | TOTAL OF FLEET A | Species | Total Landings Unit 1000 a) | Length Class | Total Length Freq. Unit 1000 b) |
| PROVINCE A | Number of vessels = 157 | ||||
| MONTH 1 (JANUARY) | |||||
| Mean Number of active days/vessel = 12.57 | Species 1 | 68.1 | lc=1 | 324.7 | |
 | sp=1 | lc=2 | 369.5 | ||
| lc=3 | 964.6 | ||||
| Species 2 | 67.5 | lc=1 | 136.3 | ||
| sp=2 | lc=2 | 168.2 | |||
| lc=3 | 219.3 | ||||
| Species 3 | 87.6 | lc=1 | 392.7 | ||
| sp=3 | lc=2 | 353.8 | |||
| lc=3 | 227.3 | ||||
| Total | 223.2 | ||||
| FLEET B | TOTAL OF FLEET B | Species | Total Landings Unit 1000 a) | Length Class | Total Length Freq. b) |
| PROVINCE A | Number of vessels = 87 | ||||
| MONTH 1 (JANUARY) | |||||
| Mean Number of active days/vessel = 13.99 | |||||
| Species 1 | 82.9 | lc=1 | 395.2 | |
| sp=1 | lc=2 | 449.8 | |||
| lc=3 | 1174.2 | ||||
| Species 2 | 133.3 | lc=1 | 268.9 | ||
| sp=2 | lc=2 | 331.9 | |||
| lc=3 | 432.8 | ||||
| Species 3 | 172.9 | lc=1 | 774.9 | ||
| sp=3 | lc=2 | 698.3 | |||
| lc=3 | 448.6 | ||||
| Total | 389.0 | ||||
| a) (Number of vessels) * (Mean active days/vessel) * (Average landings/day/vessel)/1000 tons b) (Number of vessels) * (Mean active days/vessel) * (Average number/day/vessel)/1000 specimens | |||||
Sub-Table g Summing Sampled Fleets of Province A.
| (FLEET A + FLEET B) TOTAL OF SAMPLED FLEETS | Species | Total Landings Unit 1000 | Length Class | Total Length Freq. Unit 1000 |
| PROVINCE A | ||||
| MONTH 1 (JANUARY) | ||||
 | Species 1 | 141.0 | lc = 1 | 719.9 |
| sp = 1 | lc = 2 | 819.2 | ||
| lc = 3 | 2138.8 | |||
| Species 2 | 114.8 | lc = 1 | 405.2 | |
| sp = 2 | lc = 2 | 500.0 | ||
| lc = 3 | 652.2 | |||
| Species 3 | 186.5 | lc = 1 | 1167.6 | |
| sp = 3 | lc = 2 | 1052.2 | ||
| lc = 3 | 675.9 | |||
| Total | 442.3 |
Sub-Table h Raising Sampled Fleets (all fleets combined) of Sampled Provinces to Total provinces
| PROVINCE A | TOTAL OF ALL FLEETS | Species | Total Landings Unit 1000 | Length Class | Total Length Freq. Unit 1000 |
| MONTH 1 (JANUARY) | |||||
| Raising factor = (All fleets)/(Sample fleets) = 1.1 | |||||
| Species 1 | 155.1 | lc = 1 | 791.9 | |
| sp = 1 | lc = 2 | 901.1 | |||
| lc = 3 | 2352.7 | ||||
| Species 2 | 126.3 | lc = 1 | 445.7 | ||
| sp = 2 | lc = 2 | 550.1 | |||
| lc = 3 | 717.4 | ||||
| Species 3 | 205.2 | lc = 1 | 1284.4 | ||
| sp = 3 | lc = 2 | 1157.4 | |||
| lc = 3 | 743.4 | ||||
| Total | 486.5 | ||||
| PROVINCE B | TOTAL OF ALL FLEETS | Species | Total Landings Unit 1000 | Length Class | Total Length Freq. Unit 1000 |
| MONTH 1 (JANUARY) | |||||
| Species 1 | 170.6 | lc = 1 | 871.1 | |
| sp = 1 | lc = 2 | 991.3 | |||
| lc = 3 | 2588.0 | ||||
| Species 2 | 138.9 | lc = 1 | 490.3 | ||
| sp = 2 | lc = 2 | 605.1 | |||
| lc = 3 | 789.1 | ||||
| Species 3 | 225.7 | lc = 1 | 1412.8 | ||
| sp = 3 | lc = 2 | 1273.1 | |||
| lc = 3 | 817.8 | ||||
| Total | 535.2 | ||||
a) The raising factor is estimated from various unspecified sources. (We thus assume that 10% of the landings are not covered by the sampling programme) | |||||
Sub-Table i Summing Sampled Provinces.
| ALL PROVINCES SAMPLED (PROVINCES A + B) | Total Landings Unit 1000 | Length Class | Total Length Freq. Unit 1000 | |
| MONTH 1 (JANUARY) | Species | |||
 | ||||
| Species 1 | 325.7 | lc = 1 | 1663.0 | |
| sp = 1 | lc = 2 | 1892.4 | ||
| lc = 3 | 4940.7 | |||
| Species 2 | 265.2 | lc = 1 | 936.0 | |
| sp =2 | lc = 2 | 1155.1 | ||
| lc = 3 | 1506.5 | |||
| Species 3 | 430.8 | lc = 1 | 2697.2 | |
| sp = 3 | lc = 2 | 2430.5 | ||
| lc = 3 | 1561.2 | |||
| Total | 1021.7 | |||
Sub-Table j Raising Sampled Provinces to Total Country.
| TOTAL COUNTRY (OR DIVISION OF COUNTRY) | Species | Total Landings Unit 10000 | Length Class | Total Length Freq. Unit 10000 |
| MONTH 1 (JANUARY) Raising factor = 1.13 | ||||
| ||||
| Species 1 | 36.8 | lc = 1 | 187.9 | |
| sp = 1 | lc = 2 | 213.8 | ||
| lc = 3 | 558.3 | |||
| Species 2 | 30.0 | lc =1 | 105.8 | |
| sp = 2 | lc = 2 | 130.5 | ||
| lc = 3 | 170.2 | |||
| Species 3 | 48.7 | lc= 1 | 304.8 | |
| sp = 3 | lc = 2 | 274.6 | ||
| lc = 3 | 176.4 | |||
| Total | 115.5 | |||
| TOTAL COUNTRY (OR DIVISION OF COUNTRY) | Species | Total Landings Unit 10000 | Length Class | Total Length Freq. Unit 10000 |
| MONTH 2 (FEBRUARY) | ||||
| ||||
| Species 1 | 24 | lc = 1 | 120 | |
| sp = 1 | lc =2 | 190 | ||
| lc = 3 | 210 | |||
| Species 2 | 31 | lc = 1 | 110 | |
| sp = 2 | lc = 2 | 140 | ||
| lc = 3 | 180 | |||
| Species 3 | 34 | lc = 1 | 205 | |
| sp = 3 | lc =2 | 199 | ||
| lc = 3 | 117 | |||
| Total | 89 |
(TIME SERIES FOR MODAL PROGRESSION ANALYSIS)
Sub_Table K Repeating the Exercise for Each Month
| TOTAL COUNTRY (OR DIVISION OF COUNTRY) | Species | Total Landings Unit 10000 | Length Class | Total Length Freq. Unit 10000 |
| MONTH 12 (DECEMBER) | ||||
 | ||||
| Species 1 | 32.2 | lc = 1 | 154.6 | |
| sp = 1 | lc = 2 | 226.0 | ||
| lc = 3 | 446.1 | |||
| Species 2 | 26.3 | lc = 1 | 79.4 | |
| sp = 2 | lc = 2 | 135.5 | ||
| lc = 3 | 139.3 | |||
| Species 3 | 35.0 | lc = 1 | 299.1 | |
| sp = 3 | lc = 2 | 252.8 | ||
| lc = 3 | 160.5 | |||
| Total | 93.4 |
Sub-Table 1 Summation over Months.
Total Annual Catch of Entire Country (or division of country)
| TOTAL COUNTRY (OR DIVISION OF COUNTRY) | Species | Total Landings Unit 10000 | Length Class | Total Length Freq. Unit 10000 |
| INPUT FOR VPA | ||||
| TOTAL YEAR SUMMATION OVER MONTHS | ||||
 | ||||
| Species 1 | 414.0 | lc = 1 | 2055.2 | |
| sp = 1 | lc = 2 | 2638.8 | ||
| lc = 3 | 6026.2 | |||
| Species 2 | 337.5 | lc = 1 | 1110.7 | |
| sp = 2 | lc = 2 | 1596.4 | ||
| lc = 3 | 1857.2 | |||
| Species 3 | 501.8 | lc = 1 | 3623.6 | |
| sp = 3 | lc = 2 | 3164.8 | ||
| lc = 3 | 2021.6 | |||
| Total | 1253.4 |
![]()
![]()
![]()