![]()
![]()
![]()
At the highest level, integrated pastoral resource assessment and development programmes must take account of the environmental, economic, social and political conditions of the area. The scope of information required therefore ranges from physical characteristics, such as topography, climate and edaphic conditions, through land use, forage resources, livestock statistics, management and production, to socio-economic conditions, markets and government services and policies. Sources of information are herders, land and livestock owners, local markets, research and extension staff, administrators, government departments and institutions, and personal field inspections. In order to facilitate cross-checking and ensure unbiased interpretation, as wide a range as possible of data sources should be used.
Government and institutions provide statistics, research findings and a general overview of pastoral production systems. Information from local pastoralists is important for ascertaining production system dynamics and constraints, livestock management regimes and for identifying practicable development options within the socio-economic limits. Examples of the potential contribution of local knowledge are listed in Box 8. Research and extension organizations provide information on the physical and biological environments and often have a wealth of field experience of development options. Records of failures in development, with their causal factors, are as valuable as those of success. Examples of pastoralist interview forms, which cover much of the land-user-sourced information, are presented in Appendix 3.
Box 8. Examples of local knowledge (based on FAO, 1990) Local knowledge is invaluable when compiling information on: |
The socio-economic conditions and attitudes of pastoralists affect the present and potential use of grasslands. Socio-economic information requirements include:
Community-based development groups and cooperatives are important sources of experience and information.
In the initial stages of pastoral resource assessment and development evaluation, it is necessary to identify and understand the functions, relationships and resources of those government and private institutions, and development and extension services associated with grassland and livestock production. Specialist institutions include those involved in grassland survey and development, ecology, pedology, soil and water conservation, dune control, forestry, water resources, along with agricultural colleges and universities and remote sensing laboratories. The capacities of government services, such as livestock production advisory units, veterinary stations, grassland research and development field stations and seed production farms, must be assessed, particularly in relation to development options. Information from these sources generally covers grassland survey and development programmes, pasture and fodder crop seed production activities, livestock and animal product market prices and trends, local market availability of seed, fertilizer, construction materials, supplementary feeds, feeds based on industrial by-products, livestock and animal product distribution and storage facilities.
Historical information on research and development operations extending beyond the immediate past, both within and adjacent to the project area, is invaluable. The outcome, success or failure, and lessons learned from these activities, is fundamental to the formulation of development options. Government policies on livestock production and grassland use may include forage or livestock development subsidies, enforced settlement of nomadic or transhumant herders, targets for livestock population growth, production quotas, control over land tenure, and grazing or grassland laws controlling all aspects of use. Roads, railways and telecommunications should be described in relation to the supply of inputs to pastoralists and output produce marketing.
Practicable development programmes can neither be confidently identified nor implemented without thorough knowledge of socio-economic conditions, government policy and government services. Such factors frequently override technical opportunities.
The scope and detail of the project area description should be designed according to the grassland resource assessment and development planning exercises being dealt with.
Show the location of the project area on maps in relation to national, provincial and county boundaries, administrative and market centres, and major communication routes. The landscape form should also be described, particularly in relation to physical characteristics, which govern, or limit, grassland resource use and livestock management. Such features include mountain ranges, plains, marshes, sand dunes, underground water resources and major watercourses. Topographical data should include altitude, aspect and slope.
Aerial photographs, remote sensing images and topographical maps must be of a scale appropriate to the size and objectives of the project. Scales between 1:10 000 and 1:250 000 are suited to farm and small- to medium-sized catchment projects, whereas scales of up to 1:750 000 are more appropriate for large county or regional investigations. Generally, the larger the scale the better, provided that the features relevant to the project are clearly defined and the limits of data quality are not exceeded.
General climatic data supports the interpretation of the environmental conditions and is used to define forage production limits, variability, risks, and the suitability of exotic fodders. Ideally, data should include: climatic class, temperature, precipitation (rain and snow), radiation, day length, sunshine hours, frost incidence, frost-free period, potential or actual evapotranspiration, relative humidity, moisture surplus/deficit patterns, growing season, dry season, periods of high winds and, in areas of cold winters, any season when the grazing may be under snow. The historical occurrence of catastrophic climatic events, such as droughts, floods and blizzards, should also be noted. Data sets of monthly precipitation and average maximum/minimum temperature for each climatic zone of the area, and for as many years as possible, can be analysed for variability, particularly of periods critical for plant growth. Historical trends in temperature and precipitation are used in the interpretation of long-term trends in grassland condition and the inter- and intra-year variability of grassland forage production. Data should be presented in tabular and graphical form, and be analysed statistically where possible.
The characteristics and distribution of soil types provide substantive information relating to land use patterns and highlight edaphic constraints to grassland and fodder crop productivity. This information is also necessary to assess suitability of plants proposed for introduction. As available, soil information should include: type, texture, structure, depth, water regime (including waterlogging), salinity and alkalinity, pH, organic matter, macro-nutrient levels in general, and limiting nutrients specifically.
Once the overall project area has been delineated and its general climatic and edaphic conditions described, tables and maps of land use should be compiled. These data are then used to identify land units, which are, in turn, the basis for analysing the forage resources and forage-livestock relationships.
Land-use classes include grazing land, forest, fodder cropland, general cropping and "wasteland." Areas that are unused should not be ignored. Grazing lands are most commonly classified according to physiognomically dominant vegetation types (e.g. whether pure grassland, shrub-based or savannah) or according to season of use. Cropping lands are generally classified according to crop type and whether rainfed or irrigated. Historical land use data will allow analysis of trends in land use and land capability. The main sources of land use and class data are government institutions, such as grassland survey or soil conservation units, and land users or owners. Forms of data include topographical maps, aerial photographs, satellite images and previous surveys and reports. Local knowledge is particularly important for the interpretation of land use patterns, since actual land use may be quite different, at the producer level, from that indicated at the macro-level in official land use maps or plans.
The detail required depends upon the scale and intensity of the assessment being carried out. Land use tables describing each land unit and other forage sources need only contain area data and have sub-groupings down to the level of the administrative unit relevant to development planning (e.g. county or township level). Presentation of other parameters, such as yields and characteristics of management, are better reserved for the detailed forage resource tables, which are described later.
Vegetation classes, along with distribution information, are an adjunct to general land use data sets. This information is necessary to characterize the project area, ascertain grassland condition and assess proper use factors. Floristic composition and vegetation class information, in effect, summarize the spatial environmental variability of the area. For each vegetation class information should include:
Box 9. Plant species composition assessment The recording of dominant plant species occurrence in order of visual abundance (ranking) within each vegetation type is quick and simple, and suitable where time is limited. The method provides adequate information on the status and character of grassland plant communities, and resultant data are appropriate for ordinal methods of statistical analysis. Specifically, plant associations and transitions of plant communities can be determined using this technique (Scott, 1989). |
Floristic information for each vegetation class can be related to patterns of use and, if indicator species are identified, to any history of misuse. It need only relate to dominant and indicator species, recorded in order of abundance (Box 9). The information is used as benchmark data for monitoring the impact of development. Detailed species lists are useful but are not an end in themselves.
The principal sources of vegetation class data, as for land use information, including maps, are government institutions. Local knowledge is an important source of information on the forage value of vegetation types (Table 1); at least some of this, especially primary and critical parameters, must be verified during direct field inspection.
Remote sensing images of vegetative cover (e.g. using the Normalized Difference Vegetation Index (NDVI) (Box et al., 1989)) are useful for relating the - often spatially limited - field observations of vegetation classes to their extent over the whole project area. Such imagery may also facilitate the updating of information. Improved forage sources, such as developed grasslands, pastures and fodder crops should be described, and other feed sources, such as crop residues, supplementary feeds and industrial by-products, identified.
Information on the spatial patterns of livestock use in the study area is essential for identifying the efficiency of grazing use, constraints within the forage production system, and for interpreting the status of the forage resource. General information on seasonal grazing patterns may be obtained from institutions, and specific information during field interviews. Grazing lands may be sub-divided according to: grazing land status (e.g. natural or improved), season of use, and form of pastoralism (e.g. nomadic, transhumant or sedentary). Grazing charts, such as those shown in Appendix 3, simplify the description of seasonal grazing patterns. For each land unit (e.g. seasonal grazing land) and each livestock class, a horizontal line representing the period of use is drawn, and annotated with livestock numbers. This information may then be converted to stocking loads and forage requirements to identify critical use patterns. The principal factors governing grazing distribution should be identified; they include topography, seasonal differences in availability of forage and palatability of different plant communities, seasonal flooding or weather characteristics.
Once all forage resource types and sources have been determined, those relating to land units (the base unit of the assessment) are evaluated to ascertain their condition, production constraints and development potentials. A comprehensive evaluation is time consuming and involves the assessment of many complex and interrelated components. Qualities and characteristics of grassland are presented, from FAO, 1991c, in Table 1. Since it is neither practicable nor warranted to quantify all parameters, the list is given as a secondary check when identifying key parameters in the area. The combined effects of all land evaluation parameters are expressed in current land use, vegetation type distribution, forage production and grassland condition and dynamics, and forage development potential.
Table 1. Land qualities and the characteristics by which they are measured or estimated (FAO, 1991c)
LAND QUALITY |
LAND CHARACTERISTIC |
PRIMARY PRODUCTION LEVEL | |
Forage growth | |
Radiation regime |
Total radiation, sunshine hours, slope angle, aspect, climatic class. |
Temperature regime |
Mean annual temperature, mean temperature in growing season, temperatures in hottest and coldest month, extreme air temperatures, soil temperatures, climatic class, altitude. |
Moisture regime |
Actual and potential evapotranspiration, mean annual rainfall, mean rainfall in growing season, moisture surplus/deficit, soil moisture regime. |
Oxygen availability to roots |
Soil drainage class, depth of mottling, permeability, infiltration rate, vegetation indicators, periods of water logging, periods of inundation. |
Nutrient availability |
Soil pH, total exchangeable bases, base saturation, nitrogen, "available" phosphorus, exchangeable potassium, other nutrients, total nutrients, topsoil thickness, diagnostic horizons, soil type. |
Rooting conditions |
Soil texture, structure consistence, effective depth, stones and gravel, rock outcrops, crusting, pans, surface sealing, diagnostic horizons, soil type vegetation indicators. |
Salinity/alkalinity |
Electrical conductivity of saturation extract, total soluble salts, exchangeable sodium percentage, soil type, vegetation indicators. |
Fire hazard |
Observed frequency and severity, length of dry season, rainfall, combustibility of ground vegetation, vegetation indicators. |
Flood hazard |
Flood frequency, discharge, topographical location. |
Frost hazard |
Frost incidence, length of frost period, altitude, aspect. |
Genetic potential of vegetation |
"Available" phosphorus, vegetation indicators, leaf:stem ratio, growth form, palatability. |
Management | |
Ease of control of undesirable species |
Vegetation indicators of unpalatable and poisonous plants, their percentage cover, type of dispersal, speed of dispersal. |
Potential for mechanization |
Slope angle, slope length, rock outcrops and boulders, drainage density, landform class. |
Size of potential land management units |
Sizes of blocks for extensive grazing. |
Conservation | |
Erosion hazard |
Rainfall intensity, erosivity, slope angle, slope length, soil texture, permeability, erodibility, vegetation cover, indices of water erosion, landslide occurrence, soil type, estimated soil loss. |
Tolerance to vegetation degradation |
Present condition of vegetation, vegetation type. |
SECONDARY PRODUCTION LEVEL | |
Growth | |
Availability of drinking water |
Moisture surplus or deficit, rainfall variability, presence of surface water sources, stream frequency, river flow regime, groundwater hydrology, groundwater depth, presence of aquifers, drinking water quality. |
Biological hazards |
Observed incidence of harmful plants, diseases and disease vectors, ticks, tsetse flies, competing herbivorous wildlife, predators. |
Climatic limitations |
Total radiation, sunshine hours, extreme high and low temperatures, frost incidence, relative humidity, wind speed. |
Accessibility to animals |
Altitude, slope angle, stones and rock outcrops, vegetation density, presence of thickets, flooding frequency and severity, landform class. |
Conditions for hay and silage |
Rainfall variability, moisture surplus, relative humidity, wind speed, botanical composition, carbohydrate assimilation type, floristic type of vegetation. |
Management | |
Ease of fencing and hedging |
Soil depth, surface stones and rock outcrops, flooding frequency, presence of termites, large wildlife species. |
Location |
Existing and potential accessibility, slope angle, drainage density, relative relief, distances from roads, presence of markets, distance to population centres. |
Baseline data requirements on forage resources are described below according to production and supply parameters, and grassland condition and dynamics. Data should be compiled at the land, forage or management unit level and represent all forms of forage, including natural and improved grazing lands, hay and silage lands, fodder crops, crop residues and supplementary feeds (grain or by-products). Because the data are fundamental to the resource assessment, their limits have to be understood, particularly in relation to variability and quality. The significance of the data set relative to a year of "normal" climatic conditions has to be understood so that deviations from the norm can be taken into account during analyses. Historical data sets, if available, should be compiled to facilitate the interpretation of trends and variability.
Factors influencing forage production are complex and interrelated (Box 10). The principal forage parameters required are yield, utilization and quality. Values of each of these parameters must reflect the inter- and intra-year variability in forage supply typical of many grasslands, particularly in arid and semi-arid environments.
Box 10. Factors influencing forage production and management (Heady and Heady, 1982) Growth Moisture, temperature, radiation, nutrients, oxygen for roots, surface
sealing, flood hazard, soil toxicities, salinization, vegetation genetic potential and fire
susceptibility. |
The importance of accurate forage yield information cannot be overstressed. Yield data are used for evaluating the condition and productivity of the project area, the status of forage-livestock relationships and for reviewing development options. Forage yield information is derived from local government sources (e.g. grassland surveys and research stations), interpreted from pastoralist interviews, or based on field estimates. Since "yield" can be expressed in many different ways, it is essential to standardize the form of yield information for all sources when compiling production data.
Frequently "yield" data are actually standing biomass from a single measurement during the growing season. Such data, even if collected near the end of the growing season, may be grossly misleading if used to imply annual yield. Values may be exaggerated or understated. For example, the forage dry matter (DM) production of annuals may be 150-200% higher than the standing biomass at any one time (FAO, 1991c). Conversely, the standing biomass in perennial grasslands may be higher than annual yield because of inter-year carryover.
Information, especially yield data, from research stations and state farms is not usually directly applicable to field situations because they are often located at sites of better soil and water endowment, receive greater technical inputs, and are subject to more intense management. Research plot yields are generally higher than those achieved under normal field conditions. Field estimates should avoid generalization from atypical areas, such as around watering points, roads and stock routes. Cross checking between data sources is necessary to identify aberrations.
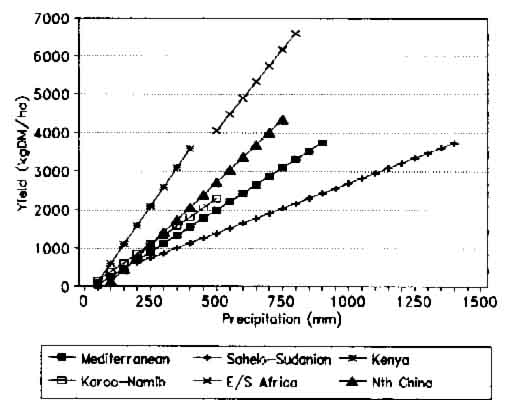
Where reliable grassland data are not available, yields may sometimes be predicted from environmental data. Sophisticated models, based on primary environmental factors, have been developed for this purpose (Box 11, on page 58). These models require information on temperature, precipitation, relative humidity, wind velocity, radiation and soil conditions. Full sets of environmental data are not usually available in project areas, so the potential use of such models is limited and their adoption in development programmes remains minimal (Matthews, 1998).
Simpler yield prediction models based on single parameters, particularly rainfall, are sometimes available. Regressions for grasslands in different regions of the world are presented in Figure 5. Such relationships should be interpreted with caution, particularly since there is often a high level of deviation of data points from the regression (Esselink et al.,1991) owing to heterogeneity of the other factors that influence grassland production, such as temperature, soil fertility, floristic composition and grazing management history. The last-named is often ignored in prediction models, despite its profound effect on grassland condition and productivity. It is often the more "deviant" grasslands that are of special interest in projects, so the "generalizations" of most forms of yield prediction models may be of limited use if applied directly.
Figure 5. Relationships between grassland yield and precipitation (FAO, 1991c; Ting-Cheng et al., 1990)
Where crop residue yield information is not available, the use of harvest indices, relating vegetative production to reproductive production (seed or grain yield), is an option. This is not always appropriate because the ratio of reproductive growth to vegetative growth for each species is likely to be affected by the heterogeneity of the crops in the project area. This method is very dependant on the accuracy of the yields claimed by farmers.
Two forms of utilization information are required for each grassland and pasture type: proper use factors (optimal or recommended levels of use); and current levels of use. Differences between the forms of utilization indicate under- or overexploitation of the grazing. Such information is obtained from local government sources (e.g. grassland surveys and research stations), pastoralist interviews and field visits. Estimates of proper use factors incorporate grazing efficiency (the proportion of total herbage that livestock can harvest), carryover losses between time of forage growth and consumption, forage losses due to trampling and fouling during period of consumption (note that losses associated with the longer-term carryover of standing forage before consumption occurs is dealt with separately), and the maximum proportion of forage that can be grazed without causing grassland deterioration (de Leeuw and Tothill, 1990). The last-named involves optimal levels of consumption of foliage that prevent yield depression in the short term, and minimize grassland nutrient depletion in the long term.
Table 2. Examples of proper use factors for different grassland types
PROPER USE FACTOR (%) |
GRASSLAND TYPE |
PROPER USE FACTOR (%) |
GRASSLAND TYPE |
AFRICAN RANGELAND (Box et al., 1989)) |
USA (contd) | ||
40 |
Sahel (% edible) |
40-50 |
Short-grass prairie, Northern mixed prairie, Southern mixed prairie |
30 |
Southern Ethiopia (% utilization) |
45-60 |
Tall-grass prairie, Southern pine forest, Eastern deciduous forest |
45 |
Dry season |
45-55 |
Cool-season pasture (western foothill and mountain)(1) |
MIDDLE EAST |
50-60 |
Irrigated perennial pasture |
|
50 |
Annual-grass-dominant grassland |
50-60 |
California annual grassland |
TIBETAN PLATEAU(4) (Qinghai, China) (IFAD, 1993b) |
60-70 |
Crested wheatgrass, Russian wild rye | |
45-60 |
Alpine vegetation |
(2) |
Seeded annual pasture, Crop aftermath |
55-70 |
Montane vegetation |
(3) |
Hay meadow aftermath |
35-50 |
Plains vegetation |
OTHER (Spain; Esselink et al., 1991) | |
UNITED STATES RANGELAND (Vallentine, 1990) |
80 |
Annual herbaceous vegetation, | |
20-30 |
Alpine tundra |
||
25-35 |
Southern desert shrub lands |
||
30-40 |
Northern desert shrub lands, Semi-desert grass and shrub lands, Sagebrush-grasslands, Pelouse prairie, Oak woodland and chaparral |
||
Notes: (1) Includes intermediate, pubescent and tall wheatgrass, smooth brome, and orchard grass. (2) Can be as completely utilized by the end of the grazing season as acceptable animal performance will permit. (3) Post-maturity grazing must be regulated only to the extent of preventing mechanical damage to the root crowns of perennial plants or undue exposure to frost damage. (4) Estimates. | |||
The estimation of proper use factors for grasslands is a complex process and carries the risk of misinterpretation due to generalization. Indicative values for a range of grasslands are presented in Table 2. Such values are influenced by local conditions and differences in livestock species, vegetation, soil and water conditions and the timing of grazing use relative to the forage growth season.
From the resource planning viewpoint, the important indices of forage nutritive quality are energy and protein content. The dynamics of these, for each forage type, give important insights into limitations of livestock production. Forage energy content is often used as the common denominator in forage-livestock balances and in complex models of pastoral systems. Often there is no specific information on the feeding values of forage for a project area so estimates have to be based on published data for homologous forages. Many standards for energy and protein contents are available (e.g. NRC, 1978, 1984, 1985). Examples for a range of forage types are given in Table 3. Some nutrient standards, including protein requirements for different kinds of livestock and forage mineral ratios, are given in Appendix 4.
Livestock production and associated activities may cause depletion of nutrients from grazing systems and, in the long term, lead to a reduction in the systems' carrying capacity. Mineral deficiencies, if they occur, may be detected through analysis of forage and comparison with relevant published standards. The nutritive status of a grazing area is influenced by both the ratios of minerals and their absolute concentrations. It is essential, when interpreting the nutritive value of forage, that variability within a forage type is accounted for in addition to gross forage type differences.
Physical and qualitative forage losses that occur between the period of growth and time of consumption by livestock, particularly in relation to winter or dry season grazing, are significant (Figure 6) and must be taken into account when analysing forage-livestock relationships. These losses relate to conserved forages as well as in situ pasture, and are due to natural processes of senescence, harvesting and storage, leaching and physical detachment.
In the arid zone of Niger, natural decomposition accounted for 30% of forage over nine dry months (5% per month) whereas in Mali a 50% decline over 5 months (13% per month) has been recorded (de Leeuw and Tothill, 1990). In Qinghai, China, an estimated 33% of total forage is lost due to carryover between time of growth and consumption (IFAD, 1993b). Within annual grasslands, DM losses may account for about 60-70% of annual production (Esselink et al., 1991). Levels of loss of forage quality are indicated by the ranges of values for energy and protein content of species listed in Table 3, where in the majority of cases the higher values represent freshly grown herbage and lower values senescent herbage.
Figure 6. Illustration of loss of palatable herbage as the season progresses.
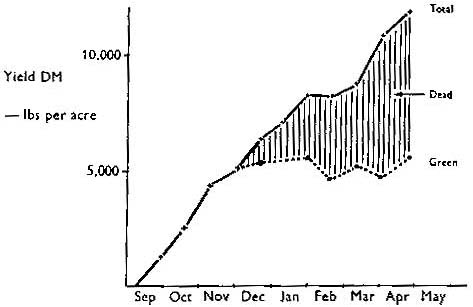
From the above information, nutritional losses between growth and consumption on some grasslands may be of the order of 30 to 70%. The importance of accounting for this when analysing forage resources is obvious.
Table 3. Examples of energy and protein contents for different forage types. (Harb, 1987; NRC, 1985)
FORAGE TYPE |
METABOLIZABLE ENERGY (MJME/kg DM) |
CRUDE PROTEIN (%DM) |
Acacia erioloba pods |
|
12.1 |
Note: Ranges of values shown for some species are due to differences in stage of growth and conservation technique. |
||
Grassland condition and dynamics are major issues in the assessment of grazing land for sustainable use (as discussed in Chapter 2), especially in relation to ecological thresholds, likely responses of the system to changes in grazing pressure, seasonality of production and the level and impact of inter-year variability of climate on system productivity.
Information on the seasonality of forage supply, is required to assess the nature of forage resources and feed balances, particularly in relation to livestock forage requirements. General information on grassland growth patterns, timing of harvest of fodder crops and availability of supplementary feeds can be obtained from grassland research, development and livestock production institutions. Pastoralist interviews will provide the detail, including patterns and trends of grassland and fodder crop production and the occurrence of forage deficits.
An index of the inter-year variability of forage production is essential for assessing the dynamics of the grasslands, especially in relation to livestock support capacities. Often this information is not available and has to be inferred from climate data.
Livestock population statistics are employed to evaluate trends in use and pressures on the grazing land. A synthesis of livestock data is used to estimate seasonal patterns of livestock forage requirements; this, in turn, permits the analysis of forage supply and demand relationships and contributes to the identification of critical periods and forage deficits.
The level of detail required depends, to a large extent, on the type of forage resource analysis to be carried out. Generally the following information is needed:
Livestock statistics are usually available from local government offices and should be to the lowest administrative unit (e.g. county or township). Other data generally have to be obtained by interviewing livestock owners and farmers, and from livestock markets, veterinary clinics and abattoirs. All livestock data must be reviewed critically before analysis, since population statistics are often very unreliable, with errors of from 20% to more than 50% common.
In addition to stock rearing, there are often other uses of grazing lands that may constrain livestock production and affect pastoral development options. These must be identified and assessed for their effects. Examples of parallel, and potentially competitive uses, are:
Data quality limits interpretation and the level of the analyses that can be carried out. Grassland-based systems are, by nature, heterogeneous in composition, highly variable and generally poorly documented. The information available may not reflect the heterogeneity and dynamics of the system accurately. Single-year data sets are often used, incorrectly, to represent long-term norms, and measurements from specific sites are extrapolated to larger, dissimilar areas. National statistics on the traditional livestock sub-sector are notoriously unreliable (Moris, 1986).
Forage resources and forage-livestock relationships should be analysed within the limits dictated by data quality. Analyses at the herder or household level are frequently not realistic, although they are often required by funding agencies. Falsities, distortions and aberrations in data should be detected by careful cross-checking to prevent their being carried over into data analysis and project planning.
Some potential sources of data misinterpretation are:
A range of general purpose and specialist tools is available for information recording and data analysis. Whatever is chosen, they must be compatible with the scope, detail and quality of available data sets, the levels of local expertise, and also with project schedules and budgets. Some general purpose and specialist tools are described below. The use of modelling for pastoral resource analysis and development planning is discussed in Chapter 5.
Spreadsheets are now universally used for data compilation, primary statistical analyses and tabular and graphic presentation of data. The most popular spreadsheet programmes are Quattro ProTM, ExcelTM and Lotus 123TM.
Special-purpose project analysis programmes are used by the World Bank, FAO Investment Centre and IFAD. These include (FAO, 1991b):
- PC-COSTAB (PC-COMPASS module) for project costing.
- COSTBEN (PC-COMPASS module) for cost-benefit analysis.
- PC-FARMOD (PC-COMPASS module) for analysis of farm models.
- MANIP for financial calculations.
- MADS III for data collection and analysis.
- LIVMOD III for analysis of herd/flock evolution, with cost-benefit analysis.
The relevance of statistical procedures to forage resource assessment depends on the data sets and intended use of the resultant information. Within the context of development planning, the frequent paucity of suitable data sets precludes sophisticated analyses; therefore simple means, comparisons, trends and graphical representations are mainly used.
Sophisticated statistical techniques can be extremely useful for general quantification of the resources, identifying the interrelationships between parameters, and reclassification of land units according to varying combinations of physical and biological factors. SYSTATTM (and SYGRAPHTM), SASTM and SPSSTM are popular and well-proven statistical packages for PC-based computer analysis.
Cluster analysis is a useful statistical technique for grouping samples of data into like kinds by calculating relative similarities (Cook, 1987; Hardiman et al., 1990). Within the context of resource assessment and development planning, land qualities may be used to group land units. While techniques such as principal component analysis may be used for this type of analysis, cluster analysis has the advantage of a simple graphical output (a dendrogram) that can be interpreted by lay people. Average linking method and Pearson or Euclidean correlation matrix forms of cluster analysis are appropriate for land systems data.
Remote sensing images of vegetation (e.g. using NDVI (Box et al., 1989)) and land cover are useful for mapping the distribution of vegetation types, land use and water resources. Sources of remotely sensed data are (FAO, 1991b):
Geographical Information System (GIS) technology, in association with detailed land use surveys or remote sensing data, is a valuable tool for the modelling and analysis of land systems and therefore useful in development planning and management. GIS integrates attribute databases (statistics, classes, etc.) with cartographic databases (maps, aerial photographs and satellite images) and facilitates map overlaying, distance analysis, calculations per unit area and environmental monitoring. Low cost, sophisticated GIS systems are now available for PCs, e.g. MapMaker and ESRI ArcView.
Examples of the use of GIS are found in Chapter 6, and in the IFAD Environmental Assessments in Ecuador and Namibia (IFAD (FIDA), 1992; IFAD, 1993c). In Namibia, the following components were analysed using GIS:
The disadvantage of GIS is the prerequisite of detailed and accurate survey information, and the time required to set up the system. A GIS using satellite imagery, field data and pastoral resource modelling, once operational, is extremely useful during development planning and for ongoing monitoring of the impact of development.
Despite their usefulness, the tendency for projects to establish very expensive (US$ 20 000 to $ 150 000) and complicated GIS units which require major off-site training programmes and continual technical support requirements has to be reviewed critically from a cost-benefit viewpoint. This is particularly so since very good systems are available that do ninety-five percent of the work for a fraction of the cost (less than US$ 3 000) and resource requirements.
![]()
![]()
![]()