![]()
![]()
![]()
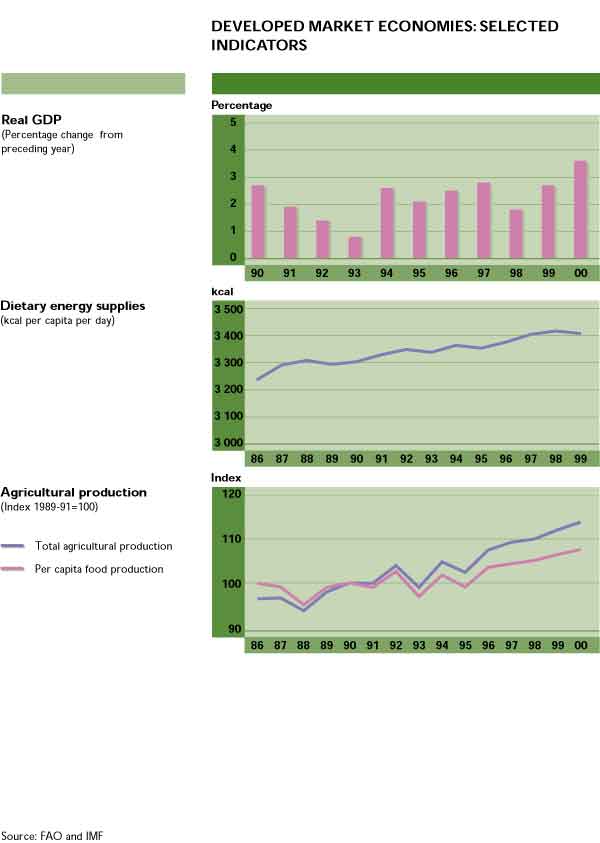
Average real GDP in the developed market economies121 grew at 3.2 percent in 1999 after a more modest 2.4 percent growth in output in 1998. As global economic activity rebounded relatively swiftly following the emerging market crises of 1997 and 1998, all developed market economies experienced a rise in GDP in 1999.
The United States continued to experience rapid economic expansion, with 4.2 percent GDP growth in 1999, the third consecutive year of real GDP growth of more than 4 percent. In Canada, GDP also expanded strongly, at 4.5 percent. Growth remained somewhat more subdued in the European Union, which recorded a relatively modest growth of 2.4 percent in 1999. Japan halted the 2.5 percent contraction in GDP recorded in 1998, but its level of economic activity remained stagnant in 1999. Australia experienced real GDP growth of 4.4 percent after the 5.2 percent growth rate it had recorded in 1998.
As reported in the World Review of this issue, economic activity in the developed market economies strengthened further in 2000, with GDP growing at an estimated 4.2 percent and most countries expecting to record higher growth rates. Canada and the United States are estimated to have seen output expand by 4.7 and 5.2 percent, respectively. In the European Union, strong domestic demand and a lower euro/US dollar exchange rate helped stimulate economic growth to reach an estimated 3.4 percent. Real GDP growth accelerated particularly strongly in Germany and Italy. Increased export demand resulting from the global recovery and the low euro exchange rate were the main factors driving the recovery in developed market economies. In Japan, some economic recovery seemed to be under way, with GDP growth estimated to be 1.4 percent, but many uncertainties about the country's recovery remain. Relatively robust growth rates of about 4 percent in 2000 are estimated for Australia and New Zealand, with the latter depending more on favourable external factors.
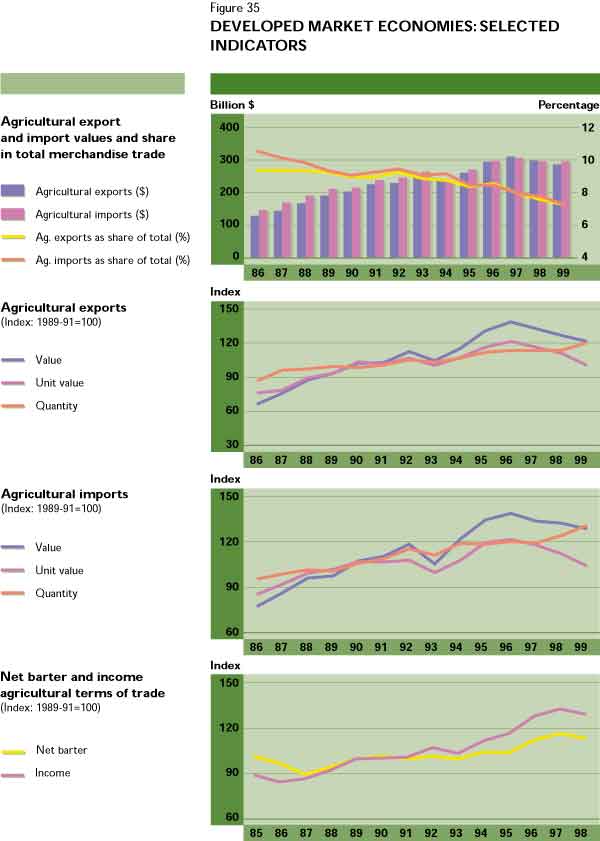
Overall agricultural output in the developed market economies rose by 1.8 percent in 1999 after a modest increase of less than 1 percent in the previous year. Crop and livestock production increased by 1.8 and 1.6 percent, respectively, although cereal output fell by 2.8 percent in 1999. Preliminary estimates for 2000 suggest a more moderate expansion of agricultural output of less than 1 percent. However, cereal production is expected to recover, growing at approximately 3 percent.
A good production performance was recorded by EC countries, where agricultural output grew by 2.2 percent in 1999, after stagnating in 1998. Cereal production, however, contracted by 4.6 percent and wheat production, in particular, fell by 6 percent because of increased set-aside requirements and adverse weather conditions. Nevertheless, with relatively good performances for other crops, the EC's overall crop output increased by 3.4 percent. Livestock production, on the other hand, increased by only 0.5 percent. Weak output performances were recorded in France and the United Kingdom, where agricultural output expanded by less than 0.5 percent in 1999, but in Germany, Italy and Spain overall agricultural output grew by between 1.5 and 5.5 percent. In 2000, agricultural output in the EC is provisionally estimated to contract marginally, by less than 0.5 percent. However, cereal output is expected to recover and to grow at a rate of about 7 percent, with all of the larger producers, except for Italy, recording increased cereal production.
In North America, production rose by 1.9 percent in 1999 after a 1.3 percent increase in 1998. In the United States, output rose by 1.3 percent in 1999, after posting growth of less than 1 percent the previous year. Cereal production fell by 4.1 percent, following an expansion of 3.9 percent in 1998. Wheat production, in particular, fell by about 9 to 10 percent as a result of reduced plantings. Production growth in 1999 was stronger in Canada, where agricultural output expanded by about 6 percent for the second consecutive year. Cereal production grew at rates of 5.7 and 3.9 percent in 1999 and 1998, respectively, but without returning to the record level of 1996 after the 16 percent drop in 1997. In 2000, overall agricultural output in North America is anticipated to expand by about 2 percent as a result of an increase of slightly more than 2 percent in the United States and stagnant production in Canada.
Table 41
NET PRODUCTION GROWTH RATES IN DEVELOPED MARKET ECONOMIES
Year |
Agriculture |
Cereals |
Crops |
Food |
Livestock |
Non-food |
(Percentage) | ||||||
Developed market economies |
||||||
1997 |
1.5 |
-2.1 |
2.1 |
1.4 |
0.6 |
5.0 |
1998 |
0.8 |
3.3 |
0.0 |
1.3 |
1.9 |
-11.7 |
1999 |
1.8 |
-2.8 |
1.8 |
1.6 |
1.6 |
6.5 |
20001 |
0.9 |
3.1 |
0.7 |
1.0 |
0.6 |
-1.1 |
EC |
||||||
1997 |
0.0 |
-0.7 |
1.0 |
-0.1 |
-0.5 |
6.8 |
1998 |
0.1 |
3.4 |
-1.0 |
0.1 |
1.8 |
1.5 |
1999 |
2.2 |
-4.6 |
3.4 |
2.2 |
0.5 |
5.3 |
20001 |
-0.3 |
7.0 |
0.3 |
-0.3 |
-0.8 |
-0.1 |
North America |
||||||
1997 |
3.2 |
-1.8 |
3.6 |
3.2 |
1.3 |
2.3 |
1998 |
1.3 |
3.9 |
0.7 |
2.3 |
2.4 |
-21.5 |
1999 |
1.9 |
-2.8 |
0.4 |
1.5 |
3.6 |
12.9 |
20001 |
2.1 |
1.3 |
1.5 |
2.2 |
1.6 |
-2.1 |
Oceania2 |
||||||
1997 |
2.4 |
-10.9 |
-2.2 |
1.2 |
4.6 |
9.4 |
1998 |
3.4 |
3.5 |
7.2 |
4.1 |
1.7 |
-0.7 |
1999 |
0.1 |
5.6 |
6.2 |
0.5 |
-1.5 |
-2.0 |
20001 |
1.6 |
-1.2 |
-3.9 |
1.8 |
2.7 |
-0.1 |
Japan |
||||||
1997 |
-0.7 |
-2.6 |
1.5 |
-0.7 |
-2.1 |
2.4 |
1998 |
-3.4 |
-10.4 |
-7.9 |
-3.3 |
0.9 |
-8.6 |
1999 |
0.8 |
2.8 |
1.8 |
0.8 |
-0.5 |
3.8 |
20001 |
0.3 |
2.5 |
0.8 |
0.3 |
-0.2 |
0.0 |
1 Estimates. | ||||||
In the Oceania region, agricultural output stagnated in 1999 after rising by 3.4 percent in 1998. Australian output grew by nearly 2 percent in 1999, but production in New Zealand dropped by 5.1 percent. In 2000, overall output is estimated to expand by 1.6 percent. The increases will mainly be in the livestock sector. Crop production is likely to decline by nearly 4 percent. Australian output is expected to be up by about 0.5 percent, while production in New Zealand is estimated to rise by about 4.5 percent. Japanese agricultural production rose by less than 1 percent in 1999, after contracting in 1998. Crop and cereal production recovered somewhat from the sharp fall experienced in 1998. In 2000, overall output is estimated to rise by less than 0.5 percent.
Over the last decade or so, developed market economies have introduced various forms of agricultural policy reforms, but these have varied widely in terms of the depth of reform, the range of measures adopted and timing. Under the WTO Agreement on Agriculture (at the conclusion of the Uruguay Round of multilateral trade negotiations in 1994), countries committed themselves not only to improving market access for agricultural imports but also to a gradual reduction in export subsidies and trade-distorting domestic support. Many countries have introduced policy changes aimed at reducing levels of support and shifting towards more targeted measures. However, policy reform is still an ongoing process.
Table 42
OECD INDICATORS OF SUPPORT TO AGRICULTURE1
Indicator |
1986-1988 |
1998-2000 |
1998 |
1999 |
20002 |
PSE |
|||||
Billion $ |
236 |
258 |
253 |
273 |
245 |
Percentage PSE |
39 |
35 |
34 |
37 |
34 |
TSE |
|||||
Billion $ |
8 |
340 |
339 |
356 |
327 |
Percentage TSE |
2.2 |
1.3 |
1.4 |
1.4 |
1.3 |
1 All OECD countries. | |||||
In 1999, overall support to agriculture for all the OECD countries, measured by OECD's total support estimate (TSE) (see Box 4), amounted to $356 billion, or about 1.4 percent of their aggregate GDP. This figure has remained fairly steady in the last three years but is lower than the average 2.2 percent of GDP recorded in the 1986-1988 period. In 2000, TSE is estimated to have fallen to about $327 billion.
Support to agricultural producers in all OECD countries, as measured by OECD's producer support estimate (PSE) (see Box 4), increased in 1999 for the second year running. This was mainly due to widening price gaps between domestic and international markets, with declining international prices of agricultural products. The percentage PSE ranged from less than 1 percent in New Zealand to more than 60 percent in some countries. The level of support also varies across commodities, with rice, milk and sugar receiving the highest levels of support.
Box 4 OECD INDICATORS OF SUPPORT OECD uses a number of indicators to measure support to agriculture. Two key indicators are the producer support estimate (PSE) and the total support estimate (TSE), defined here. Producer support estimate This measure indicates the annual monetary value of gross transfers from consumers (resulting from domestic prices being kept above world market levels) and from taxpayers to agricultural producers. It is also expressed as percentage PSE, i.e. as a percentage of gross farm receipts. Total support estimate This measures indicates the annual monetary value of all gross transfers from taxpayers and consumers arising from policy measures that support the agriculture sector. It includes transfers to producers (PSE) and general services provided to agriculture. The percentage TSE indicates the burden that this overall support represents as a percentage of GDP. |
In 2000, however, support to producers is estimated to have fallen to about 34 percent of gross farm receipts, 5 percent below the 1986-88 average. Support decreased in most countries and for most commodities, mainly because of the smaller gap between domestic and world prices, since the latter had increased in 2000. Although some changes to support prices did take place in a number of countries, no new policy mechanisms to lower support prices were introduced. The United States extended assistance to crop farmers to compensate for low world prices for the third consecutive year, and Canada granted payments for the same reason.
In 2000, several EC member countries as well as Australia and Japan established multiyear plans covering the agriculture sector and a number of support measures. In general, the plans focused on structural change, rural development and environmental quality, although the Japanese programme aimed at increasing food self-sufficiency to 45 percent by 2010, compared with 40 percent in 1998.
On agricultural trade policy, implementation of the Agreement on Agriculture continued in 1999 and 2000. Reductions in tariffs and expansions in tariff quota access advanced in line with the agreed commitments, although some countries raised tariffs within their commitment levels or under the special safeguard provisions. Total levels of export subsidies also declined in 2000, mainly in the EC, owing to a rise in world prices.
Against growing concern among consumers, the issue of improved food safety has continued to gain momentum. Almost all developed market economies have either made, or are in the process of making, changes to their food safety regulations, including measures to address concerns related to biotechnology. Food safety issues are increasingly being addressed with reference to the Codex Alimentarius Commission and its parent bodies, WHO and FAO. A number of countries have created food safety agencies and the EC has agreed to establish the European Food Authority to oversee food safety issues. The EC, Japan and Switzerland have also introduced labelling requirements for products derived from genetically modified organisms (GMOs).
A number of new policy measures introduced in 2000 were a response to natural disasters or concern about animal, plant and human health. Bovine spongiform encephelopathy (BSE) was the most significant of these emergencies and led to a number of measures aimed at reducing the risk to human health. The EC took a series of measures in response to BSE, including a trade ban on feed containing meat and bone meal and compensatory income support measures to affected farmers. More recently, the outbreak of foot-and-mouth disease in Europe early in 2001 has led to an extensive range of measures aimed at preventing the spread of the disease, but also to support farmers.
The environmental effects of agriculture have continued to be of concern in recent years. Many countries have increased their budgets for existing agri-environmental programmes and several have introduced new programmes, focusing on resource conservation and organic farming. The EC decided, as part of Agenda 2000, that farmers must meet environmental standards set by each Member State in order to qualify for funding under certain programmes. New policies aimed at improving water quality were introduced in Australia, Denmark and the Netherlands. Italy, the Netherlands, the United Kingdom and the United States also introduced initiatives in favour of organic farming.
The year 2000 marked the final year for implementation of the WTO Agreement on Agriculture. Current levels of agricultural support in developed market economies are still high and continue to encourage domestic production, distort trade and depress world prices. It is estimated that the prices received by their farmers were on average 43 percent above world market prices. Nevertheless, according to OECD, this overall level of market protection in developed market economies had fallen from 61 percent in 1986-88, partly as a result of efforts to achieve WTO commitments. Domestic price support measures have been gradually shifting towards less market-distorting measures, but progress has been very limited in some countries. Although the decline in support indicators in 2000 suggests a movement towards greater market orientation, the gap between countries with the highest and lowest levels of support is widening. The resumption of agricultural trade negotiations within WTO provides an opportunity to accelerate the policy reform process and help the agriculture sectors of most of the developed market economies to become more market-oriented.
NOTES
1 The macroeconomic data in this section are drawn from IMF. 2000. World Economic Outlook, September. Washington, DC.
2 Unless indicated otherwise, the sources for AIDS statistics in this section are: UNAIDS/WHO. AIDS epidemic update: December 1998 and December 2000; and UNAIDS. Report on the global HIV/AIDS epidemic: June 2000. Geneva.
3 J. Decosas. 1996. HIV and development. Special edition of AIDS, 10 (Supplement 3): 69-74.
4 UNAIDS/WHO. AIDS epidemic update: December 1998. Geneva.
5 UNAIDS, op. cit., note 2.
6 Ibid.
7 DALYs are used to measure the cost of disease. Calculations include the disability effects as well as the mortality effects of disease, and age weights are used to discount the importance of infant and elderly deaths.
8 UNAIDS/WHO. 2000. Op. cit., note 2.
9 L. Bollinger and J. Stover. 1999. The economic impact of AIDS. Glastonbury, Connecticut, USA, The Futures Group International.
10 FAO. 1994. What has AIDS to do with agriculture? By M. Haslwimmer. Rome.
11 Op. cit., note 5.
12 Op. cit., note 10; and FAO. 2000. HIV/AIDS in Namibia: the impact on the livestock sector. By I.E. Engh, L. Stloukal and J. Du Guerny. Rome.
13 Cited in FAO.1994. Is HIV/AIDS a threat to livestock production? The example of Rakai, Uganda. By M. Haslwimmer. Rome.
14 Op. cit., note 4.
15 Op. cit., note 13
16 World Bank estimate for 1999.
17 Droughts have occurred in Ethiopia many times throughout history. See P. Webb and J. von Braun. 1994. Famine and food security in Ethiopia: lessons for Africa. Chichester, UK, John Wiley & Sons.
18 The agricultural policies pursued in the 1974-1991 period are discussed in FAO. 1993. The State of Food and Agriculture 1993. Rome.
19 Economist Intelligence Unit. Ethiopia: country profile 2000. London.
20 FAO. 2000. The State of Food Insecurity in the World 2000. Rome.
21 Ibid.
22 Central Statistical Authority. 1993. Report on the National Rural Nutrition Survey, Core Module. Statistical Bulletin, No. 113. Addis Ababa.
23 Chronic malnutrition is not only related to food availability and is even found in regions with a food surplus. See, for example, D.L. Pelletier, K. Deneke, Y. Kidane, B. Haile and F. Negussie. 1995. The food-first bias and nutrition policy: lessons from Ethiopia. Food Policy, 20: 279-298.
24 The source for data in this section is World Bank. 1998. Ethiopia: the social sector note. Report No. 16860-ET. Washington, DC; and UNICEF statistics (available at www.org.unicef).
25 Unless indicated otherwise, the data in this section are drawn from IMF, op. cit., note 1.
26 IMF. 1999. Ethiopia: recent economic developments. IMF Staff Country Report No. 99/98. Washington, DC.
27 World Bank estimate for 1999.
28 The Ethiopian Government is currently an Observer at the World Trade Organization (WTO).
29 Op. cit., note 26.
30 Ibid.
31 World Bank, op. cit., note 24.
32 IMF. 1998. Ethiopia - Enhanced structural adjustment facility medium-term economic and financial policy framework paper, 1998/99-2000/01. Washington, DC.
33 Ethiopia is the area of origin of Eragrostis tef. Accounting for approximately 31 percent of the area under cereals, it is the main cereal crop and is used to make enjera, a pancake-like staple food.
34 Central Statistical Authority. 1999. Agricultural Sample Survey 1998/99, Volume 1: Report on Area and Production for Major Crops. Statistical Bulletin No. 200. Addis Ababa.
35 FAOSTAT (available at www.fao.org).
36 Ibid.
37 Qat is a mild stimulant which, like coffee, is largely grown in southern areas and is mainly exported to countries in the Near East. In 1995/96, it constituted about 7 percent of Ethiopia's foreign trade.
38 Central Statistical Authority. 1999. Ethiopia: Statistical Abstract 1998. Addis Ababa.
39 Op. cit., note 35.
40 FAO. 1986. Ethiopian highlands reclamation study. Final report. 2 vols. Rome.
41 World Food Programme Ethiopia. 1998 Annual Report. Addis Ababa, United Printers.
42 Ibid.
43 M. Demeke, A. Said and T.S. Jayne. 1997. Promoting fertilizer use in Ethiopia: the implication of improving grain market performance, input market efficiency and farm management. Working Paper No. 5, Grain Market Research Project, Michigan State University, USA and Ministry of Economic Development and Cooperation, Addis Ababa.
44 Op. cit., note 38.
45 Op. cit., note 38.
46 M. Demeke. 1999. Agricultural technology, economic viability and poverty alleviation in Ethiopia. Paper presented at the Workshop on Agricultural Transformation in Africa, 27-30 June 1999, Nairobi, Kenya. Egerton University Tegemeo Institute and Michigan State University.
47 Sasakawa-Global 2000 (a collaborative initiative of the non-governmental Sasakawa Africa Association and Global 2000) has refocused its activities to carry out research on minimum tillage, quality protein maize, Striga in sorghum, and threshing machines, which are areas where the government is not active.
48 Eighty percent of fertilizer sales transactions are through credit.
49 Figures on fertilizer consumption were provided by the National Fertilizer Industry Agency.
50 Farmers participating in FAO's Special Programme for Food Security achieved, on average, yield increases of more than 100 percent for teff, sorghum and wheat.
51 Oromia region accounts for about 50 percent of the national fertilizer market.
52 Figures refer to 1994.
53 Op. cit., note 19.
54 The Belg crop accounts for between 5 and 10 percent of total cereal production. However, in some areas it provides the bulk of the annual food supply.
55 FAO/WFP. 2001. Special report: FAO/WFP crop and food supply assessment mission to Ethiopia, 9 January 2001. Rome.
56 The EFSR maintains a rotating stock of 283 000 tonnes of cereals.
57 Unless indicated otherwise, macroeconomic data and projections in this section are drawn from IMF. 2000. World Economic Outlook, October 2000. Washington, DC.
58 AsDB. 2000. Asia Recovery Report, October. Manila.
59 World Bank. 2000. East Asia. Recovery and beyond. Washington, DC.
60 World Bank. 1998. East Asia. The road to recovery. Washington, DC.
61 Op. cit., note 59.
62 FAO. 1999. The State of Food Insecurity in the World 1999, Rome.
63 J.C. Knowles, E.M. Pernia and M. Racelis. 1999. Assessing the social impact of the financial crisis in Asia: integrative report. Manila, AsDB.
64 The exchange rates of local currencies against the US dollar fell by as much as 70 percent in Indonesia and between 30 and 50 percent in Malaysia, the Republic of Korea and Thailand during 1997 and 1998. The rates recovered later to some extent but remained at between 30 and 50 percent below their pre-1997 levels.
65 World Bank. 2000. World Development Indicators 2000. Washington, DC.
66 Ibid.
67 FAOSTAT (available at www.fao.org), data for 1998.
68 FAO. 1997. Asia-Pacific Forestry Outlook Study. Country Report - Viet Nam. Working Paper No. AFPSOS/WP/31. Bangkok, FAO Regional Office for Asia and the Pacific.
69 FAO/UNDP. 1995. Agriculture in post-transition Viet Nam: opportunities and challenges. TSS-1 Report VIE/95/01T. Bangkok, FAO Regional Office for Asia and the Pacific.
70 The agricultural population is defined as all people who depend on agriculture, hunting, fishing or forestry for their livelihood. This estimate comprises all people actively engaged in agriculture as well as their non-working dependants.
71 Op. cit., note 65.
72 UN Economic and Social Commission for Asia and the Pacific. 1995. Macroeconomic reforms in the economies in transition. Development Paper No. 18. New York, UN.
73 P. Wolff. 1999. Viet Nam - the incomplete transformation. German Development Institute Book Series No. 12. London, Frank Cass Publishers.
74 Ibid.
75 General Statistical Office. 1999. Viet Nam Living Standards Survey
1997-98. Hanoi.
76 For an overview of the collectivization process and subsequent policy reforms, see Tran Thi Que. 1998. Viet Nam's agriculture. The challenges and achievements. Singapore, Institute of Southeast Asian Studies.
77 Ibid.
78 This information was provided by officials of the Vietnamese Ministry of Agriculture and Rural Development.
79 Another distinct set of problems is related to the lack of an adequate legal and administrative framework for the functioning of a market economy. For an overview of the requirements for a legal framework, see UNDP. 1999. Completion of Viet Nam's legal framework for economic development. UNDP Discussion Paper No. 2. Hanoi.
80 See IMF. 1999. Viet Nam: selected issues. IMF Staff Country Report No. 99/55 (July 1999).
81 For a description of the index, see IMF. 1998. Trade liberalization in IMF-supported programs. World Economic and Financial Surveys. Washington, DC.
82 Op. cit., note 80.
83 Ibid.
84 IMF. 2000. World Economic Outlook, September. Washington, DC.
85 About one-third of the total agricultural labour force was landless (see S. Barraclough, 1973. Agrarian structure in Latin America. Lexington, Massachusetts, USA, Heath).
86 A. de Janvry, E. Sadoulet and W. Wolford. 1998. The changing role of the state in Latin American land reforms. Berkeley, USA, University of California.
87 This index ranges from zero when all holdings have the same area, to unity, when the total agricultural area is operated by one holding. For example, the Lorenz Index was 0.85 in 1985 in Brazil, 0.86 in 1994 in Peru, 0.88 in 1993 in Argentina and 0.93 in 1991 in Paraguay.
88 F. Vogelgesang. 1996. Property rights and the rural land market in Latin America. CEPAL Review, 58.
89 Op. cit., note 86.
90 World Bank. 1997. Project appraisal for a land reform and poverty alleviation pilot project. Report No. 16342. Washington, DC.
91 J. Heath and K. Deininger. 1997. Implementing "negotiated" land reform:the case of Colombia. Paper presented at the LAC Cross-fertilization Seminar, 6 March 1997.
92 C. Deere and M. Leon. 1997. Women and land rights in the Latin American neo-liberal counter-reforms. Working Paper No. 264. Michigan State University, USA.
93 Guatemala is characterized by an extremely high degree of minifundismo, which affects its indigenous population in particular. Between 1964 and 1979, farms of less than 0.7 ha tripled in number and grew from 20 to 40 percent of the total farm households. Over the same period, the average holding in this category shrank from 0.4 to 0.25 ha.
94 P. Parera. 1998. A literature review of eight country experiences with agrarian and land tenure reforms in Latin America. Unpublished document prepared for the FAO Regional Office for Latin America and the Caribbean.
95 Instituto Brasiliero de Geografia e Estatística (IBGE). 1985. Cited in A.de Janvry, E. Sadoulet and W. Wolford, op. cit., note 86.
96 P. Groppo. 1996. Agrarian reform and land settlement policy in Brazil: historical background. Available at: www.fao.org/sd/LTdirect/Ltan0006.htm.
97 A. Buainain. Structural adjustment and financial crisis in Brazil: impacts on agriculture and food security. FAO Working Paper (in preparation).
98 K. Deininger. 1998. Making market-assisted land reform work: initial experiences from Colombia, Brazil and South Africa. World Bank.
99 According to a 1997 official government document (cited in A. Buainain, op. cit., note 97), the cost can reach $40 000 per family; according to a joint report by INCRA and FAO, the cost per family is $23 000. The cost of purchasing land itself is estimated to average $11 600 per family (K. Deininger, op. cit., note 98).
100 First implemented in Ceará State, the programme was expanded to cover Bahia, Maranhão, Minas Gerais and Pernambucco. A similar approach is being applied with IFAD support in the State of Sergipe.
101 Op. cit., note 97.
102 The Word Bank has guaranteed funding of up to $1 billion, while the Brazilian Government will pay the remaining $1 billion.
103 Op. cit., note 98.
104 IRAM/Groupe Croissance. 1998. La tarification des principaux produits agricoles en République d'Haïti. Paris.
105 The macroeconomic data in this section are drawn from IMF. 2000. World Economic Outlook, September. Washington, DC; EIU. 2000. Country Forecast: Middle East and North Africa: Regional Overview, December, London; and EIU individual country reports.
106 For example, the Arab Common Market (ACM), the Council of Arab Economic Unity (CAEU), the Gulf Cooperation Council (GCC), the League of Arab States, the Arab Maghreb Union (AMU), the Economic Cooperation Organization (ECO), the Organization of the Islamic Conference (OIC). In addition, in 1996 all Arab countries signed the agreement founding the Arab Free Trade Area.
107 GCC countries include Bahrain, Kuwait, Oman, Qatar, Saudi Arabia and the United Arab Emirates.
108 J.A. Allan. 1999. A convenient solution. UNESCO Courier, February.
109 FAO. 1997. Water resources of the Near East region: a review. Rome.
110 IMF. 2000. World Economic Outlook, September. Washington, DC.
111 Central and Eastern Europe refers to the Eastern European countries as well as the Baltic states.
112 J. Kornai. 1994. Transformational recession: the main causes. Journal of Comparative Economics, 19(1): 39-63; O. Blanchard. 1997. The economics of post-communist transition. Oxford, UK, Clarendon Press; S. Gomulka. 1998. Output: causes of the decline and the recovery. In P. Boone, S. Gomulka and R. Layard, eds. Emerging from communism: lessons from Russia, China and Eastern Europe. Cambridge, Massachusetts, USA, MIT Press.
113 The aggregates of Figure 32 conceal the variation in GDP and agricultural production growth among countries within each group.
114 See, for example, S. Gomulka, op. cit., note 112.
115 See M. De Melo, C. Denizer and A. Gelb. 1997. From plan to market: patterns of transition. In M. Blejer and M. Skreb, eds. Macroeconomic stabilization in transition economies. Cambridge, UK, Cambridge University Press.
116 The aggregate growth figures for the Central and Eastern European region exclude Serbia, Montenegro, Kosovo and Bosnia and Herzegovina, for which GDP data are lacking.
117 K. Macours and J. Swinnen. 2000. Impact of initial conditions and reform policies on agricultural performance in Central and Eastern Europe, the Former Soviet Union and East Asia. American Journal of Agricultural Economics, 82(5): 1149-1155.
118 C. Csaki and A. Fock. 2000. The agrarian economies of Central-Eastern Europe and the Commonwealth of Independent States: an update on status and progress. ECSSD Environmentally and Socially Sustainable Development Working Paper No. 24. 3 June 2000. Washington, DC, World Bank.
119 These data are from OECD and the World Bank.
120 OECD. 2000. Agricultural Policies in OECD Countries: Monitoring and Evaluation 2000. Paris.
121 Excluding South Africa.
122 This section draws on OECD. 2000 and 2001. Agricultural Policies in OECD Countries: Monitoring and Evaluation. Paris; and other OECD data.
![]()
![]()
![]()