![]()
![]()
![]()
G. Martín, F. Reyes, I. Hernández, and M.
Milera
Estación Experimental de Pastos y Forrajes "Indio
Hatuey", Matanzas, Cuba;
F. García and T. González, Centro
Politécnico "Villena Revolución", Havana,
Cuba
INTRODUCTION
Mulberry (M. alba) is a shrub that has traditionally been used for feeding the silkworm. It belongs the order of Urticales, to the Moraceae family and to the genus Morus, with more than 30 species and 300 varieties. It derives from China and other species originate in other temperate countries. However, they can be considered "cosmopolitan" for their capacity of adaptation to different climates and altitudes. In Cuba, according to Paretas et al. (1997), mulberry was planted in the 1940s for sericulture purposes and flourished in various regions.
The foliage has a high nutritional value, since it contains high levels of protein and digestibility. Mulberry does not tolerate badly drained or compacted soils, and it requires fertilization since it extracts large quantities of soil nutrients (it can use up to 50 percent of the fertilizers applied). Nevertheless, it has been shown that mulberry responds well to organic fertilizers, and yields of up to 50 tonnes/ha of edible fresh forage have been obtained with goat manure applications.
Benavides, Lachaux and Fuentes (1994) evaluated the effects of applying goat manure in the soil and the cutting frequency on biomass quality and yield in the humid tropics of Costa Rica. Three levels of goat manure (240, 360 and 480 kg of N/ha/year), two controls (no fertilization and 480 kg of N/ha/year of NH4NO3), and three cutting frequencies (60, 90 and 120 days) were used. The largest total DM production was with the cutting frequency of 120 days, although there was no difference in edible biomass between 90 and 120 days. Manure levels proportionally increased total and edible biomass yield, and the highest level of manure application (equivalent to 480 kg of N/ha/year) significantly exceeded both controls.
In the dry tropics of Guatemala, Rodríguez, Arias and Quiñones (1994) found that biomass production increased with shorter cutting frequencies (six, nine and 12 weeks) and higher fertilizer doses (40 and 80 kg of N/ha/year as urea). There was a positive interaction between both factors.
There are many aspects of this plant still to be studied, particularly in Cuba, particularly because of the need to find new forages of higher nutritional value than the conventional ones. The studies should be directed towards the different production systems and ecological conditions.
The objective of this paper is to present the results of the various agronomic studies carried out in Cuba with M. alba.
METHODOLOGY
Experiment 1
At the Indio Hatuey Grass and Forage Experimental Station (EEPF Indio Hatuey, 22°48’7" north and 81°2’ west, at 19 m above sea level), an experiment was conducted in a plantation of "Tigreada" variety with a complete random design. Two cutting heights (50 and 100 cm) and three cutting frequencies (45, 60 and 90 days) were used. Each treatment was represented by 20 plants randomly distributed in the field. They were planted at a spacing of 1 m between lines and 0.40 m between plants. They were not irrigated and poultry manure was applied twice at the rate of 150 kg N/ha/year during the rainy season.
In one year eight, six and four cuts were given at the frequencies of 45, 60 and 90 days, respectively. In 20 plants from each treatment total biomass and its components (leaf, woody stem and young stem) were determined, and the edible biomass calculated. Total biomass yield per ha was calculated from the mean dry weight of individual plants and a density of 25 000 plants/ha. For data processing, descriptive statistics and analysis of variance were used.
Experiments 2 and 3
At the Centro Politécnico "Villena Revolución", with typical red ferralitic soils, two experiments were conducted to study cutting height and frequency on biomass yield and on quality during the dry period of October 1998 to April 1999. The two experiments were set in a 1.5 ha area, using a random block design with four repetitions.
The experimental plot was composed of ten plants, with eight plants used as net plot. In total there were 32 plants per treatment. Total biomass and the three fractions were determined in each plant, and a plot sample was taken for N and fibre analysis. Cutting heights and frequencies were 20, 30 and 40 cm, and 45, 60 and 90 days, respectively. In experiment 2 the cutting frequency was 90 days and cutting height 30 cm.
Experiment 4
This study was carried out at Indio Hatuey Station in a well drained red-ferralitic soil. There were four treatments: a) mulberry; b) mulberry + 50 kg of N; c) mulberry + dolicho (Lablab purpureus); and d) mulberry + canavalia (Canavalia ensiformis). A random block design with four repetitions was used. Plot size was 10 x 10 m. The "Tigreada" variety was planted in September 1998, at 1 x 0.4 m spacing with 40 cm stakes. The two legumes were planted next between mulberry lines. These legumes were harvested when pods turned from green to yellow (06/01/99 for dolicho and 05/04/99 for canavalia). Nitrogen fertilizer was applied 60 days after planting.
Two manual weedings were done and mulberry was first harvested at one year of age. Parameters measured were total biomass yield (TDMY), edible biomass (EDMY), height, branch number, legume grain yield and legume plant yield. The Duncan (1955) test was used to interpret the results.
RESULTS AND DISCUSSION
Experiment 1
The analysis of total biomass yield showed highly significant differences (P<0.01) among cutting frequencies. Cutting height and the interaction height x frequency were non-significant.
The 90 days frequency gave the highest yield (1 031 g DM/plant/year). This result infers that 25 tonnes of DM can be produced per ha per year (with 25 000 plants/ha). Edible biomass production showed similar results. At the 90 days frequency 645 g of edible DM were produced per plant, equivalent to 16 tonnes/ha/year or 63 percent of total biomass. The 45 and 60 day frequencies yielded less edible biomass despite the higher edible fractions in the total DM yield.
TABLE 1
Effect of cutting height and frequency on biomass yield (g DM/plant/year).
|
Variable
|
Cutting height (cm) |
Cutting frequency (days) |
|||||
|
50 |
100 |
SE± |
45 |
60 |
90 |
SE± |
|
|
Total biomass |
650 |
670 |
44 |
537b |
514b |
1 031a |
62 *** |
|
Edible biomass |
533 |
453 |
85 |
456b |
378b |
645a |
120 * |
|
Edible biomass (%) |
82 |
68 |
|
85 |
74 |
63 |
|
a b Significantly different, horizontally P <0.05; * P < 0.05; *** P < 0.001These results are similar to those obtained in the humid tropics of Costa Rica by Benavides, Lauchaux and Fuentes (1994) and in the dry tropics of Guatemala by Rodriguez, Arias and Quiñones (1994).
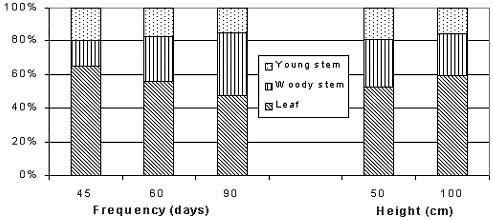
The biomass proportions (Figure 1) more clearly show the influence of cutting frequency. On the contrary, cutting height had no effect. Proportions of leaf and young stems go down as cutting intervals increase, but the woody stem fraction goes up. These results are closely linked to the growth process, by which sclerenchymatous tissues increase proportionally with age.
Experiment 2
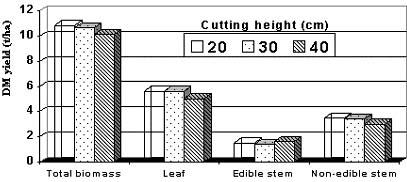
Cutting height did not have an effect on total and fractional biomass yields during the dry period of 1998-99 (Figure 2). Nevertheless, according to studies from other countries (Benavides, 1986), cutting height has not shown a clear tendency in its effect on biomass yield.
It should be noted that among plant fractions, the leaves gave the highest yield with approximately 55 percent of total biomass. Adding the young stem fraction of 12 percent, it can be inferred that over 60 percent of total biomass is edible. This means that over 7 tonnes of DM/ha were obtained during the dry period, a result superior to those of other conventional forages obtained under these experimental conditions.
There were no differences in protein and fibre due to cutting height (Table 2). Protein was obviously higher and fibre lower in leaf and edible stems.
TABLE 2
Effect of cutting height on protein and crude fibre of total biomass and fractions
|
Variables
|
Crude protein (%) |
Crude fibre (%) |
||||
|
Height (cm) |
Height (cm) |
|||||
|
20 |
30 |
40 |
20 |
30 |
40 |
|
|
Total biomass |
16.1 |
16.0 |
14.7 |
29.6 |
27.9 |
23.8 |
|
Leaf |
21.0 |
21.6 |
21.6 |
16.1 |
17.8 |
15.1 |
|
Edible stem |
8.7 |
8.6 |
8.9 |
41.8 |
38.8 |
39.3 |
|
Non-edible stem |
5.4 |
4.9 |
5.3 |
47.3 |
44.1 |
50.7 |
There were significant differences (P <0.05) on the effects of cutting frequency on total and fractional biomass yields (Table 3). All yields increased with cutting interval, with the greatest values at 90 days.
Table 4 indicates that the percentage of leaf and edible biomass decreased as cutting interval increased, whereas woody stem showed the reverse effect.
TABLE 3
Effect of cutting frequency on total and fractional biomass production (tonnes de MS/ha) during the dry period 1998-99
|
Variables |
Cutting frequency (days) |
||||
|
45 |
60 |
75 |
90 |
SE |
|
|
Non-edible stem |
0.06c |
0.38c |
1.15b |
3.38a |
0.263 * |
|
Edible stem |
0.33b |
0.41b |
0.82ª |
0.83a |
0.087 * |
|
Leaf |
2.70c |
2.60c |
3.79b |
5.24a |
0,261 * |
|
Total biomass |
3.09c |
3.39c |
5.76b |
9.45a |
0.493 * |
a, b, c Significantly differ horizontally P <0.05; *P <0,05;TABLE 4
Effect of cutting frequency on the percentages of biomass components
|
Variables
|
Cutting frequency (days) |
|||
|
45 |
60 |
75 |
90 |
|
|
Leaf |
87.4 |
76.7 |
65.8 |
55.4 |
|
Edible stem |
10.6 |
12.1 |
14.2 |
8.8 |
|
Non-edible stem |
2.0 |
11.2 |
20.0 |
35.8 |
|
Edible biomass |
98.0 |
88.8 |
80.0 |
64.2 |
There were significant differences (P <0.05) in protein content of various fractions with cutting frequency (Table 5). Protein decreased with longer cutting intervals, indicating greater lignification and more fibre (Table 6). This tendency was not observed in the edible stems, although at 90 days the protein content was the smallest.
Considering that DM production reaches 9.5 tonnes/ha during the dry period, with 15.6 percent CP, it is possible to produce 1.5 tonnes of CP/ha, which is equivalent to the yield of transgenic soybean in one year (Preston, 1999). This means that mulberry can produce three times more protein than transgenic soybean in a year.
TABLE 5
Effect of cutting frequency on protein content
|
Variables
|
Cutting frequency (days) |
||||
|
45 |
60 |
75 |
90 |
ES |
|
|
Total biomass |
24.1a |
16.0b |
14.7c |
15.6bc |
8.38 * |
|
Leaf |
27.0a |
24.4b |
23.6b |
21.4c |
0.36 * |
|
Edible stem |
11.5a |
10.8a |
11.2ª |
8.9b |
0.42 * |
|
Non-edible stem |
- |
11.8a |
9.2b |
7.6c |
0.04 * |
a,b,c Significantly different horizontally; * P <0,05TABLE 6
Effect of cutting frequency on crude fibre percentage
|
Variables
|
Cutting frequency (days) |
||||
|
45 |
60 |
75 |
90 |
SE |
|
|
Total biomass |
26.5 |
25.2 |
25.0 |
30.0 |
1.29NS |
|
Leaf |
14.0b |
12.4a |
15.5 |
15.1 |
0.47* |
|
Edible stem |
41.2 |
39.7 |
38.6 |
40.6 |
1.25NS |
|
Non-edible stem |
40.5 |
40.0 |
37.2 |
44.0 |
0.70NS |
a, b NS Non-significantExperiment 4
Table 7 shows total and edible production. There were no significant differences among treatments A, B and C, although B had the largest total yield (9.8 tonnes/ha). The lowest production of edible (2.5 tonnes/ha) and total biomass (5.3 tonnes/ha) occurred with canavalia (D), which was significantly (P <0.01) lower than the other treatments. This could be due to the very aggressive growth of canavalia, which covered mulberry branches intercepting light. Cover crops if not managed adequately can become weeds, shading the main crop and competing with water and nutrients (López and Hernández, 1997). This can be resolved with various management practices such as pruning, and spatial orientation.
TABLE 7
Effect of intercalated legumes on mulberry yield
|
Treatment |
EDMY |
TDMY |
|
Mulberry alone |
3.4ª |
8.5ª |
|
Mulberry + 50 kg of N |
3.8ª |
9.8ª |
|
Mulberry + dolicho |
3.5ª |
9.4ª |
|
Mulberry + canavalia |
2.5b |
5.3b |
|
SE ± |
1.8*** |
3.30*** |
EDMY = Edible DM yield; TDMY = Total DM yield a,b Significantly different vertically; *** P <0.001.Plant height and branch number are presented in Table 8, without any differences due to treatments.
TABLE 8
Effect of intercalated legumes on height and branch number at first cut.
|
Treatment |
Height (cm) |
Branch number |
|
Mulberry alone |
3.75 |
3.1 |
|
Mulberry + 50 kg of N |
2.70 |
2.8 |
|
Mulberry + Dolicho |
3.10 |
2.9 |
|
Mulberry + Canavalia |
2.77 |
2.9 |
|
SE ± |
0.16 NS |
0.11NS |
The results in DM production during the establishment period coincide with those of Martín et al. (1998) for this same variety.
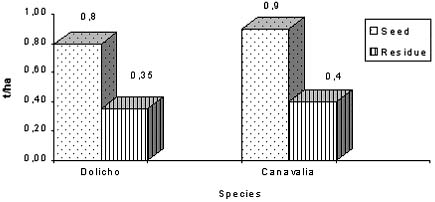
Intercalated legumes (Figure 3) produced additional grains: 0.87 t/ha for dolicho and 0.92 t/ha for canavalia, plus crop residues, which can help in maintaining soil fertility through nutrient recycling.
Figure 1. Mulberry biomass
fractions (%) by cutting frequency and height
Figure 2 Influence of cutting
height on yields of total biomass, leaf, edible stem (dry period)
Figure 3 Seed and crop residue yield of intercalated legumes with mulberry
This trial showed that it is possible to substitute certain quantities of nutrients that mulberry requires by intersowing short-cycle herbaceous legumes. Although there were no significant differences among treatments a, b and c, treatments b and c had 1.3 and 0,9 tonnes/ha more biomass yield compared to a. In addition, treatment c additionally had 870 kg/ha of legume grain and 350 kg of crop residue. These were later incorporated with the soil, but could be used as feed. All this indicates that studies should continue to determine more accurately the effects of intercalating short-cycle legumes on the biological, economic and ecological sustainability of mulberry under cut-and-carry systems.
FINAL CONSIDERATIONS
As part of the research programme being carried out in Cuba with M. alba, the four agronomic experiments concluded to date have been included in this article. From these the following was observed:
BIBLIOGRAPHY
Benavides, J.E. 1986. Efecto de diferentes niveles de suplementación con follaje de Morera (Morus sp.) sobre el crecimiento y consumo de corderos alimentados con pasto (Pennisetum purpureum). In Resumen de las investigaciones realizadas con rumiantes menores, cabras y ovejas en el Proyecto de Sistemas de Producción Animal. Turrialba, Costa Rica, CATIE. Technical Report No 67. p. 40-42.
Benavides, J.E., Lachaux, M. & Fuentes, M. 1994. Efecto de la aplicación de estiércol de cabra en el suelo sobre la calidad y producción de biomasa de morera (Morus sp.). In Arboles y arbustos forrajeros en América Central. Vol. 2, p. 495. CATIE. Turrialba, Costa Rica.
Martín, G.J., Yepes, I., Hernández, I. & Benavides, J.E. 1998. Evaluación de comportamiento de cuatro variedades de Morera (Morus alba) durante la fase de establecimiento. Memorias. III Taller Internacional Silvopastoril "Los árboles y arbustos en la ganadería". p. 92. Matanzas, Cuba, EEPF "Indio Hatuey".
Preston, T.R. 1999. La Revolución Pecuaria: Recursos locales como alternativa a los cereales. Resúmenes. VI Seminario Internacional sobre Sistemas Agropecuarios Sostenibles, p.22. Cali, Colombia.
Rodríguez, C., Arias, R. & Quiñones, J. 1994. Efecto de la frecuencia de poda y el nivel de fertilización nitrogenada sobre el rendimiento y calidad de biomasa de Morera (Morus sp.) en el trópico seco de Guatemala. In J.E. Benavides, ed. Arboles y arbustos forrajeros en América Central. Vol. 1, p. 305. Turrialba, Costa Rica, CATIE. Vol. 1, p.305..
![]()
![]()
![]()