![]()
![]()
![]()
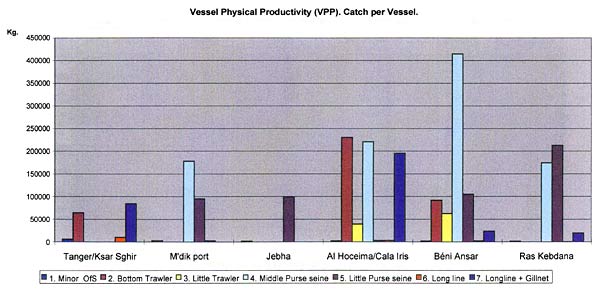
The first rank of indicators refers to the physical production expressed by the weight of catches landed by all the fleet segments. It has not been possible to access more detailed information about Spain (these are aggregate figures). In the case of Morocco, we can compare the results of this productivity for all the fleet segments and ports. Figure 4 shows the Vessel Physical Productivity (VFP). It can be seen how the average production of vessels in terms of weight of landings varies greatly from one vessel to another. LOUs with greater power and tonnage clearly stand out, especially those in segments 2, 4, 5.
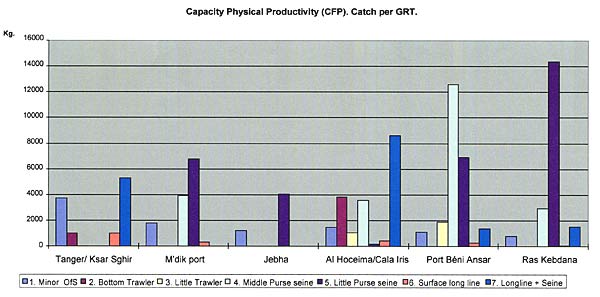
Figure 5 shows the Capacity Physical Productivity (CFP). We can see the average production of each LOU in terms of weight of landings per capacity unit (expressed in GRT). This time the values are not as dispersed, but bigger vessels again display a higher productivity. It also becomes evident how productivity increases towards ports located in the most eastern areas.
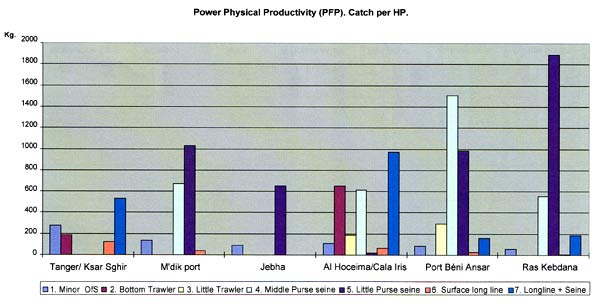
Figure 6 shows the Power Physical Productivity (PFP) as average production in terms of weight of landings per power unit (measured in HP). This figure is quite similar to the previous one. It seems to demonstrate a high power-capacity correlation.
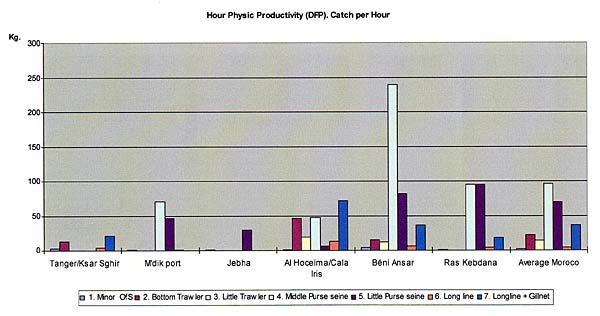
Figure 7 shows the Hour Physical Productivity (HFP) per vessel as the average production in terms of weight of landings per hour of fishing, including, therefore, time spent at sea. Again the vessels with greater power and tonnage rate highly, catching around 50 to 100 kg per hour of fishing (except medium purse seiners from Beni Ansar, which achieve 250 kg.) as compared with artisanal-like vessels and long liners catching 5 kg per hour or less.
A second series of indicators refer to the economic productivity in terms of the value of landings of all the fleet segments. Although the original data were expressed in dirhams and in pesetas, they have been standardised to dollars to enable accurate comparisons.
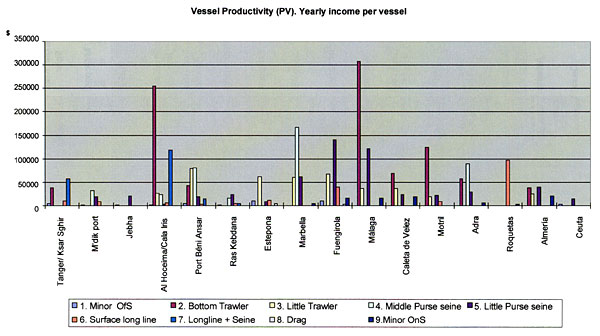
Figure 8 displays Vessel Productivity (PV). It shows the average production of each vessel according to the value at first sale. Differences between ports appear to be more significant than those between countries. Thus, the most productive group, Group 2, has a similar performance in both countries (except for the case of Malaga). Group 3 also displays a similar performance in both countries, though figures are slightly higher in Spain.
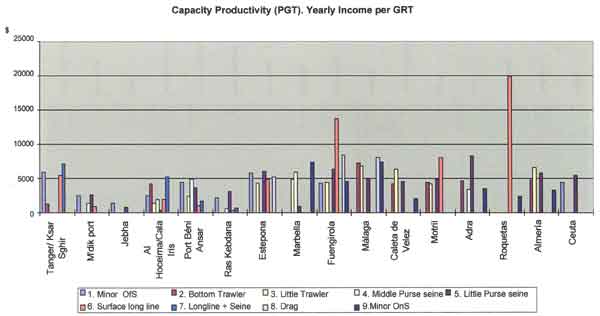
Figure 9 presents the Capacity Productivity (PGT), which shows the average production in terms of value (in dollars) at first sale per installed capacity unit (GRT). Productivity is high with regard to the capacity of long liners in segment 6, especially for some Spanish ports. Again, the global differences between ports are more significant than between countries.
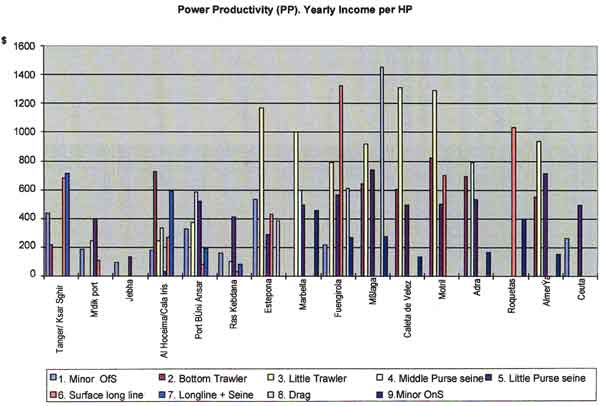
Figure 10 depicts Power Productivity (PP) or average production in terms of value at first sale per power unit (HP) of vessels within each LOU. A higher productivity is found among some of the Spanish segments; mostly small trawlers (3), long liners (5) and dredgers (8). This may be due to a more efficient use of power by these medium-sized segments, which is usually excessive in the Western Mediterranean area anyway).
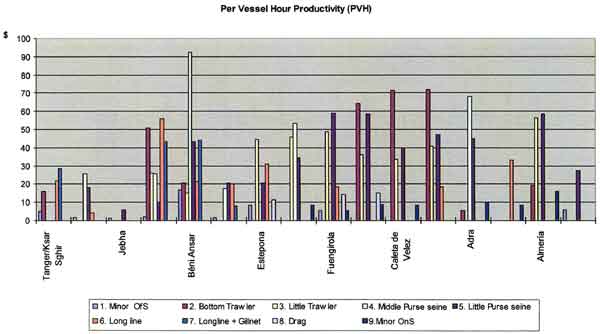
Finally, Figure 11 shows the Per Vessel Hour Productivity (PVH), or average productivity in terms of value at first sale per fishing hour. Although there may be some differences regarding time schedules between the two countries, the per hour productivity tends to be similar. Some Morocco LOU achieve very high results, notably long liners (5) in Al Hoceima and purse seiner (4) in Beni Ansar.
The third group of indicators is concerned with employment. They show the results of employment productivity, the salaries that this productivity allowed, and the costs entailed. Values are again expressed in dollars to allow for comparison between countries.
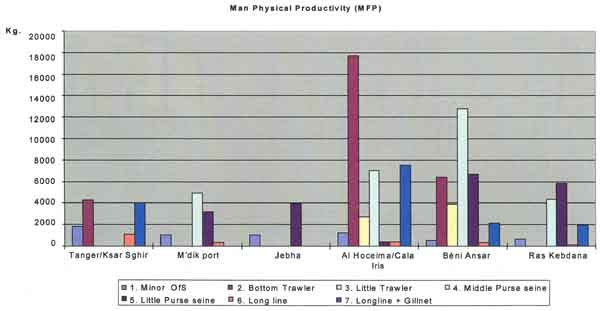
Figure 12 shows the Man Physical Productivity (MFP) in terms of of average weight of landings per employed man. Data are only available for Moroccan LOUs. The high physical productivity of purse seiners, despite the big crew they employ, is very noticeable.
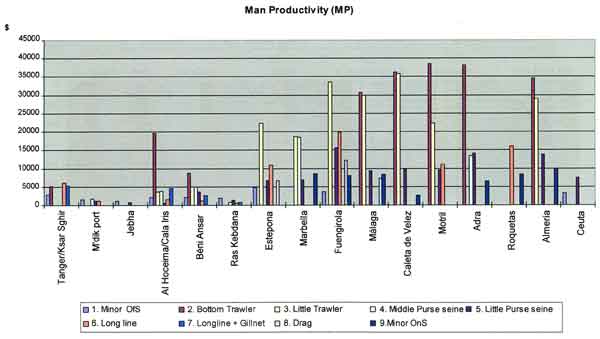
Figure 13 illustrates the Man Productivity (MP) as the average productivity in terms of value at first sale per employed man (in dollars). The results, except in the case of middle trawlers of Al Hoceima, are far better for Spain. Undoubtedly, this is due to the lower number of sailors per vessel in purse seiners and trawlers (segments 2, 3, 4 and 5).
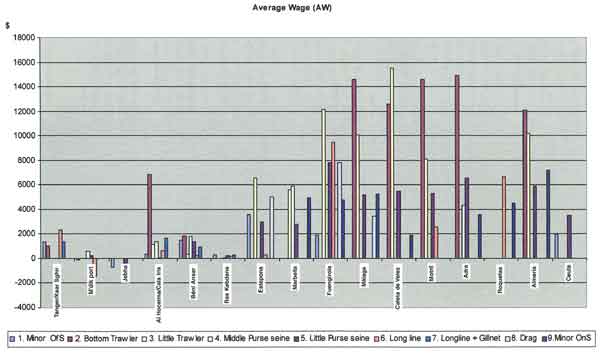
Figure 14 shows the Average Wage (AW) expressed as the mean annual salary (in dollars) gained in each LOU. Salaries are significantly higher in Spain. The lowest salaries in Spain can be attributed to part-time activities. In Morocco, the lowest salaries are paid in ports found in areas with insufficient road communication and in the more artisanal-like activities. Because standards and costs of living vary markedly between the two countries, cases in which there is similarity between LOU segments on the AW measure indicate that, a given salary is an inviting salary in Morocco but would be far less attractive within the Spanish labour market.
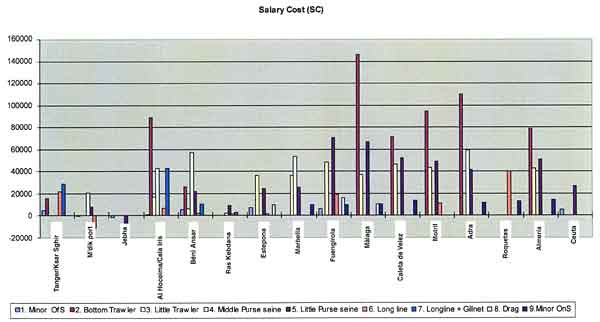
Figure 15 illustrates the Salary Costs (SC) in dollars for the owner or businessman. These data may underrate reality, since sailors usually keep a little share of the catches as salary in kind. It may be seen that the costs are quite similar in some segments (2, 3, 4 and 7). Although Moroccon salaries are lower overall, salary costs for some Moroccan owners are quite similar to those in Spain due to the greater number of crewmembers employed, especially in medium purse seiners and trawlers.
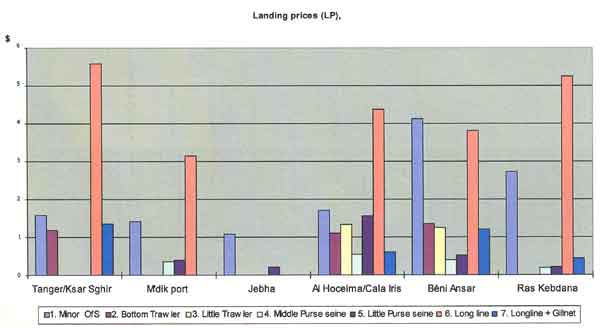
The fourth and last group of indicators has to do with business profits. Figure 16 shows Landing Prices (LP), or the average prices received for catches. Data are available only for Moroccan LOUs. Notable are the high prices achieved by artisanal segments (1 and 6), as well as the low prices at which catches were sold in the most isolated ports. This is so even in the segments of purse seiners (4 and 5) and trawlers (2 and 3). In these segments the prices were about 1 dollar/kg, well below the European markets (frequently the final destination of this production). Many causes may explain this, but most of them have to do with product quality (product processing and preservation) and transportation.
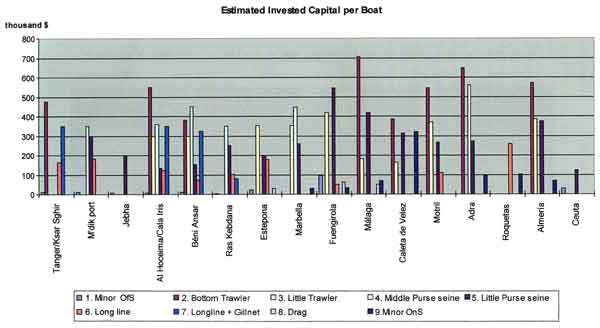
Figure 17 displays the Invested Capital (IC) per boat, which indicates the current average estimated value of vessels for all LOUs. There is a great resemblance between the two countries as far as investment figures are concerned. Differences between ports are due to the wide range of vessel sizes.
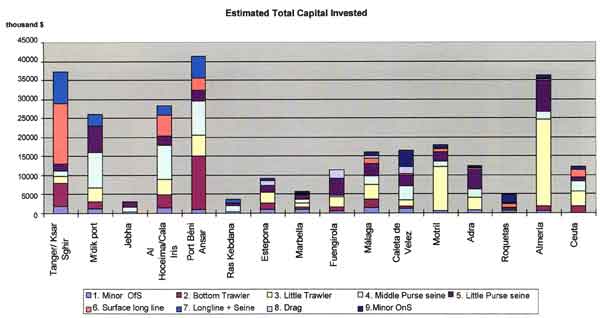
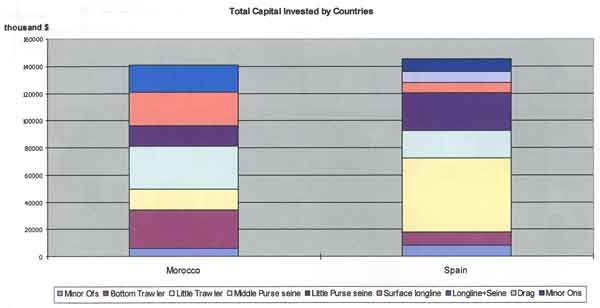
On the basis of the available data, the total capital invested in the Alboran Sea fleet can be estimated at around $300 million, the distribution of which is depicted in Figure 18. Contrary to the situation in Morocco (where investments are concentrated in a few ports), in Spain investments are quite evenly distributed. It can be appreciated from Figure 19, showing investment aggregated per country, that there is a virtually equivalent investing effort between Spain and Morocco, even if investments focus on partially different fleet segments.
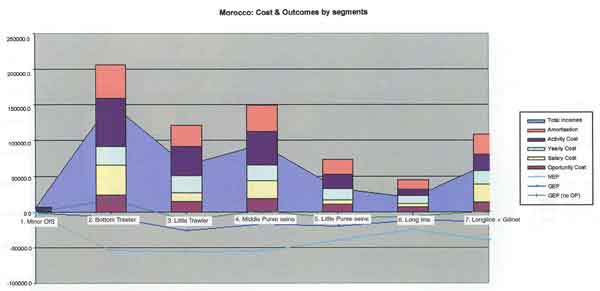
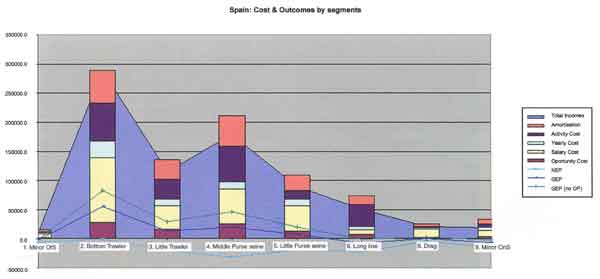
Costs assessment and profits deduction have been illustrated in the graphs shown as Figures 20 and 21, for Morocco and Spain respectively. Aggregate costs (OP, SC, CD, YFC) for the fleets of the two countries and for all the fleet segments are related to each kind of GEP result (with and without OP deduction), and to NEP.
As a result, we may see that yields are negative for a considerable group of segments in both countries, even for GEP without OP deduction. Fishing activity in these segments has a negative result if all costs are adequately considered. In practice, however, once the investment has been made and there is no alternative for the capital used, a given activity is often kept going without taking into account opportunity costs or depreciation. It is often the case in small enterprises that losses entail a reduction of wages for the investor himself, who is also a worker and has no other employment alternative.
Despite all these reasons, and especially in those cases where the OP cost is not deducted from the GEP, it is highly probable that any fishing enterprise yielding negative results will eventually disappear. The question here would be, why was the activity implemented in the first place? The most likely answer is that, at the beginning, investing in such enterprise seemed worthwhile and had good prospects. In this regard, these negative results may be warning us of a deterioration of either the resources or the markets.
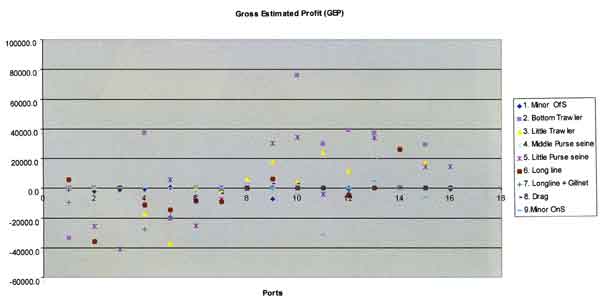
Figure 22 shows the structure of the Gross Estimated Profit (GEP) for the whole set of segments analysed. The ports have been arranged from 1 to 16 in the x-axis (from Tangiers to Ceuta, in the same order as in the tables). It can be seen that GEP values are higher in the Spanish ports. The value of most segments is close to zero. It can also be seen that some values differ greatly between ports within the same segment.
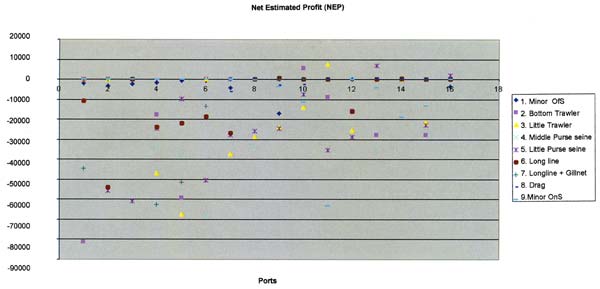
Figure 23 shows the Net Estimated Profit (NEP), which is the size of profits obtained by the owners as a whole after deducting depreciation costs. The results here are even more negative. In both countries, almost all segments with higher production capacity have yielded clearly negative results. In the long term, only those segments with values above zero are sustainable.
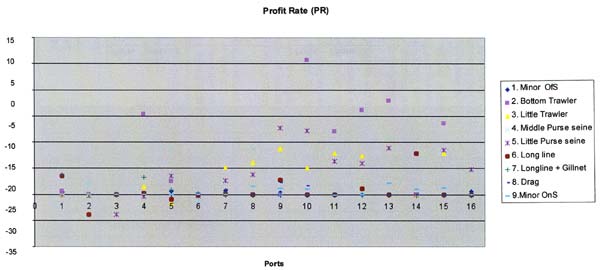
The pessimistic picture drawn by the previous graph is slightly lessened by Figure 24. This graph shows the Profit Rate (PR) level, which is the percent ratio of annual net profits plus the lost-opportunity cost to the amount invested. Here the profits are most apparent. Even though they are lower than interest rates (with real interest rate taken as 5%), they are positive in a greater number of segments. The most remarkable aspect of this graph is that if we look at the results in relation to the invested amount, some artisanal segments whose NEP was negative but seemingly close to zero have highly negative results if expressed in percent values, from PR -15% to PR -30%.
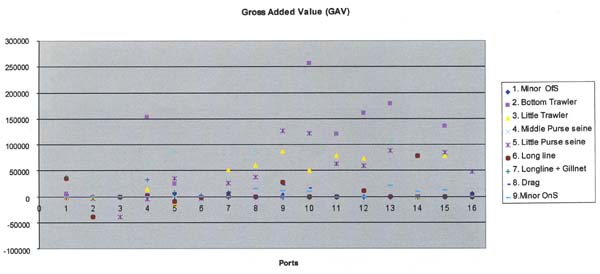
Finally, Figure 25 shows the Gross Added Value (GAV). This indicator expresses the added value provided by each segment to the economy of that country. Accordingly, the graph considers salaries, profits, lost-opportunity cost and depreciation (which eventually implies a demand for new machinery and equipment). Although in some cases the NEP is negative, the GAV is positive for most segments. This suggests that fisheries produce a positive economic effect on the national and regional economies where they are found. In theory, the large amount of capital invested in these fisheries (as indicated earlier, the amount of capital invested amounts to approximately $ 300 million) should prove more rewarding and more cost-effective than it actually is. In practice, the yields of that capital are as positive as they can be and could be improved only if other better alternatives were implemented. However, those better alternatives may be in some cases unaffordable to the communities living on the coasts. For that reason, even though the indicators advise in many segments against any further increase of investments (i.e., building more vessels), it does not follow that investments need to be reduced, at least as long as any re-structuring is achievable. The GAV figures suggest that fisheries have a positive effect on the economies on the short term. That explains why fishers are reluctant to quit their occupations, even for those working in segments where yields are significantly below what is considered as financially sustainable on the long term.
Ports - Morocco |
Ports -- Spain |
|
1)Tanger / Ksar Sgher |
7) Estepona |
12) Motril |
2) M'dik port |
8) Marbella |
13) Adra |
3) Jebha |
9) Fuengirola |
14) Roquetas |
4) Port Al Hoceima/ Cala Iris |
10) Málaga |
15) Almería |
5) Port Béni Ansar |
11) Caleta de Velez |
16) Ceuta |
6) Ras Kebdana |
||
15 By Idrissi Malouli, Rino Coppola and Ignacio de Leiva.
16 The exchange rates considered is 10 DHR and 156 PTAs per dollar, which are the respective mean rates in 1999. Since the market where Mediterranean fishing produce is mainly sold in Europe, and in order to prevent the negative effect of any exchange rate fluctuations, it may be more desirable to use the Euro (E) as a measure unit in the future. For the present; however, the dollar is adopted it is the measure unit used most frequently by FAO.
17 Some negative wages have been detected in Jebha and M'dik for very artisanal-like fleet segments. Technically, that implies that not even the daily operative costs are recovered. This may be due to misleading information or to the fact that fishermen frequently cannot remember their income of the previous year accurately. Further reasons may be that they may have found confusing the difference with net income made in the questionnaires; it may be also due to any untoward circumstance. This is a systematic procedure consisting in compiling information, so in such cases the survey should be repeated.
18 Opportunity Cost (OP), Salary Costs, Costs related to fishing activities (Costs per output x Number of outputs) and Year Fixed Costs (YFC)
19 In our estimations, we have considered 5% as real interest rate for Morocco, instead of 12% nominal rate in 1999. This is meant to prevent an excessive lowering effect of the opportunity cost, which should be carefully considered in the light of the interest rates of each international financial market, altogether deducting the effects of local inflation.
20 The Gross Estimated Profit (GEP) expresses the amount of income obtained by ship owners as a whole, once operational costs have been deducted. These include: Salary Cost (SC), Opportunity Cost (OP), Costs related to Fishing Activities (CD) and Year Fixed Costs (YFC). In order to assess the effects of Opportunity Costs, which are not usually regarded by fishers, it has been incorporated in the GEP without deducting this cost. On the other hand, the Net Estimated Profit (NEP) shows the volume of income obtained by the owners, once depreciation has been deducted from the GEP. It strictly shows profits in a theoretical sense as explained in the methodological introduction of this study. A feasible activity must have a NEP above zero (not negative).
21 Remember that, in calculating the depreciation costs, the shelf life has been estimated as being 10 years.
![]()
![]()
![]()