![]()
![]()
![]()
Singapore supports a substantial market for live, fresh, frozen and cured fish and fishery products. Current annual seafood trade data indicate that about S$ 1.2 billion (US$ 696,864,111) was traded in Singapore during 1998 - 1999. Singapore, due to its strategic location in Southeast Asia, adequate transportation facilities (by sea, air and land) overall economic growth and significant increases in disposable income of the population, has become an important seafood business centre and main distribution hub in the region. It serves as an export market for fish and fishery products from Southeast Asian countries as well as a transhipment base for fishery products from around the world. Singapore has become one of the wealthiest countries in Asia, with an average per capita GDP of US$ 22,205 in 1998; only Japan and Hong Kong had higher per capita GDP among the Asian countries. However, Singapore’s total fish and shellfish catches are relatively small; in 1997, FAO reported a catch volume of 9,250 metric tonnes. Re-exports of seafood from Singapore are increasing; in 1999, re-export figures were estimated at 75,000 metric tonnes. Official figures for 1998 showed that about 56 percent of imported shrimp and prawns is re-exported to Japan, Hong Kong, the Netherlands and Malaysia, and 91 percent of imported high quality tuna is re-exported to Japan (64 percent), Italy (12 percent) and Thailand (10 percent). In addition, 57 percent of imported marine fish is re-exported to Malaysia (39 percent), Taiwan (22 percent) and China (20 percent). Re-exports of fish and fishery products from Singapore to ASEAN[15] countries are mainly valued-added or high value fishery products, due to the fact that most of those countries are able to supply fish for their domestic markets as well as for exports markets. Table 22 shows Singapore’s imports and exports of fish and fishery products during 1997.
Table 22: Imports and Exports of Fish and Fishery Products (1997)
|
Fishery Product |
Imports (MT) |
Exports (MT) |
|
Fish, fresh, chilled or frozen |
111,664 |
83,182 |
|
Fish, dried, salted or smoked |
3,807 |
1,389 |
|
Crustaceans and molluscs |
45,994 |
22,308 |
|
Fish, canned |
18,035 |
2,008 |
|
Crustaceans and molluscs, canned |
5,039 |
2,728 |
Source: FAO Yearbook of Fishery Statistics-Commodities, 1997
Singapore imports more than 90 percent of its fish for domestic consumption; in 1997, FAO fisheries statistics reported an apparent annual per capita fish supply of about 31.2 kg. Table 23 shows the breakdown of food per capita consumption in 1998. It is estimated that in the year 2000, the total population will reach about 4.1 million[16] with an average density of 6,406 people/km2.
Table 23: Food Per Capita Consumption (1998)
|
Food Item |
Annual Per Capita Consumption |
|
Chicken |
32 |
|
Fish |
26 |
|
Pork |
23 |
|
Beef |
3 |
|
Duck |
3 |
|
Mutton |
3 |
|
Vegetables |
77 |
|
Fruits |
82 |
Source: The Straits Times (Singapore), 8th March, 2000
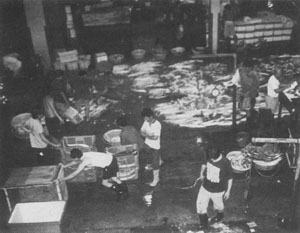
The domestic seafood market for fishery products is distinguished principally by the heavy dependence on imports by air from countries such as China, Malaysia, India, Sri Lanka; by sea from Indonesia and by land mainly from Thailand and Malaysia. Both captured and cultured fish and fishery products are regularly traded in the domestic seafood market. Chilled and live seafood is landed at the two main fishing ports, namely the Jurong and Senoko fishing ports and wholesale markets. Jurong and Senoko wholesale markets handle about 100,000 and 20,000 metric tonnes of fish annually, respectively. Jurong is the biggest, with a market floor area of 9,000 m2 and 110 market lots (allotted area on which the agents display and trade seafood). Senoko has a market floor area which currently houses about 36 market lots for trading operations with each agent having an allotted area of 40 m2 for displaying and selling fish. Fish in both wholesale markets is sold mainly by agreement on price with the buyers, and to a lesser extent through auction by agents, who sell to retailers, institutional buyers, processors and seafood traders. Average daily volumes of seafood traded in the Jurong and Senoko wholesale fish markets are estimated to be about 250 and 45 metric tonnes respectively. The fishing ports and wholesale markets are managed by the Primary Production Department (PPD). Both wholesale markets operate regularly from about 02:00 hours to 07:00 hours. However, some of the fish landed in Singapore does not go through the auction halls, but are supplied directly to restaurants, hotels and supermarkets; and some chilled fish (particularly tuna and some high value species) is selected and packed for re-export to neighbouring countries.
There is also a significant live fish and shellfish trade, some of which does not go through the auction, but are handled by private wholesalers located at Changi ferry terminal. These wholesalers operate small live fish carriers/vivier boats (with tanks and aeration systems), collecting live marine finfish produced by cage culture farms, air-flown live fish and shellfish, and live fish brought in by fishing vessels operating in Singaporean waters. Indonesian fishing vessels also bring in some live marine fish through Jurong fishing port. High value live finfish and shellfish is transported by importers/traders in carrier trucks equipped with tanks and aeration systems for local distribution to restaurants, hotels, public markets and some supermarkets. A proportion of the live fish is also exported to Hong Kong and China.
The supply of chilled fish from the East Coast of Malaysia is seasonal, with a peak period from March to June and a low supply period during November to February. However, the main influences on market prices and demand for high value chilled fish are the Chinese New Year, the wedding season (August to October) and the country’s economy. During the Chinese New Year, rabbitfish (Siganus canaliculatus) command high prices (among the ethnic Chinese population, rabbitfish is associated with good luck). Ripe females fetch premium prices, and are traditional holiday delicacies. However, during the rest of the year, rabbitfish has little to moderate demand in the market. During the wedding season, the consumption and demand for high-priced fish and shellfish (shrimp, mud crab and lobster), mainly through restaurants, is very high.
Another important factor that influences prices and demand of high value fish is the level of growth or recession affecting the country’s economy. For example, during 1995 to 1998, the domestic market for live marine finfish was price-sensitive (affected by the economic crisis in the region, the number of tourist arrivals, as well as restaurant sales significantly declined) and as a result, imports of live marine fish (mainly seabass, snapper, and grouper) declined by about 35%. The lowered purchasing power of consumers and reduced frequency of dining-out and family celebrations forced the market for live marine fish to look for alternative and cheaper products (such as seabass) or reduce imports significantly. The market for live marine finfish is relatively small in terms of volume and it is estimated that about 1,200 to 1,850 tons were traded annually during the period 1995 to 1998, with an average C&F price[17] of S$ 5.35/kg (US$ 3.097/kg) in 1998. FAO statistics for 1997 reported that Singapore imported a total of 2,954 tonnes of live fish (marine and freshwater). The main suppliers of live marine finfish are Malaysia, and to a lesser extent, Indonesia. Live Indo-Pacific swamp crab or mangrove crab (Scylla serrata) has a good demand in Singapore and it is mainly marketed alive. The main suppliers of live mud crab are Sri Lanka, India, the Philippines and Bangladesh. The market size for mangrove crab in Singapore is about 3,300 metric tonnes/year including supplies of chilled crabs (Singapore Trade Statistics do not differentiate product forms for crab). The average C&F price for live mangrove crab in 1999 was about US$ 4 to 5 per kg, but ripe females fetched about US 7 - 8 per kg. During February 2000, the average wholesale prices for live groupers were about S$ 15 to 20 per kg and S$ 8 - 11 per kg for live snappers. Table 24 shows the average wholesale prices of fresh fish at Jurong and Senoko during 1999.
Table 24: Average Wholesale Prices of Fresh Fish at Singapore’s Wholesale Markets during 1999
|
Species |
Jurong |
Senoko |
||
|
Low Price |
High Price |
Low Price |
High Price |
|
|
Red snapper (Lutjanus sp.) |
3.13 |
4.29 |
4.31 |
5.73 |
|
Chinese pomfret (Pampus chinensis) |
17.67 |
24.90 |
17.70 |
25.91 |
|
White/silver pomfret (Pampus argenteus) |
11.71 |
14.61 |
10.39 |
14.14 |
|
Indian mackerel (Rastrelliger kanagurta) |
3.21 |
4.42 |
3.05 |
4.04 |
|
Spanish mackerel (Scomberomorus sp.) |
4.76 |
6.67 |
5.09 |
6.54 |
|
Threadfin (Polynemus indicus) |
9.80 |
15.31 |
10.74 |
13.29 |
|
Yellow-banded scad (Selaroides leptolepis) |
1.39 |
3.82 |
2.61 |
3.68 |
Source: Dr. Tan Sen Min, MFRD/SEAFDEC, Singapore.
There is also an important speciality dried fish market for products such as dried anchovies, salted mackerel, sharkfin, fishmaw, sea cucumber, abalone, shrimp, squid, cuttlefish and oyster. The domestic dried fish production is negligible and the country is a net importer of these products. Major suppliers of dried fish to Singapore are Thailand, Malaysia, South Korea, Vietnam, Taiwan and Hong Kong. A portion of the high quality dried fish is re-exported to Hong Kong and China as Singapore’s strategic location has made it an important distribution centre of dried fish for Southeast Asia. Table 25 shows the average wholesale prices of dried fishery products in Singapore during February 2000.
Table 25: Average Wholesale Prices of Dried Fishery Products (February, 2000)
|
Dried Fish Product |
Wholesale Price |
|
Anchovies |
|
|
Whole (average quality) |
5 - 6 |
|
Split open |
10 |
|
Fillets |
9 - 11 |
|
Scallops |
150 |
|
Sea cucumber |
|
|
Black lollyfish |
23 - 28 |
|
Tigerfish |
9 - 13 |
|
Dried squid (butterfly cut) (6 - 7 pieces/kg) |
26 - 28 |
|
Sharkfins |
|
|
Tiger shark, tails (20 cm/up) |
33 - 34 |
|
Sharkfin rays (below 10 cm) |
64 - 66 |
|
Fishmaws |
|
|
Jewfish, grade B |
|
|
Below 15 pieces/kg |
55 - 57 |
|
Above 15 pieces/kg |
19 - 25 |
Source: Data obtained during field market surveys by the author and counterparts
Seafood reaches consumers in Singapore through a multi-level system, which may involve at least two transactions before the fish or fishery product is purchased in a public fish market or supermarket or eaten in a restaurant/food stall. The channels of distribution incorporate locally caught and processed seafood, with live, chilled and frozen imported items from the region and around the world; these items can be re-packed or processed locally and re- exported. The seafood distribution chain is typically very short, in particular for live seafood, with importers acting as distributors and agents directly dealing with retailers and restaurants. Supermarket chains are often direct importers of frozen and canned seafood product. At the two wholesale fish markets, the distribution chain is short, with wholesale agents selling fish to wholesalers, who distribute the products to retailers and institutional buyers. Some wholesalers act as purchasing agents for restaurants, catering organisations, super- markets and large retailers. Singapore’s main seafood (live, chilled and frozen products) distribution channels are illustrated in the simplified distribution chart presented in Figure 64.
Figure 64: Main Seafood
Distribution Channels, Singapore
Singapore is home to a variety of retail establishments offering live, fresh, frozen, cured and canned seafood to consumers. The range of shopping options include public retail markets and licensed hawkers selling through stalls, which offer a wide selection of live fish, fresh fish and fishery products and cured fish. Public markets currently hold about 70% of the retail market share of chilled and live fish and fishery products. Large supermarket chains (such as NTUC Fair Price, Carrefour, Cold Storage, Shop N Save and Prime) and medium-sized independent supermarkets offer fresh, frozen, live, cured and canned seafood. Supermarkets are currently handling about 30 percent of the retail market share of chilled and live fish and fishery products. Despite the fact that most supermarkets are low-cost, low-margin, high volume, self-service operations, which are designed to provide the consumer’s total needs for food and household-maintenance products, many still prefer to shop for seafood at public retail markets. The most popular product form is whole fresh fish and preferred species of finfish are: sea bream, Spanish mackerel, yellow-banded scad, red snapper, groupers, black, white & Chinese pomfret, threadfin and horse mackerel. In general, the retail price margin for chilled seafood products is about 25 percent.
There is a steady demand at supermarket level for chilled fillets, steaks and shellfish; consumers are willing to pay a little more for the convenience, dependability, quality and better packaging. Most supermarkets have well-defined seafood product strategies, including adequate product mix and variety. In most supermarkets, there is a full-service seafood section in charge of taking and preparing orders from consumers. The preparation may include weighing a specific quantity of fish or shellfish, gutting, cleaning or cutting a whole fish or fillet to the desired size or product form. Orders are then wrapped and labelled for the consumer. Alternatively seafood may be displayed “pre-packed”, when a small number of units, such as 250/500 grams of fish fillets, steaks or shrimp are wrapped in clingfilm on a small tray, and pre-priced. If seafood is to be pre-packaged, it is done at source. Many of the larger supermarkets insist on a high standard of hygiene in the local seafood packhouses. It was also noticed that standards of construction, maintenance, quality control and hygiene were high, which increases the investment incurred by supermarkets. According to some supermarket chains, the true cost of these investments is considered when seafood-selling prices are calculated.
Convenient pre-packed shrimp (head-on, headless, peeled and ready-to-cook) offered in supermarket chains are high value products met with some demand; however, it appears that most shrimp consumption takes place through the catering sector. According to some supermarket personnel, consumers are aware of the difference between shrimp species, but may not know whether the shrimp were cultured or wild-caught. Some supermarket chains are also offering ready-to-eat fish for taking out and consumption at home. The sale of ready-to-eat fish is designed in a similar way to that of traditional Chinese roasted duck, which is very popular at supermarket chains. Table 26 shows the comparative retail prices of live and fresh fish in supermarkets and public markets during February 2000.
Table 26: Comparative Average Retail Prices of Live and
Fresh Fish in Singapore (February, 2000)
|
Species/Type of Product |
Price (S $/kg) |
Price (S $/kg) |
|
|
Live Fish |
|
|
|
|
Tilapia (300 g/piece) |
9.7 |
6.0 |
|
|
Grouper |
25.8 |
25.0 |
|
|
Marble goby |
28.8 |
n/a |
|
|
Snakehead |
n/a |
10 - 12 |
|
|
Carp |
n/a |
6.5 |
|
|
Mangrove crab: |
|
|
|
|
|
Small size |
- |
10.0 |
|
|
Medium size |
11.5 |
12.0 |
|
|
Large size |
- |
14.0 |
|
Spiny lobster |
48.0 |
n/a |
|
|
Giant tiger shrimp |
24.9 |
23.0 |
|
|
Blue swimming crab |
13.5 - 15.9 |
n/a |
|
|
Crayfish |
18.1 |
n/a |
|
|
Whole Fresh Fish |
|
|
|
|
Threadfin bream |
4.9 |
4.7 |
|
|
White pomfret |
10.0 |
10.5 |
|
|
Chinese pomfret |
16.9 |
16.5 |
|
|
Rabbitfish |
6.6 |
6.0 |
|
|
Black pomfret |
6.5 |
6.8 |
|
|
Red grouper |
9.5 |
9.0 |
|
|
Red snapper |
14.8 |
15.0 |
|
|
Spanish mackerel |
8.5 |
8.4 |
|
|
Snobnose pampano (cultured) |
13.8 |
13.5 |
|
|
Hybrid red tilapia (cultured) |
3.1 |
3.5 |
|
|
Seabass (cultured) |
9.9 |
9.5 |
|
|
Slipper lobster |
17.9 |
n/a |
|
|
Blue swimming crab |
6.5 |
6.0 |
|
|
Giant tiger shrimp: |
|
|
|
|
|
Small size |
|
13.0 |
|
|
Medium size |
16.9 |
16.0 |
|
|
Large size |
|
25.0 |
Source: Data obtained during field market surveys by the author; n/a = not available, meaning that the product form was not available during the market survey.
The retail market for traditional minced and surimi-based products includes fish balls, squid/cuttlefish balls, shrimp balls, fish cakes, stuffed vegetables with surimi, Foochow fish balls (cooked fish balls with chicken filling), surimi & crab balls, fish/shrimp spring rolls and surimi analogues. In addition, surimi-based dried snack products (locally processed and imported) are also offered; these are popular for parties and celebrations. The domestic market for surimi-based fishery products is expected to grow due to increased production capacity and quality improvement of locally made products, adequate price levels and regular availability of both imported and locally made products. In addition, an increasing number of working housewives and consumers want convenience seafood products, which are easy and quick to prepare at home. Public retail markets and supermarkets currently offer a good variety of traditional and minced, as well as surimi-based products.
In some large public markets, traditional small-scale production of freshly made minced fish paste is a common feature. The main species used are wolf-herring (Chirocentrus dorab), conger eel (Congresox talabonoides) spotted Spanish mackerel (Scomberomorus guttatus) and lizardfish (Saurida spp.). Retail prices of fresh minced fish were about S$8 to S$ 12 per kg depending on the fish species used. The shelf life[18] of minced fish paste and surimi-based products ranges from a few days at a temperature of 0 - 5°C to 3 - 12 months when frozen at -18°C. Table 27 shows the retail prices of selected value-added fishery products in Singapore during February 2000.
Table 27: Average Retail Prices of Chilled Value-added Fishery Products
|
Product |
Price (S $/kg) |
|
Dory fillets (trays) |
7.7 |
|
Salmon fillets (trays) |
16.9 |
|
Threadfin fillets (trays) |
25.9 |
|
Cod steaks (trays) |
27.9 |
|
Red snapper steaks |
10.9 |
|
Stingray steaks (trays) |
6.9 |
|
Conger eel steaks (trays) |
4.7 |
|
Salmon heads/bone/tail (trays) |
8.0 |
|
King crab legs (trays) |
15.9 |
|
Cooked mussel meat (trays) |
8.7 |
|
Squid fillets (skinless) |
8.9 |
|
Scallops (half shell) |
12.0 |
|
Scallop flesh |
37.9 |
|
Oysters (half shell) |
13.5 |
|
Fresh fish balls (trays) |
4.5 |
|
Fried fish balls (trays/bags) |
5.8 - 6.8 |
|
Prawn balls (trays/bags) |
6.8 |
|
Cuttlefish balls (trays/bags) |
6.5 |
|
Surimi and crab balls (trays) |
7.8 |
|
Shrimp balls (trays) |
8.5 |
|
Foochow fish balls (trays) |
7.9 |
|
Imitation scallops (trays) |
12.9 |
|
Softshell crab (4 pieces/tray) |
21.0 |
|
Seasoned baby octopus (trays) |
21.9 |
|
Seasoned squid slices (trays) |
31.9 |
Source: Data obtained during field market surveys by the author and counterparts
Table 28 shows the average retail prices of red meats and poultry in Singapore during February 2000.
Table 28: Average Retail Prices of Meat and Poultry Products in Singapore (February, 2000)
|
Product |
Price (S $/kg) |
|
Red Meats: |
|
|
Lean pork |
8.7 |
|
Pork loin |
10.5 |
|
Beef loin |
14.8 - 15 |
|
Beef, tender chuck |
12.9 - 13 |
|
Minced beef |
9.9 |
|
Lamb leg, chops |
15.5 |
|
Poultry: |
|
|
Dressed chicken (chilled) |
3.6 |
|
Chicken breast/chilled) |
7.8 |
|
Chicken, drumstick (chilled) |
5.5 |
|
Duck, dressed (chilled) |
3.7 - 3.8 |
Source: Data obtained during field market surveys by the author and counterparts
In 1971, a national programme aimed at building hawker food centres and markets to resettle licensed street hawkers provided basic stall facilities and services such as piped potable water and electricity supplies, waste collection and disposal. By 1996, all street hawkers had been completely resettled into food centres and markets. In 1988, there were about 23,331 hawkers operating in 184 public markets and food centres in Singapore, of which 8,878 were engaged in ready-to-eat vending operations. A total of 42 hawker food centres operated regularly in 1996. Official data on the number of licensed stalls in these hawker food centres is shown in Table 29.
Table 29: Licensed Stalls in Hawker Food Centres in Singapore (1996)
|
Type of Stalls |
Number of stalls |
|
Cooked food retail stalls |
2,196 |
|
Market retail stalls: |
479 |
|
i) Sundry goods |
|
|
ii) Market produce (e.g. Seafood, meat, whole fruits) |
|
|
iii) Market produce (e.g. Vegetables, eggs, bean cakes, noodles) |
|
|
Sub-total |
2,398 |
|
Total |
5,073 |
Source: Annual Report, 1996. Hawkers Department, Singapore
The set up and operation of Singapore’s hawker food centres was aimed at upgrading the performance of hawkers through appropriate facilities, food control measures, and provision of training and adequate legislation. The Hawkers Department is the Government agency in charge of formulating and implementing policies on the operation, licensing and control of hawkers. This agency also inspects all hawker stalls and enforces the Environmental Public Health Act No. 32 (Chapter 95) of 1968, and its regulations (Environmental Public Health (Hawkers) Regulations, 1969), thus ensuring observance of good food hygiene practices. Regular training courses on food hygiene are part of an on-going programme organised by the Hawkers Department. This training is aimed at providing adequate guidance and technical assistance to food hawkers on proper food and personal hygiene practices. All stall holders and their assistants who are involved in the preparation and sale of food are required to attend and pass this food hygiene course. Since the introduction of this food hygiene course in 1990, up to 1996, the Hawkers Department has trained a total of 10,305 food handlers. About 290 - 300 stallholders and assistants from the hawkers’ food centres attend and pass the food hygiene course each year.
Basic design features of market product stalls are mainly fixed type facilities, which resemble those found in the traditional public market retail stall. Potable water, wastewater drainage and electricity is provided to retail stalls, which have glazed tile walls, concrete slopped floors and adequate ventilation and lighting.
It is a well-known fact that live fish and shellfish commands a premium price because of its guaranteed quality, freshness and intrinsic flesh characteristics (better texture and delicate flavour) in comparison with fresh/chilled seafood. Primarily the tastes, traditions and cooking styles of the population (mostly Chinese in orgin) determine Singapore’s live seafood market requirements. The consumption of live seafood is a niche market for affluent tourists, the upper class population and businessmen. The negative effects of the financial crisis in Asia are reflected in Singapore’s trade of high-value live marine finfish, which has shown a declining trend in the last three years. With the gradual recovery of Singapore’s economy, a positive trend in the domestic demand for high-value live marine finfish is expected.
The display of live seafood in aquariums has traditionally been an effective marketing device at restaurants and hotels (main outlets for live seafood sales) as well as in public food markets. Tourist seafood restaurants as well as traditional Singaporean seafood restaurants offer a large selection of live aquatic food, such as lobsters, mangrove crab, shrimp, oysters, snakehead, catfish, carps, seabass, groupers, snappers and other reef fish. For example, for the preparation of the very popular dish known as Singapore chilli crab, (which is offered as a speciality in most seafood restaurants), professional cooks use large live mangrove crabs (preferably ripe females). Most seafood banquet directors interviewed indicated that live fish is an important part of the menu for wedding banquets, company dinners and dances as well as birthday celebrations. Live fish are commonly gutted and either steamed or deep-fried, and generally are served with mixed vegetables and/or sauces. In general, live fish with firm flesh, low fat content, and fine-grained skin are preferred. It should be mentioned that some species of live cultured fish are considered inferior to wild live fish and fetches slightly lower prices; this is particularly evident with groupers. There is a premium price on size, with larger fish (within the range of 1 - 2 kg) often commanding higher prices than smaller fish.
Live marine fish is harvested either by scoop net or lifting cage culture nets. The fish is than transported by small vivier boats to the landing centres. The boats are equipped with small fibreglass-reinforced plastic (FRP) containers/tanks and two (2) pure oxygen cylinders. Live marine fish (mainly groupers, tilapia, mullets, snappers and seabass) collected from fish farms are transferred manually to the FRP tanks filled with clean seawater, adequately oxygenated. On average, trips from fish farms to the Changi ferry terminal landing centre last about 1 - 2 hours. The average market size of cultivated marine fish is shown in Table 30.
Table 30: Average Market Size of Cultivated Marine Fish
|
Species |
Market Size (g/piece) |
|
Grouper |
600 - 1,000 |
|
Seabass |
600 - 1,000 |
|
Tilapia |
400 - 600 |
Source: data from market surveys conducted by the author and counterparts
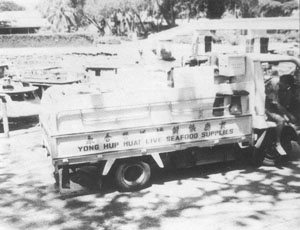
Currently, live marine fish are transported in seawater from the landing centres by vivier trucks. The main features of vivier trucks include aerated seawater tanks mounted on flatbed trucks. The majority of tanks used in Singapore are locally made from fibreglass-reinforced plastic (FRP) or aluminium.
The open transport tanks require aeration to maintain adequate dissolved oxygen levels. For this purpose, the following equipment is used: mechanical water pumping systems to circulate the water and provide aeration to the fish tanks powered by the truck’s engine and pure oxygen through oxygen cylinders connected to the tanks through flexible plastic hoses. A typical example of a live marine transportation system is as follows:
a) Truck: A five tonne payload flatbed truck equipped with six vivier tanks (made of fibreglass reinforced plastic, with aeration fittings and air distributors/diffusers on the bottom, and water drainage)
b) Small water pump powered by the truck’s engine
c) Oxygen cylinders (two) connected to the tanks through flexible plastic hoses
d) Scoop nets (stainless steel frames and nylon netting)
e) Weighing baskets
On arrival at the landing centre (Changi ferry terminal), the live fish is sorted by species and size and distributed to wholesalers, retail markets and restaurants at mutually agreed prices. Any fish which are not sold are kept in vivier tanks which are equiped with circulatory and aerating systems similar to those installed in the vivier trucks. The fish are normally fed minced fish. During the entire collection, storage and distribution operations, the handling of the live fish is reduced to a minimum to avoid excessive injuries. At the retail or restaurant destination, the fish is transferred to aquariums or portable containers until sold or required for human consumption. Wild-caught live fish such as groupers, snappers, parrotfish and coral fishes are handled in the same way as the live cultured marine fish. In addition, live lobsters, prawns, mud crab and groupers which are air flown from neighbouring countries are also handled and distributed at the Changi ferry terminal. It is estimated that on average, 500 kg/day of live marine fish are landed at the terminal.
The main retail outlets for live fish and shellfish are the public markets and some supermarket chains. Retail competition is intense, with a high concentration of sophisticated retailers. There is also substantial foreign investment in this sector, in particular, in supermarkets and shopping malls. However, public markets still play a major role in retailing live seafood.
For example, NTUC Fair Price, which is the largest supermarket chain in Singapore, offers a good variety of live seafood such as spiny lobster, blue swimming crab, mangrove crab, crayfish, giant tiger shrimp and tilapia.
The equipment used for display of live seafood at supermarkets include mainly display tanks. The live seafood distributors supply these units to supermarkets on a loan basis. The largest display unit is equipped as follows:
Three glass-sided fibreglass display tanks (rectangular in shape)
One water pump (for water circulation)
One mechanical filter
Three-tiered waterfall aerators
One water chiller
This large unit can hold about 30 to 50 kg of lobsters or giant tiger shrimp. The display tank units are an important promotional tool in the retail seafood section and an effective assurance to consumers of the good quality of the live seafood being offered. Simple glass aquarium tanks equipped with air pumps are also used for displaying live tilapia and crabs in some smaller supermarkets. These highly visible display units have boosted live seafood sales at most of the NTUC Fair Price supermarkets.
At public markets, the equipment used for display of retail live seafood at supermarkets include mainly aquarium units, portable FRP tanks and plastic containers. Aquarium display units are either metal-framed glass tanks or plexiglass tanks (with silicone rubber adhesive sealed joints), the latter being more commonly used. According to these retailers, most of the display units are equipped with air pumps to maintain adequate oxygen levels. However, mud crabs are either kept in their original packaging boxes or in plastic containers without water. During retail operations, the main control measures for live crabs are to keep them moist and cool all the time and prevent injuries caused by rough handling. Mud crabs survive best in an environment of about 70 -80% relative humidity. Lower temperatures are achieved by the use of chilled moistened materials placed at the bottom of the storage box. Usually, the storage boxes are provided with ventilation holes at the top. On arrival at the public markets, mangrove crabs are carefully examined and weak or dead crabs are removed from the boxes and either chilled or cooked. Live mangrove crabs are tied with raffia; this reduces cannibalism, physical damage and movement during distribution and marketing operations.
Live freshwater fish such as carps, catfish and snakehead supplied from Malaysia and Thailand are very popular in public markets. These species are also displayed in aquarium tanks, FRP tanks or plastic containers. Catfish and snakehead can survive for prolonged periods out of water, provided they are kept moist and relatively cool. Adequate preventive measures must be used to avoid injuries due to rough handling.
Daily supplies of live seafood are delivered to public markets to replenish the stocks; on average each retailer holds stocks of live seafood for at least two working days.
Our limited seafood retailer’s survey indicated that mainly men operate the retail seafood stalls in Singapore. A limited gender analysis showed that most women and men run seafood retail vending as a family business.
The “Pick and Choose Yong Tau Foo” sales promotion scheme is the main consumer promotion tool currently used for surimi-based products at retail level, in particular, supermarkets. This sales promotion scheme consists in offering a wide selection of surimi-based products (including seafood analogues) together with the traditional and very popular Chinese bean curd products at a fixed price of S$ 1.50 for 10 pieces of any of these products. This sales promotion scheme offers consumers savings off the regular price for surimi-based seafood products. It takes the form of a reduced price pack, in which two non-related products (surimi-based products and traditional bean curd products) are banded together. The common use of both types of products in the preparation of traditional Chinese soups makes this sales promotion scheme very effective in stimulating regular sales. Product assortment and quality level are key elements for the success of this sales promotion scheme in a very competitive market. These perishable products are usually displayed chilled; therefore, adequate care needs to be exerted in handling, storage and display to match the target market’s expectations. Dealing with a line of highly perishable products, shop managers are supposed to know what consumers want, what products to stock and how much is needed daily, to ensure product freshness. In addition, seafood section staff are supposed to carefully monitor the shelf lives of each product, to ensure that high quality items are displayed.
The following chilled surimi-based and bean curd products were offered in NTUC Fair Price supermarkets during the month of February, 2000.
Fish balls (yu yuan)
Cuttlefish balls (xu tong yuan)
Fish cake (yu ping)
Fish dumpling with chicken filling (yu qiao)
Imitation scallops (jia yu zhu)
Imitation crab (jia pang xie ru)
Fish rolls (yu tiao)
Shrimp rolls (xiao tiao)
Fresh chillies filled with surimi (sheng la jiao yu jiang)
Fresh ladies’ fingers filled with surimi (jang qiao dou sai yu jiang)
Fried dou foo (ja dou foo)
Fresh dou foo (sheng dou foo)
Surimi and crab balls (yu jiang he pang xie yuan)
Fish balls filled with minced chicken (yu yuan zhan qi ro)
This self-selection sales promotion scheme operates as follows:
i) Consumers at the seafood section are encouraged to examine what is on offer and make their own choice of value-added products. With the help of a plastic pincer, the consumer can select the products and place them on a polystyrene tray. The display of products in refrigerated display cabinets is arranged so that consumers can easily examine all type of products
ii) The seafood section staff checks the contents, wraps the tray with a plastic film, then labels the tray with a sticker
iii) The consumers include the tray with other grocery items for final payment as they leave the supermarket.
This self-service retailing scheme with limited sales assistance has lower operating expenses because of less staff requirement. The retailer makes up for the reduced profit margin by achieving a high volume of sales. In addition, consumers are willing to carry out their own locate-compare-select process of value-added fishery products, on the understanding that they can save money. In general, traditional bean curd products are bought with little regard to significant brand differences, which can be described as habitual buying behaviour. Therefore, some supermarkets find it effective to use price and sales promotions to stimulate non- branded product trials (in particular, seafood analogues), since buyers are not committed to any brand. This marketing strategy also encourages variety-seeking buying behaviour by offering lower price packs.
Several training courses on fish handling and quality preservation for fish retailers from local supermarket chains have been organised by MFRD, SEAFDEC and PPD since 1986. The trainees included seafood section supervisors, shop-front staff and shop managers. The content of these courses was tailored to suit different levels of staff. Details of the first two training courses are shown in Table 31.
Currently the Food Control Department conducts regular surveillance and enforcement programmes to ensure that safe and wholesome food is sold at retail establishments. Regular food sampling at storage and retail shops is conducted, and samples are checked through physical, microbiological and chemical analysis. Spot-checks at warehouses, supermarkets and public markets include evaluation of food storage condition and quality, labelling requirements and storage temperatures. At present all cooked food vendors are subject to a demerit point system of quality inspection. Figure 65 shows the Food Control Department Organization chart.
Figure 65: Singapore's Food
Control Department Organisation Chart
Table 31: FAO/FIIU Study on Low-cost Fish Retailing Equipment and Facilities for Improving Fish Marketing in Urban Areas of South East Asia
Training Programmes for Seafood Vendors
Country/City: Singapore
|
Course (s) Content |
Training Methodology/Equipment Training Materials |
Results Obtained |
|
1ST FISH RETAILERS |
The course was conducted through a series of lectures, experiments and demonstrations. Transparencies, printed lecture notes and handouts were used. |
i) Qualitative evaluation: |
|
1/12/1986: Day 1 13:30 - 14:00: Registration 14:00 - 15:15: Lecture 1 15:15 - 15:30: Tea break 15:30 - 17:00: Practical session 1. Set-up experiment 1 |
Lecture 1: Concept of freshness 1. Endogenous factors influencing quality changes at post mortem; Lecture 2: 1. Spoilage changes during icing |
At the end of the course, feedback from trainees was obtained through a Course Review form. ii) Quantitative evaluation: Yes [ ] No
[ |
|
3/12/1986: Day 2 14:00 -15:30: Lecture 2 15:30 - 15:45: Tea break 15:45 - 17:00: Practical session 1. Observation of results of experiment 1 |
Experiment 1: To demonstrate the stages in the spoilage of fish at 0°C and 10°C. Experiment 2: To demonstrate the influence of initial quality on the final quality of frozen fish Experiment 3: To demonstrate the presence of bacteria in unwashed/dirty fish |
|
|
5/12/1986: Day 3 14:00 - 14:45: Practical session 1. Observation of results of experiment 1 14:45 -15:30: 1. Conclusion of experiment 1 15:30 - 15:45: Tea break 15:45 - 16:45: Presentation by trainees on their current practices with regards to purchasing, transport, storage and display of chilled and frozen fish and fish products. This will be followed by a general discussion on common problems faced and possible solutions. 16:45 - 17:00: Closing of course |
Demonstration 1: Static displays showing: 1. How bacteria multiply Demonstration 2: Influence of fluctuating temperatures during frozen storage. Demonstration 3: Effects of slow freezing and partial freezing |
|
|
2ND TRAINING COURSE FOR |
The course was conducted through a series of lectures, experiments and demonstrations. Transparencies, printed lecture notes and handouts were used. |
i) Qualitative evaluation: |
|
20/4/1987 (Mon): Day 1 13:30 - 14:00: Registration & briefing 14:00 - 15:00: Lecture 1 15:00 - 15:15: Tea break 15:15 - 16:45: Lecture 2 16:45 - 17:00: Discussion |
Lecture 1: Concept of freshness 1. Endogenous factors influencing quality changes at post mortem; |
At the end of the course feedback from trainees were obtained through a Course Review form. ii) Quantitative evaluation: |
|
22/4/1987 (Wed): Day 2 13:30- 15:00: Practical 1 1. Experiment 1 (Fish Quality) 2. Experiment 2 (Initial Quality) 15:00 - 15:15: Tea break 15:15 - 17:00: Practical 2 1. Experiment 3 (Bacteriology) |
Lecture 2: Quality Preservation 1. Principles of icing |
|
|
24/4/1987 (Fri): Day 3 13:30 - 14:30: Lecture 3 14:30 - 14:45: Discussion 14:45 - 15:00: Tea break 15:00 - 17:00: Practical 3 1. Experiment 4 (Physical examination) |
Lecture 3: Cleanliness & sanitation 1. General principles of hygiene and sanitation practices for retail
store personnel Lecture 4: Quality Control at Retail Store 1. Types of display counters, display lighting and quality control |
|
|
27/4/1987 (Mon): Day 4 13:30 - 14:30: Lecture 4 14:30 - 15:00: Discussion 15:00 - 15:15: Tea break 15:15 - 16:45: Practical 4 1. Continuation of Experiment 2 16:45 - 17:00: Closing of course |
Experiment 1: To ascertain quality consciousness amongst trainees. Experiment 2: To demonstrate the influence of initial quality on the final quality of frozen fish Experiment 3: To demonstrate the presence of bacteria in unwashed fish Experiment 4: Physical examination of fish quality Experiment 5: To demonstrate the stages of spoilage at 0°C and 15°C. Demonstration 1: Bacterial contamination. Demonstration 2: Influence of fluctuating temperature during frozen storage. Poster display: 1. Chart explaining how bacteria multiplies |
|
|
IN-HOUSE RETAILERS’ |
The course was conducted through a series of lectures, videotapes, experiments and demonstrations. Trans-parencies, printed lecture notes and handouts were used. The materials of this course were used for the Training Manual on Fish Quality Preservation. |
i) Qualitative evaluation: At the end of the course feedback from trainees were obtained through a Course review form. |
|
Day 1: 9:00 - 9:30: Registration 9:30 - 10:15: Lecture 1 10:15 - 10:30: Tea break 10:30 - 12:00: Lecture 2 12:00 - 13:00: Lunch 13:00 - 14:00: Video 1 & discussion 14:00 - 15:00: Lecture 3 15:00 - 15:15: Tea break & Poster display 1 15:15 - 16:30: Practical 1 16:30 - 17:00: Review of day’s work & short objective Test I |
Lecture 1: Introduction Lecture 2: Concept of freshness 1. Endogenous factors influencing quality changes at post mortem; Lecture 3: Concept of quality (Part 1) |
ii) Quantitative evaluation: Yes [ Three tests were conducted at the end of each of the first 3 days to assess trainees’ understanding. |
|
Day 2: 9:00 - 10:00: Lecture 4 10:00 - 10:15: Tea break 10:15 - 11:00: Lecture 5 11:00 - 11:10: Break 11:10 - 12:10: Lecture 6 12:10 - 13:00: Lunch 13:00 - 14:30: Lecture 7 14:30 - 15:30: Practical 2 15:30 - 15:35: Tea & Poster display 2 15:35 - 16:30: Lecture 8 16:30 - 17:00: Review of day’s work & short objective Test II |
Lecture 4: Concept of Quality (Part 2) Lecture 5: Concept of wholesomeness Lecture 6: Concept of nutritive value Lecture 7: Freshness of squid Lecture 8: Fish quality preservation - Icing (Part 1) |
|
|
Day 3: 9:00 - 10:15: Lecture 9 10:15 - 10:45: Tea break & poster display 3 10:45 - 12:00: Lecture 10 12:00 - 13:00: Lunch 13:00 - 14:15: Lecture 11 14:15 - 15:30: Practical 3 15:30 - 15:45: Tea & Poster display 3 15:45 - 16:30: Video 2 & discussion 16:30 - 17:00: Review of day’s work & short objective Test III |
Lecture 9: Icing (Part 2) Lecture 10: Freezing (Part 1) Lecture 11: Freezing (Part 2) Lecture 12: Hygiene and sanitation Lecture 13: Quality Control at Retail Store (Part 1) Lecture 14: Quality Control at Retail Store (Part 2) Practical 1: Physical examination of ice stored fish Practical 2: Demonstration on bacterial spoilage effects on fish Practical 3: Demonstration on the influence of fluctuating temperatures during frozen storage. Practical 4: Organoleptic test of iced fish |
|
|
Day 4: 9:00 - 10:30: Lecture 12 10:30 - 10:45: Tea break & Poster display 4 10:45 - 12:00: Lecture 13 12:00 - 13:00: Lunch 13:00 - 14:00: Lecture 14 14:00 - 16:00: Practical 4 16:00 - 17:00: Course evaluation & closing |
Poster display 1: Chart explaining how bacteria multiplies Poster display 2: Proper handling practices Poster display 3: Suggestions for a full service seafood department Poster display 4: What is slow freezing |
|
|
IN-HOUSE RETAILERS’ |
The course was conducted through a series of lectures and demonstrations. Transparencies, printed lecture notes and handouts were used. The materials of this course were based on the first draft of the Training Manual on Fish Quality Preservation. |
i) Qualitative evaluation: At the end of the course, feedback from trainees were obtained through a Course Review form. |
|
11/4/1989: Day 1 9:00 - 10:00: Lecture 1 10:00 - 10:30: Demonstration 1 10:30 - 11:00: Coffee break 11:00 - 12:00: Lecture 2 12:00 - 13:00: Demonstration 2 |
Lecture 1: 1. Introduction |
ii) Quantitative evaluation: |
|
12/4/1989: Day 2 9:00 - 10:00: Lecture 3 10:00 - 10:30: Demonstration 3 10:30 - 11:00: Coffee break 11:00 - 12:00: Lecture 4 12:00 - 13:00: Demonstration 4 |
Lecture 2: Fish quality preservation and appropriate handling methods 1. Principles and methods of icing |
|
|
13/4/1989: Day 3 9:00 - 10:00: Lecture 5 10:00 - 10:30: Demonstration 5 10:30 - 11:00: Coffee break 11:00 - 11:45: Lecture 6 14:45 - 13:00: CASE STUDY - Assessment of existing conditions in one supermarket outlet; CONCLUSION |
Lecture 3: 1. Concept of wholesomeness Lecture 4: Hygiene and sanitation Part 2 Lecture 5: Quality Control at retail store Lecture 6: Handling of selected processed products Demonstration 1: Time-temperature- tolerance. Physical examination of ice stored fish Demonstration 2: Quality deterioration due to frozen storage Demonstration 3: Concept of wholesomeness Demonstration 4: Hygiene and sanitation practices Demonstration 5: Quality control at retail store (slide show) |
|
Source: Dr. Low Lai Kim, Primary Production Department (PPD), Singapore
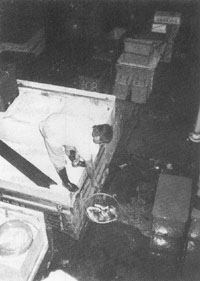
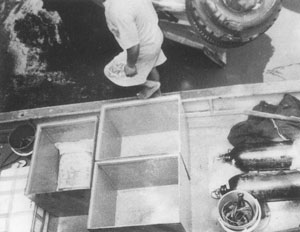
Figure 66. Overall view of an operational vivier truck. Jurong wholesale fish market, Singapore.
Figure 70. Side view of a live fish collection boat, equipped with oxygen cylinders. Singapore.
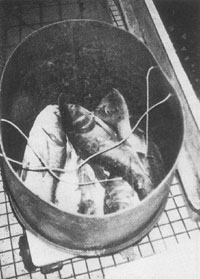
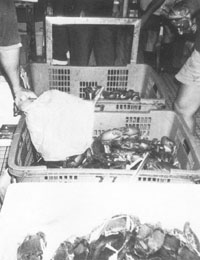
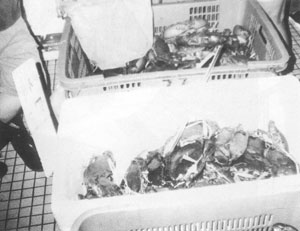
Figure 72. Handling live mangrove crabs, Senoko wholesale fish market, Singapore.
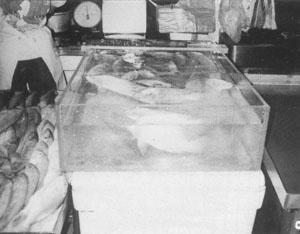
Figure 73. Display of live fish in aquariums. Public food market, Singapore.
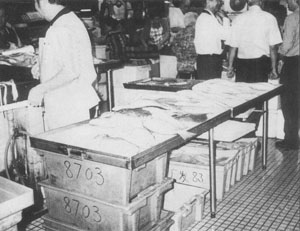
Figure 76. Display of fresh fish on stainless steel display tables. Public market, Singapore.
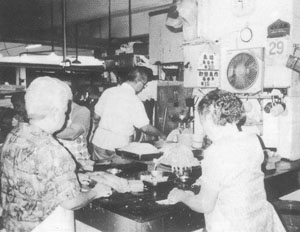
Figure 77. Overall view of a typical fresh fish retail stall. Public market. Singapore.
Figure 79. Overall view of a typical minced fish retail stall. Public food market, Singapore.
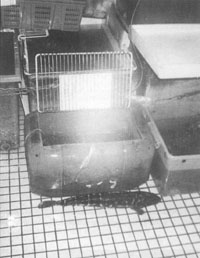
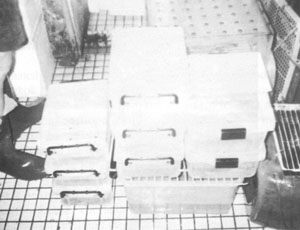
Figure 81. Display of live fish in HDPE boxes with cover. Public food market. Singapore.
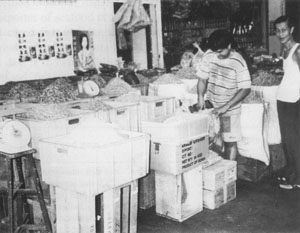
Figure 82. Overall view of a typical cured fish wholesale stall, Singapore.
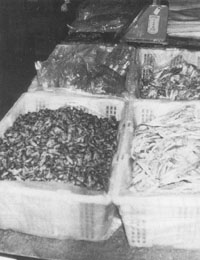
Figure 83. Display of dried fish using a folding trestle table. Wholesale food market, Singapore.
|
[15] Association of Southeast
Asian Nations (ASEAN),with the following member countries: Brunei Darussalam,
Cambodia, Indonesia, Laos, Malaysia, Myanmar, the Philippines, Singapore,
Vietnam and Thailand. [16] Based on the international database of the US Census Bureau, International Programs Center, 2000 (http://www.census.gov). [17] In February 2000, the rate of exchange was US$ 1.00 equal to 1.722 Singapore dollars. [18] Based on data on shelf lives of comminuted fishery products from “Southeast Asian Fishery Products”, third edition, 1996, published by MFRD/SEAFDEC. |
![]()
![]()
![]()
 ] No [ ]