![]()
![]()
![]()
In the previous issue of Forest Genetic Resources (No. 28), we informed our readers about the development of the Global Forest Resources Assessment Programme FRA 2000. The main report is now available. It contains up-to-date information, with a baseline of the year 2000 on forest resources by region of the world including description of geography; the ecological setting; forest status in terms of coverage; volume and biomass; forest management; protection status in terms of legally protected areas; and assessment of trends in forest cover change. It also contains 13 thematic chapters, a number of these chapters being interesting from a forest genetic resources prespective. This includes among others chapters on plantations, biological diversity and global ecological maps.[27]
The following text will concentrate on selected findings on forest plantations.[28]
REGIONAL FOREST PLANTATION AREAS, SPECIES AND ANNUAL PLANTINGS[29]
Forest plantations covered 187 million hectares in year 2000, of which Asia accounted for 62%. The forest plantation area is a significant increase over the 1995 estimate of 124 million hectares. The reported new annual planting rate is 4.5 million hectares globally, with Asia and South America accounting for 89%. Table 1 and Figure 1, 2 and 3 details the annual plantation rates and plantation areas by regions and species groups.
Table 1. Annual plantation rates of new plantation and plantation areas by regions and species groups in 2000
|
Region
|
Total Area |
Annual Planting Rate of New Plantation |
Plantation Areas (000 ha) by Species Groups |
|||||||
|
000 ha |
000 ha/yr |
Acacia |
Eucalyptus |
Hevea |
Tectona |
Other Broadleaf |
Pinus |
Other Conifer |
Unspecified |
|
|
Africa |
8 036 |
194 |
345 |
1 799 |
573 |
207 |
902 |
1 648 |
578 |
1 985 |
|
Asia |
115 847 |
3 500 |
7 964 |
10 994 |
9 058 |
5 409 |
31 556 |
15 532 |
19 968 |
15 365 |
|
Europe |
32 015 |
5 |
- |
- |
- |
- |
15 |
- |
- |
32 000 |
|
Nth/Central America |
17 533 |
234 |
- |
198 |
52 |
76 |
383 |
15 440 |
88 |
1 297 |
|
Oceania |
3 201 |
50 |
8 |
33 |
20 |
7 |
101 |
73 |
10 |
2 948 |
|
South America |
10 455 |
509 |
- |
4 836 |
183 |
18 |
599 |
4 699 |
98 |
23 |
|
World Total |
187 086 |
4 493 |
8 317 |
17 860 |
9 885 |
5 716 |
33 556 |
37 391 |
20 743 |
53 618 |
The top ten countries according to total area include: China, 24%; India, 17%; Russia, 9%; USA, 9%; Japan, 6%; Indonesia, 5%; Brazil, 3%; Thailand, 3%; Ukraine, 2% and Iran, 1%.
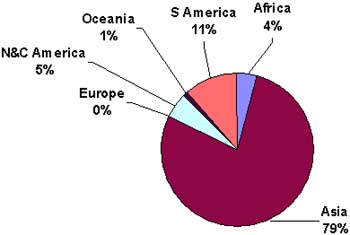
Figure 2. Distribution of annual new planting area.
The global new planting rate is estimated at 4.5 million ha/year, with Asia (79%) and South America (11%) accounting for 90%.
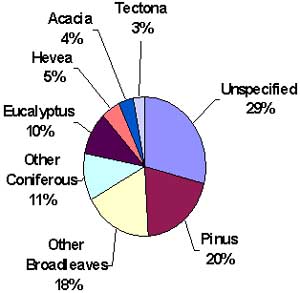
Figure 3. Distribution og plantation areas by species.
Broadleaf species account for 40% of global forest plantation resources, conifers, 31% and not specified, 29%. In terms of genera composition, Pinus (20 percent) and Eucalyptus (10 percent) remain dominant genera world wide, although overall diversity of species planted was shown to be increasing compared to 1990. There are differences in the main species between the regions (see also Figure 4 to Figure 8). In Asia broadleaves make up 57% of which Eucalyptus, Hevea, Acacia, Tectona as main genera. Conifers make up 30% of primarily Pinus species. In North and Central America, Pinus species account for 88% of area planted.
In South America broadleaves make up 52%, of which Eucalyptus is the principal genera. Conifers make up 45% of which Pinus is the main genus.
In Africa broadleaves make up 47%, mainly with Eucalyptus, Hevea, Acacia, and Tectona. Conifers make up 28%, of which Pinus is the primary group.
In Oceania the species distribution is primarily unspecified.
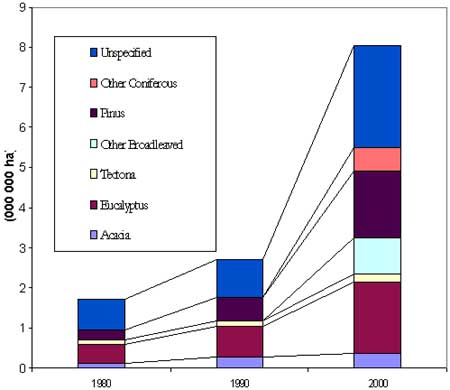
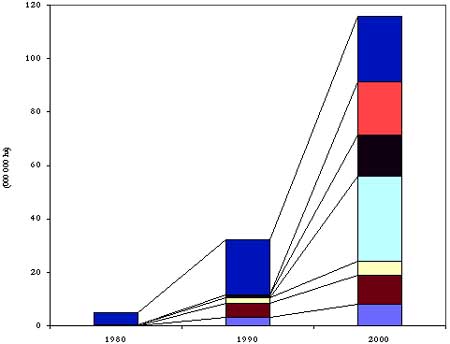
GLOBAL SPECIES TRENDS, 1980-2000
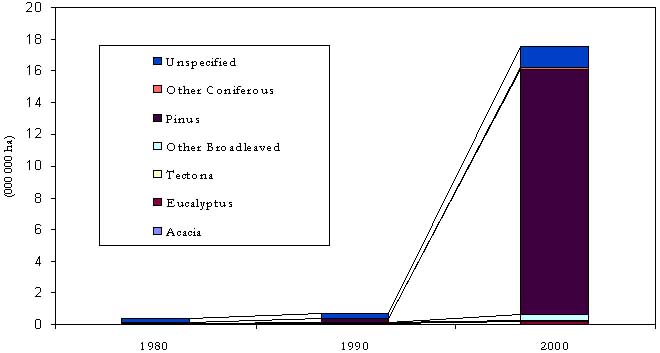
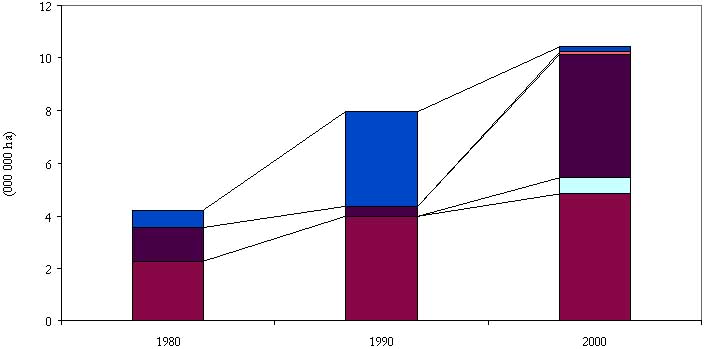
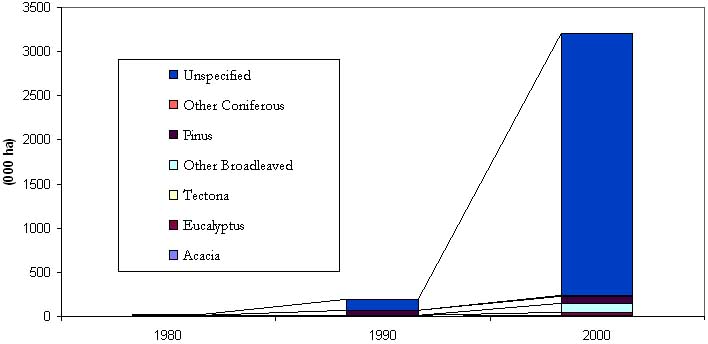
Species trends from FRA 1980, FRA 1990 and FRA 2000[30] are graphically illustrated below by regions as shown in Figure 4 to Figure 8 (Source: FAO 1981, FAO 1990, FAO 2001a)[31]. The graphics (not to scale) illustrate relative growth within the region over the period and show trends in genera and species used.
Figure 4. Plantation area in Africa by species groups (1980-2000).
Figure 5. Plantation area in Asia by species groups (1980-2000).
Figure 6. Plantation area in N&C America by species groups (1980-2000).
Figure 7. Plantation area in South America by species groups (1980-2000).
Figure 8. Plantation area in Oceania by species groups (1980-2000)
PURPOSE AND OWNERSHIP WITHIN THE GLOBAL FOREST PLANTATION ESTATE
Purpose and ownership of forest plantations varies markedly between regions. Industrial plantations provide the raw material for wood processing for commercial purposes, including timber for construction, panel products and furniture, and pulpwood for paper. In contrast, non-industrial plantations are aimed for example at supplying fuelwood, providing soil and water conservation, wind protection, biological diversity conservation and other non-commercial purposes. In many countries, particularly in the developing world, the end purpose of the plantations is not clearly defined at the outset. In some of these cases, valuable tree resources are established which coincidentally match future needs. However, in others the lack of planning may result in plantations which have little commercial value and a low potential for local use. Table 2 details regional plantation areas by purpose and ownership for the global forest plantation estate.
Table 2. Regional plantation areas by purpose and ownership, 000 ha
|
Region
|
Total Area |
Industrial Purpose (000) ha |
Non-Industrial Purpose (000) ha |
Purpose Unspec.
|
||||||||
|
|
Public |
Private |
Other |
Unspec. |
Sub-Total |
Public |
Private |
Other |
Unspec. |
Sub-Total |
||
|
Africa |
8 036 |
1 770 |
1 161 |
51 |
410 |
3 392 |
2 035 |
297 |
611 |
330 |
3 273 |
1 371 |
|
Asia |
115 847 |
25 798 |
5 973 |
27 032 |
- |
58 803 |
17 177 |
17 268 |
9 145 |
72 |
43 662 |
13 381 |
|
Europe |
32 015 |
- |
- |
- |
569 |
569 |
9 |
6 |
- |
- |
15 |
31 431 |
|
N&C America |
17 533 |
1 446 |
15 172 |
118 |
39 |
16 775 |
362 |
58 |
16 |
35 |
471 |
287 |
|
Oceania |
3 201 |
151 |
14 |
- |
24 |
189 |
2 |
3 |
- |
19 |
24 |
2 987 |
|
South America |
10 455 |
1 061 |
3 557 |
|
4 827 |
9 445 |
251 |
528 |
- |
225 |
1 004 |
6 |
|
World Total |
187 086 |
30 226 |
25 876 |
27 202 |
5 871 |
89 175 |
19 836 |
18 161 |
9 772 |
680 |
48 449 |
49 463 |
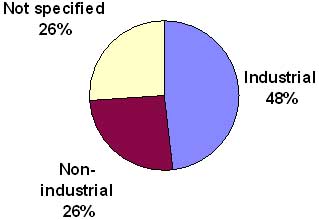
Source: FAO 2001a (FRA 2000) (numbers may not tally due to rounding)Globally, 48% of the forest plantation estate is for industrial end-use; 26% for non-industrial (fuelwood, soil and water conservation, other); and 26% is not specified as shown in Figure 9. Industrial plantation resources are dominated by China, India and USA, while non-industrial plantation resources are dominated by China, India, Thailand and Indonesia;
Figure 9. Distribution of forest plantations end-use.
Forest plantation ownership is public, 27%; private, 24%; other, 20% and not specified, 29%.
Industrial plantations are 34% publicly owned, 29% privately owned and 37% other or unspecified. Within non-industrial plantations, 41% are publicly owned, 37% are privately owned and 22% are other or unspecified.
IMPACT OF THE FOREST PLANTATION ESTATE
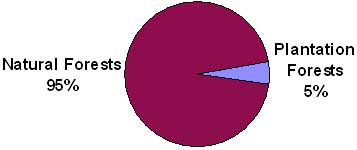
The potential for forest plantations to partially meet demand from natural forests for wood and fibre for industrial uses is increasing. According to FRA 2000, global forest plantation area accounts for only 5% of global forest cover and the industrial forest plantation estate for less than 3%.
Figure 10. Plantation and natural forest area.
As an indication only, forest plantations were estimated in the year 2000 to supply about 35% of global roundwood, with anticipated increase to 44% by 2020 (ABARE & Jaakko Pöyry, 1999). If targeted at the most appropriate ecological zones and sustainable forest management principles are applied, forest plantations can provide a critical substitute for natural forest raw material supply. In several countries industrial wood production from forest plantations has significantly substituted for wood supply from natural forests resources.
Forest plantations in New Zealand met 99% of the needs for industrial roundwood in the country in 1997; the corresponding figure in Chile was 84%, Brazil, 62% and Zambia and Zimbabwe, 50% each. Other sources outline a similar trend[32]. This substitution by forest plantations may help reduce logging pressure on natural forests in areas in which unsustainable harvesting of wood is a major cause of forest degradation and where logging roads facilitate access that may lead to deforestation.
Forest plantations also provide additional non-wood forest products, from the tree planted or from other elements of the ecosystem they help to create. They contribute to environmental, social and economic benefits. Forest plantations are used in combating desertification, protecting bio-diversity, absorbing carbon to offset carbon emissions, protecting soil and water values, rehabilitating lands exhausted from other land-uses, providing rural employment, and if planned effectively, diversifying the rural landscape.
In addition trees are increasingly being planted to support agricultural production systems, community livelihoods, alleviate poverty and to provide food security. Communities and smallholder investors, including individual farmers, grow trees as shelterbelts, home gardens, woodlots and a diverse range of agroforestry systems to provide wood, non-wood forest products, fuelwood, fodder and shelter. Outgrower schemes under various forms of contract with wood processing industries can also provide valuable sources of wood supply. Smallholder investors are producing an increasing proportion of decorative veneer species, especially teak, using such schemes.
CONCLUSIONS
Forest plantations covered 187 million hectares in year 2000, of which Asia accounted for 62%. The forest plantation area is a significant increase over the 1995 estimate of 124 million hectares. The reported new annual planting rate is 4.5 million hectares globally, with Asia and South America accounting for 89%. About 3 million hectares are estimated to be succesful. Globally, half the forest plantation estate is for industrial end-use; one quarter for non-industrial end-use and one quarter not specified. Forest plantation ownership is public, 27%; private, 24%; other, 20% and not specified, 29%. Globally, Eucalypts and Acacias are the main fast growing, short rotation genera. Pines and other coniferous species are the main medium rotation utility species, primarily in the temperate and boreal zones.
The bases of the global forest resources assessment of forest plantations and reliability of data have varied markedly between FRA 1980, FRA 1990 and FRA 2000. The unspecified species has reduced from 81% in 1980, 58% in 1990 to 34% in 2000. Broadleaf species increased from 12% in 1980 to 36% in 1990 and 40% in 2000. Conifers increased from 4% in 1980, to 6% in 1990 and 31% in 2000. Although in 2000 there remained 26% unspecified purpose, industrial purpose increased from 39% in 1980, 36% in 1990 to 48% in 2000, with the significant increase in the last decade. There has been a corresponding decrease in non-industrial purpose forest plantations.
The potential for forest plantations to partially meet demand from natural forests for wood and fibre for industrial uses is increasing. Although accounting for only 5% of global forest cover, forest plantations were estimated in the year 2000 to supply about 35% of global roundwood, with anticipated increase to 44% by 2020. In some countries forest plantation production already contributes the majority of industrial wood supply.
REFERENCES:
ABARE & Jaakko Pöyry 1999. Global outlook for plantations. ABARE research report 99.9, Canberra, Australia, 107 pp.
Carle, J., Del Lungo, A. and Vuorinen, P.. 2001. Preliminary Analysis of Forest Plantation Development 1980-2000. Proceedings of the ANPA-IUFRO-Dalarna University International Conference on Nursery Production and Stand Establishemnt of Broad-Leaves, Rome, 7-10 May 2001
FAO 1981. Forest resources assessment project. (FRA 1980) FAO, Rome, Italy.
FAO 1995. Forest resources assessment 1990, Tropical forest plantation resources. (FRA 1990) FAO Forestry Paper 128. FAO, Rome, Italy.
FAO 2000. The global outlook for future wood supplies from forest plantations. Brown, C., FAO Working Paper GFPOS/WP/03. FAO, Rome, Italy. 129 pp.
FAO, 2001a. Global forest resources assessment 2000(FRA 2000). Main report. FAO Forestry Paper 139 (in press) http://www.fao.org/forestry/fo/fra/index.jsp FAO, Rome.
FAO. 2001b. Non-forest tree Plantations. Report based on the work of W. Killmann. Forest Plantation Thematic Papers. Forest Resources Development service, Forest Resources Division. FAO, Rome. (unpublished)
Sedjo, R.A. 2001. The role of forest plantations in the world’s future timber supply. The Forestry Chronicle Vol 77. No. 2: 221-225.
![]()
![]()
![]()