Because cassava is easy to grow and does not require intensive land preparation and a smooth seed bed, the crop is often grown on steep hillsides. These hillsides are often already depleted and eroded by production of other crops, and cassava may be the only crop that will still grow on the highly infertile and acid soils. When cassava is grown on steep slopes, or even on gentle but long slopes (like in Thailand), runoff and erosion can be a problem. The question often asked is whether cassava is the cause of severe erosion, or merely the result of erosion, as it is still capable of producing some yield on poor eroded soils where other crops would fail. In other words, does the cultivation of cassava result in more erosion than the cultivation of other crops?
Table 11. Nutrient removal and application in the production of cassava in various regions of Vietnam Vietnam in 1991/92.
| |
Cassava root yield (t/ha) |
Nutrient removal (kg/ha)1) |
Nutrients applied (kg/ha)2) |
Nutrient balance (kg/ha)3) |
|||||||
|
N |
P4) |
K4) |
N |
P |
K |
N |
P |
K |
|||
|
Total Vietnam |
9.04 |
60.4 |
6.9 |
44.0 |
47.7 |
31.3 |
35.2 |
-12.7 |
24.4 |
-8.8 |
|
| |
North Vietnam |
8.61 |
57.5 |
6.5 |
41.9 |
50.1 |
42.1 |
47.2 |
-7.4 |
35.6 |
5.3 |
|
-North Mountainous Region |
9.19 |
61.4 |
7.0 |
44.8 |
28.7 |
23.0 |
23.5 |
-32.7 |
16.0 |
-21.3 |
|
|
-Red River Delta |
8.66 |
57.8 |
6.6 |
42.2 |
86.6 |
69.1 |
96.4 |
28.8 |
62.5 |
54.2 |
|
|
-North Central Coast |
7.30 |
48.8 |
5.5 |
35.6 |
76.9 |
70.2 |
66.8 |
28.1 |
64.7 |
31.2 |
|
| |
|
|
|
|
|
|
|
|
|
|
|
| |
South Vietnam |
9.60 |
64.1 |
7.3 |
56.0 |
45.4 |
22.2 |
25.1 |
-18.7 |
14.9 |
-21.7 |
|
-South Central Coast |
8.66 |
57.8 |
6.6 |
50.5 |
69.3 |
40.0 |
41.5 |
11.5 |
33.4 |
-0.7 |
|
|
-Central Highlands |
7.69 |
51.4 |
5.8 |
44.8 |
5.2 |
1.4 |
1.2 |
-46.2 |
-4.4 |
-36.3 |
|
|
-Southeastern Region |
13.29 |
88.8 |
10.1 |
77.5 |
33.4 |
8.8 |
15.5 |
-55.4 |
-1.3 |
-49.2 |
|
1) Assuming all plant parts are removed from the field and nutrient removal per ton of fresh roots harvested is: 6.68 kg N, 0.76 kg P and 4.87 kg K (Table 9)
2) Nutrients applied as organic manures and chemical fertilizers
3) Nutrient balance = nutrients applied - nutrients removed in harvested products
4) P and K in elemental form
Source: Howeler et al., 2001
Figure 8 shows a summary by Quintiliano et al. (1961) of the results of 48 erosion trials conducted in four experiment stations in Sao Paulo state of Brazil from 1943 to 1959, comparing the effect of different crops and management practices on soil loss by erosion and on runoff (see Appendix 2 for more details). Figure 8 shows that highest soil losses and runoff were observed in castor bean, common bean (Phaseolus vulgaris) and cassava (33.5 t/ha of soil loss and 11.4% of rainfall lost as runoff), followed by peanut, rice, cotton, soybean, potato, sugarcane, maize and sweetpotato. Using the relative soil loss as the criterion, with castor bean considered 100, then cassava would have an index of 83, below that of beans (92), but higher than peanut (64), rice (60), cotton (60), soybean (48), sugarcane (30), maize (29) and sweetpotato (16).
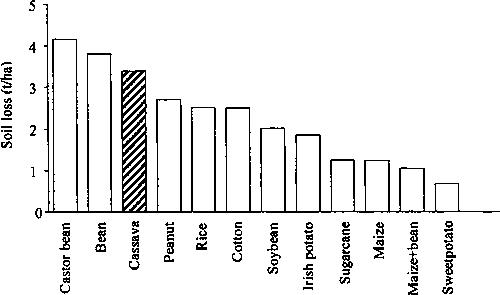
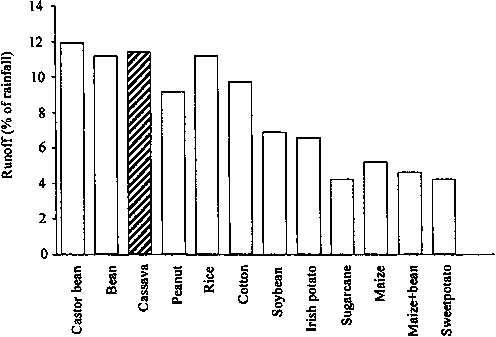
Figure 8. Effect of crops on annual soil loss by erosion (top) and on runoff (bottom). Data are average values (corrected for a standard annual rainfall of 1,300 mm) from about 48 experiments conducted from 1943 to 1959 on sandy, clayey and Terra roxa soils with slopes of 8.5-12.8%.
Source: Quintiliano et al., 1961.
In other trials conducted for ten years on 12% slope on a red-yellow Podzolic soil in Pernambuco, Brazil, Margolis and Campos Filho (1981) reported that cassava on average produced an annual soil loss of 11.0 t/ha, compared with 8.3 t/ha for cotton, 3.0 for maize, 2.8 for velvet bean (Mucuna sp.) and 0.4 t/ha for guinea grass (Panicum maximum), while soil loss on a bare plot was 59.9 t/ha. Although annual soil losses were much lower than those reported by Quintiliano et al. (1961), crops are listed in a similar order.
Table 12 shows similar data for soil losses in eight crops planted during four years on 7% slope in Sri Racha, Thailand (Putthacharoen et al., 1998). By far, highest levels of erosion were observed in cassava for root production (planted at 1.0 x 1.0 m), followed by cassava for forage production (planted at 0.5 x 0.5 m), mungbean, sorghum, peanut, maize and pineapple. Annual erosion losses for cassava averaged about 75 t/ha, while the average yield was 16 t/ha of fresh roots. Thus, nearly 5 tonnes of soil were lost for every tonne of roots produced. These are extremely high rates of erosion on a slope of only 7%.
Table 12. Total dry soil loss by erosion (t/ha) due to the cultivation of eight crops during four years on 7% slope with sandy loam soil in Sri Racha, Thailand from 1989 to 1993.
| |
No. of crop cycles |
First Period (22 months) |
Second period (28 months) |
Total (50 months) |
|
|
Cassava for root production |
4 |
142.8 a |
168.5 a |
311.3 |
|
|
Cassava for forage production |
2 |
68.8 b |
138.5 ab |
207.3 |
|
|
Maize |
5 |
28.5 d |
35.5 cd |
64.0 |
|
|
Sorghum |
5 |
42.9 c |
46.1 cd |
89.0 |
|
|
Peanut |
5 |
37.6 cd |
36.2 cd |
73.8 |
|
|
Mungbean |
6 |
70.9 b |
55.3 cd |
126.2 |
|
|
Pineapple1) |
2 |
31.4 cd |
21.3 d |
52.7 |
|
|
Sugarcane1) |
2 |
- |
94.0 bc |
- |
|
| |
|
|
|
|
|
| |
F-test |
|
** |
** |
|
|
cv (%) |
|
11.4 |
42.7 |
|
|
1) Second cycle is ratoon crop; sugarcane only during second 28-month period
Source: Putthacharoen et al., 1998.
Erosion losses for cassava in the Thai study were much higher than those of other crops mainly because cassava was planted at a rather wide spacing while initial plant growth was slow, leaving much soil exposed to the direct impact of rainfall during 3-4 months after planting and before the canopy closed. In contrast, the other annual food crops were planted at much higher population densities (50,000-100,000 plants/ha) and had a faster initial growth. Moreover, these row crops were planted along contour lines, which helps considerably in reducing runoff and erosion. Except for mungbean, which was planted six times in four years, all other food crops could be planted only once a year due to the relatively short (6 month) rainy season in Thailand. Once harvested, the fields remained in weeds with crop residues protecting the soil from further erosion (Figure 9) (Putthacharoen et al., 1998).
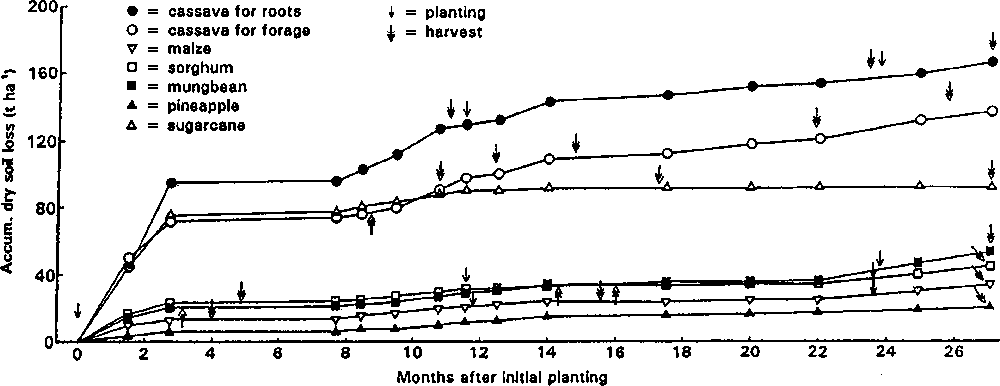

Figure 9. Accumulative dry soil loss due to erosion in various crops grown during a 27 month period on 7% slope in Sri Racha Thailand, from 1991 to 1993. Arrows indicate time of planting and harvest. Rainfall distribution is shown below.
Source: Putthacharoen et al., 1998.
In regions with a longer wet season it is often possible to plant short-cycle food crops, such as maize, rice, soybean, mungbean and peanut, twice a year. In that case, because of more frequent land preparation and weeding soil losses tend to increase. Comparing one crop of cassava with two successive crops of maize, soybean, peanut and a rice-soybean rotation, Wargiono et al. (1998) reported that annual soil losses for cassava were similar to those obtained with two successive crops of soybean, slightly higher than the rice-soybean rotation or two crops of maize, and about twice as high as that of two crops of peanut.
Sheng (1982) reported that in Taiwan, with 2500 mm annual rainfall and on slopes of 20-52%, erosion in cassava was 128 t/ha, compared with 62 for pineapple, 92 for banana, 172 for sweetpotato and 208 t/ha for sorghum, peanut, sweetpotato, soybean and maize grown in rotation. In that case, cassava cultivation resulted in less erosion than the growing of several short-cycle crops in rotation during the same year.
Finally, when four successive crops of beans (Phaseolus vulgasis) were grown on 15% and 30% slope in Popayan, Cauca, Colombia, during the same 17-month period as one crop of cassava, soil losses for beans in both trials were about four times higher than for cassava[15], due to the frequent land preparation and weeding required for the beans (Howeler, 1987; 1991a). Once the cassava canopy was well established, runoff and erosion losses were greatly diminished; this was also reported by Tongglum et al. (1992), Howeler (1995), Tian et al. (1995) and Wargiono et al. (1995, 1998).
While slow initial growth and the need for wide plant spacing are intrinsic characteristics of the crop, they can be mitigated against somewhat by planting at a closer spacing, by selecting more vigorous varieties, and by enhancing early growth through fertilizer application. All these have been shown to markedly reduce erosion (see below).
Cultivation of cassava, in general, causes more erosion than that of other annual crops grown under similar conditions, especially if those other crops are planted only once a year. The high levels of erosion observed in cassava fields are due to the wide plant spacings used and the slow initial growth of the crop.
Another way to compare crops or land use systems in terms of their effect on soil erosion is to calculate the C-factor used in the Universal Soil Loss Equation (USLE), as suggested by Wishmeier (1960). In this methodology erosion in a particular crop is measured on (or corrected to) a standard runoff plot of 22 m length and a slope of 9%, and compared with soil losses on a similar but bare plot. The latter is given a value of 1.0, while the C-factor of the crop is a fraction thereof in proportion to the soil losses measured in the crop versus that on bare (tilled and weed-free) soil.
In order to put the effect of cassava cultivation on erosion in perspective, Table 13 summarizes C-value data from four sources in the literature. As the data indicate, there is no doubt that natural or planted forests and natural or well-managed grasslands protect the soil better and cause less erosion than annual crops. The perennial plantation crops and fruit trees, like oil palm, cacao, coffee, cashew, mango, jackfruit and bananas have C-values of 0.1-0.3, which is not too different from some annual crops like upland rice or moderately grazed pastures. Other annual crops, like maize, sorghum, peanut, soybean, cotton and tobacco seem to cause slightly more erosion than pineapple, but less erosion than cassava. Cassava has a very wide range of C-values, which indicates that erosion depends mainly on the way the crop is managed, such as plant spacing, fertilizer application or ridging. Leihner et al. (1996) actually reported very low C-values, comparable to those of well-managed range land, when forage legumes were grown as a ground cover under cassava. While highly sustainable, this practice is seldom economically viable as the cover crops compete strongly with cassava, resulting in very low cassava yields (see below).
According to the C-values reported in the literature, cassava is indeed a crop that can cause severe erosion, but the level of soil loss is highly variable, depending on the management of the crop.
According to the USLE, soil loss by erosion is a function of the erosivity of the rainfall, the erodability of the soil, the length and gradient of the slope, the crop (C-factor) and management (P-factor). Farmers make the choice of crop and decide about its management; they may also determine to some extent the slope length and gradient by selecting the site of planting within the boundaries of their farm, or they can change the length and slope by contour barriers or terracing.
Table 14 shows average dry soil losses measured in cassava erosion control experiments in seven countries. Even though slope gradients were greatest in Colombia, soil losses were relatively low due to well-aggregated high-OM soils. Erosion losses were highest in Hainan island of China due to high intensity rains in the early part of the growing season when cassava plants grow slowly because of low temperatures in spring. Thus, the extent of erosion is determined by many factors that are beyond the control of farmers.
Little information exists about the amounts of nutrients lost in eroded sediments and runoff. In most cases where sediments have been analyzed, results are reported as total N (organic + inorganic N), available P and exchangeable K, Ca and Mg. The total loss of P, K, Ca and Mg in the sediment could be an order of magnitude higher than the "available" or "exchangeable" fractions reported. Table 15 shows results from cassava experiments conducted in Thailand and Colombia. Nutrient losses were a direct function of the amount of soil eroded: practices that reduced erosion automatically reduced nutrient losses. N losses ranged from 4 to 37 kg/ha, while exchangeable K and Mg losses ranged from 0.13 to 5.1 and from 0.1 to 5.4 kg/ha, respectively. Available P losses were considerably lower, ranging from 0.02 to 2.2 kg/ha. As mentioned above, total nutrient losses are considerably higher but no data are available from cassava fields.
Table 13. C-values for various land uses and crops calculated by the Universal Soil Loss Equation, as reported by four sources in the literature.
|
Vegetative Cover/Crop |
C-value |
||||
|
1) |
2) |
3) |
4) |
||
|
Forest |
|
|
|
|
|
| |
Primary forest (with dense undergrowth) |
0.001 |
0.001 |
|
|
|
Second-growth forest with good undergrowth and high mulch cover |
0.003 |
|
|
|
|
|
Second-growth forest with patches of shrubs and plantation crops of five years or more |
0.006 |
|
|
|
|
| |
|
|
|
|
|
|
Industrial Tree Plantations |
|
|
|
|
|
| |
Benguet pine with high mulch cover |
0.007 |
|
|
|
|
Mahogany, Narra, eight years or more with good undergrowth |
0.01-0.05 |
|
|
|
|
|
Mixed stand of industrial tree plantation species, eight years or more |
0.07 |
|
|
|
|
| |
|
|
|
|
|
|
Agroforesty Tree Species |
|
|
|
|
|
| |
Mixed stand of agroforestry species, five years or more with good cover |
0.15 |
|
|
|
|
Coconuts, with annual crops as intercrop |
0.1-0.3 |
|
|
|
|
|
Leucaena leucocephala, newly cut for leaf meal or charcoal |
0.3 |
|
|
|
|
|
Cashew, mango and jackfruit, less than three years, without intercrop and with ring weeding |
0.25 |
|
|
|
|
|
Oil palm, coffee, cacao with cover crops |
|
0.1-0.3 |
|
|
|
| |
|
|
|
|
|
|
Grasslands |
|
|
|
|
|
| |
Imperata or thermeda grassland, well established and undisturbed, with shrub |
0.007 |
|
|
|
|
Shrubs with patches or open, disturbed grasslands |
0.15 |
|
|
|
|
|
Well-managed rangeland, cover of fast development, ungrazed two years or more |
0.01-0.05 |
|
|
|
|
|
Savanah or pasture without grazing |
|
0.01 |
|
|
|
|
Grassland, moderately grazed, burned occasionally |
0.2-0.4 |
|
|
|
|
|
Overgrazed grasslands, burned regularly |
0.4-0.9 |
|
|
|
|
|
Guinea grass (Panicum maximum) |
|
|
0.01 |
|
|
| |
|
|
|
|
|
|
Covercrops/green manures |
|
|
|
|
|
|
|
Rapidly growing cover crop |
|
0.1 |
|
|
|
Velvet bean (Mucuna sp) |
|
|
0.05 |
|
|
| |
|
|
|
|
|
|
Annual Cash Crops |
|
|
|
|
|
| |
Maize, sorghum |
0.3-0.6 |
0.3-0.9 |
0.05 |
|
|
Rice |
0.1-0.2 |
0.1-0.2 |
|
|
|
|
Peanut, mungbean, soybean |
0.3-0.5 |
0.4-0.8 |
|
|
|
|
Cotton, tobacco |
0.4-0.6 |
0.5 |
0.14 |
|
|
|
Pineapple |
0.2-0.5 |
|
|
|
|
|
Bananas |
0.1-0.3 |
|
|
|
|
|
Diversified crops |
0.2-0.4 |
|
|
|
|
|
New kaingin areas, diversified crops |
0.3 |
|
|
|
|
|
Old kaingin areas, diversified crops |
0.8 |
|
|
|
|
|
Cassava monoculture |
|
0.2-0.8 |
0.18 |
|
|
|
Cassava with well-established leguminous ground cover |
|
|
|
0.01-0.02 |
|
|
Crops with thick layer of mulch |
|
0.001 |
|
|
|
| |
|
|
|
|
|
|
Other |
|
|
|
|
|
| |
Built-up rural areas, with home gardens |
0.2 |
|
|
|
|
Bare soil |
1.0 |
1.0 |
1.0 |
1.0 |
|
Sources:
1)Data from David, 1987, for watersheds in the Philippines.
2)Data from Roose, 1977.
3)Data from Margolis and Campos Filho, 1981, for Pernambuco, Brazil.
4)Data from Leihner et al., 1996, for Cauca, Colombia.
Table 14. Average dry soil loss due to erosion measured in cassava trials in various countries of Asia and in Colombia, S. America.
|
Country |
Site |
Annual rainfall (mm) |
Slope (%) |
Soil texture |
Organic matter (%) |
Dry soil loss (t/ha) |
|
China |
Shifeng, Hainan |
2000 |
8 |
sandy clay loam |
2.4 |
154 |
|
SCATC, Hainan |
1800 |
15 |
clay |
1.8 |
128 |
|
|
SCATC, Hainan |
1800 |
25 |
clay |
2.0 |
144 |
|
|
Nanning, Guangxi |
1405 |
12 |
clay |
1.7 |
16 |
|
|
Indonesia |
Malang, E. Java |
2052 |
8 |
clay |
1.5 |
42 |
|
Tamanbogo, Lampung |
2180 |
5 |
clay |
1.8 |
47 |
|
|
Umas Jaya, Lampung |
2180 |
3 |
clay |
2.7 |
19 |
|
|
Malaysia |
MARDI, Serdang |
2300 |
6 |
clay |
- |
10 |
|
Philippines |
Baybay, Leyte |
2000 |
25 |
clay loam |
1.9 |
54 |
|
Thailand |
Sri Racha, Chonburi |
1300 |
8 |
sandy loam |
0.6 |
15 |
|
Sri Racha, farmer's field |
1300 |
8 |
sandy loam |
0.5 |
18 |
|
|
Pluak Daeng, Rayong |
1400 |
5 |
sandy loam |
0.7 |
21 |
|
|
Vietnam |
Agric. Col.#3, Thai Nguyen |
2100 |
5 |
sandy clay loam |
1.6 |
23 |
|
Agric. Col.#3, Thai Nguyen |
2100 |
10 |
sandy clay loam |
1.6 |
39 |
|
|
Agric. Col.#3, Thai Nguyen |
2100 |
15 |
sandy clay loam |
1.6 |
105 |
|
|
Colombia |
Mondomito, Cauca |
2130 |
27 |
clay |
4.7 |
45 |
|
Mondomito, Cauca |
2130 |
30 |
clay |
- |
2 |
|
|
Las Pilas, Cauca |
2130 |
40 |
clay loam |
11.0 |
3 |
|
|
Agua Blanca, Cauca |
2130 |
42 |
clay loam |
5.1 |
18 |
|
|
Popayan, Cauca |
2500 |
15 |
loam |
24.8 |
15 |
|
|
Popayan, Cauca |
2500 |
25 |
loam |
24.8 |
7 |
Source: Adapted from Howeler, 1994.
Table 15. Nutrients in sediments eroded from cassava plots with various treatments in Thailand and Colombia.
|
Location and treatments |
Dry soil loss (t/ha/year) |
Nutrients in sediements (kg/ha/year) |
|||
|
N1) |
P2) |
K2) |
Mg2) |
||
|
Cassava on 7% slope in Sriracha, Thailand3) |
71.4 |
37.1 |
2.18 |
5.15 |
5.35 |
|
Cassava planted on 7-13% slope in Quilichao, Colombia4) |
5.1 |
11.5 |
0.16 |
0.45 |
0.45 |
|
Cassava with leguminous cover crops in Quilichao, Colombia4) |
10.6 |
24.0 |
0.24 |
0.97 |
0.81 |
|
Cassava with grass hedgerows in Quilichao, Colombia4) |
2.7 |
5.8 |
0.06 |
0.22 |
0.24 |
|
Cassava planted on 12-20% slope in Mondomo, Colombia4) |
5.2 |
13.3 |
1.09 |
0.45 |
0.36 |
|
Cassava with leguminous cover crops in Mondomo, Colombia4) |
2.7 |
6.5 |
0.04 |
0.24 |
0.20 |
|
Cassava with grass hedgerows in Mondomo, Colombia4) |
1.5 |
3.5 |
0.02 |
0.13 |
0.10 |
1) Total N
2) Available P, and exchangeable K and Mg
3) Source: Putthacharoen et al., 1998.
4) Source: Ruppenthal et al., 1997.
Phommasack et al. (1995, 1996) reported total nutrient losses in sediments and runoff from maize fields on 25-35% slope in Luang Prabang, Laos. In the second year of cropping, N, P and K losses in the eroded sediments (9.2 t/ha) were 53.9, 9.3 and 24.0 kg/ha, respectively, while those in the runoff (2,120 m3/ha) were 2.3, 0.9 and 26.1 kg/ha, respectively. Although in this case soil loss and runoff were not particularly high, nutrient losses in the sediments and runoff were substantial, especially that of N and K in the sediments and K in the runoff.
The loss of surface soil due to erosion can have serious on-site effects on the productivity of the land. This is seldom uniform across the landscape as soil is lost mainly on the steeper parts of the hillside but may be deposited at the bottom of the hill (Figure 10). The effect of topsoil loss on crop productivity depends on the crop, the depths of soil above bedrock, and the chemical and physical characteristics of the top- and subsoil. Loss by erosion of OM and nutrients, normally concentrated in the topsoil, will affect the productivity of almost all crops; but in soils with a very acid subsoil, loss of topsoil by erosion can limit root penetration and markedly reduce the productivity of those crops susceptible to soil acidity and high levels of Al. Lal (1976) reported that the loss of 10 cm of topsoil reduced the yields of maize and cowpea by about half. Figure 11 shows that in Mondomo, Colombia, the yield of cassava was also reduced to less than half when planted in eroded versus non-eroded soil. For the same region in Colombia, Howeler and Cadavid (1984) reported that without P application cassava yields were 7.7 t/ha in eroded and 22.6 t/ha in nearby non-eroded soil; with application of 115 kg P2O5/ha cassava yields were 18.3 and 30.0 t/ha in eroded and non-eroded soil, respectively. Thus, topsoil loss due to erosion can seriously reduce the productivity of the land. Even with the application of high rates of fertilizers, the productivity cannot easily be restored.
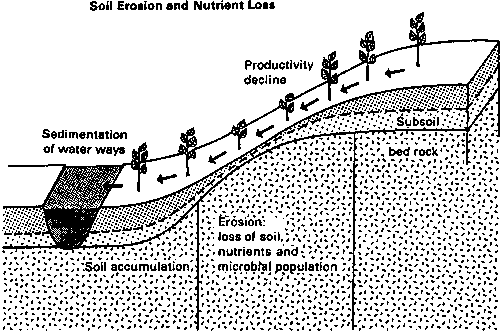
Figure 10. Conceptual representation of the differential effect of erosion in various parts of the landscape on soil depth, nutrient distribution and growth of crops.
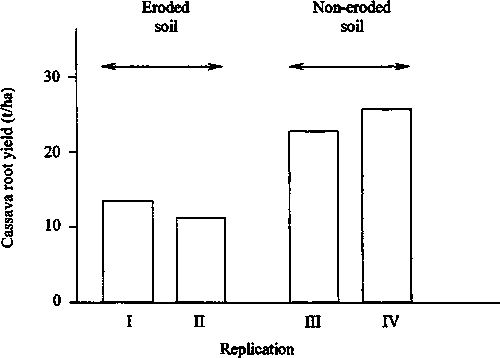
Figure 11. The average yield of 18 cassava varieties planted in two replications on an eroded slope and two replications on an adjacent non-eroded flat area in 1983/84 in Mondomo, Cauca, Colombia.
Source: Howeler, 1986.
|
[15] Due to the year-round
low temperature at about 1800 masl, cassava grew slowly and required 17 months
to produce a reasonable yield. |