This paper provides a short, preliminary overview of the state of world aquaculture and inland fisheries based on the 1998 data available in FAO’s Aquaculture and Inland Fisheries Statistics; FishStat Plus Version 2.3 http://www.fao.org/fi/statist/FISOFT/FISHPLUS.asp. This is a continuing biannual exercise that the FAO Fisheries Department undertakes to provide the most up-to-date information on aquaculture and inland fisheries production, issues and trends to member countries. More detailed analysis are made available to the FAO member countries through regular publications such as the Review of the State of World Aquaculture www.fao.org/fi/publ/circular/c886.1/c886-1.asp and the Review of the State of World Fishery Resources: Inland Fisheries http://www.fao.org/fi/publ/circular/ficirc.asp. Most of the aquaculture production data analyses given in this paper were derived from the information generated during the recent Conference on Aquaculture in the Third Millennium, held in Bangkok, Thailand, from 20 to 25 February 2000; in particular the review on "Increasing the Contribution of Aquaculture for Food Security and Poverty Alleviation" (Tacon, 2001). Technical Proceedings of the Conference on Aquaculture in the Third Millennium (NACA/FAO, 2001) containing detailed analysis and review of the entire aquaculture sector is being finalized and will be available by October 2001.
Aquaculture production
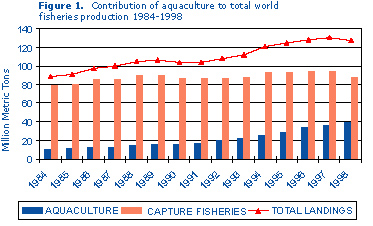
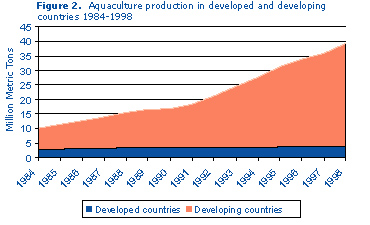
Aquaculture continues to be the world’s fastest growing food production sector, exhibiting an overall growth rate of over 11.0 percent per year since 1984 (Figure 1), compared with 3.1 percent for terrestrial farm animal meat production, and 0.8 percent for production from capture fisheries. By economic country grouping, approximately 90.0 percent and 82.2 percent of total world aquaculture production in 1998 was produced within developing countries (35.49 mt) and in particular within LIFDCs (Low-Income Food Deficit Countries) (32.41 mt). The developing country contribution to global aquaculture production has increased from 72.6 percent (7.37 mt) in 1984 to 90 percent (35.49 mt) in 1998, while the share of production from developed countries has decreased from 27.4 percent (2.78 mt) in 1984 to 10 percent (3.93 mt) in 1998 (Figure 2). Aquaculture production within LIFDCs has been growing over 5 times faster (13.7 percent per year since 1984) than within developed countries (2.7 percent per year since 1984), with aquaculture production within developing countries displaying an average growth rate of 12.8 percent per year between 1984 and 1998.
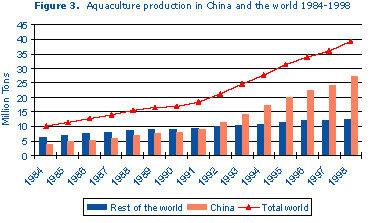
By region, Asia produced over 90.8 percent of total global aquaculture production by weight in 1998 (35.81 mt). Production in China represents 68.6 percent of the total global aquaculture production amounting to 27.1 mt in 1998. Apart from China, all of the world’s top ten aquaculture producing nations were found in Asia in 1998. These top ten producing countries represent 89.1 percent of total global aquaculture production by weight (Table 1). Second major region in terms of production by weight was Europe (4.97 percent or 1.96 mt).
Interestingly, analysis of global aquaculture production excluding China, showed a moderate growth rate, with production doubling from 6.32 mt in 1984 to 12.36 mt in 1998, and the sector growing at an average rate of 5.3 percent per year since 1984 (Figure 3). In general terms, aquaculture’s contribution towards total world fisheries production has increased threefold since 1984; aquaculture production increasing from 10.15 mt or 11.4 percent of total fisheries production in 1984 to 39.43 mt or 31.1 percent of total fisheries production in 1998 (Figure 1).
By continent, in 1998, aquaculture supplied 45.3 percent of total fisheries production in Asia (up from 21.1 percent in 1984), 10.9 percent of total production in Oceania (up from 3.7 percent in 1984), 10.2 percent in Europe (up from 6.9 percent in 1984), 8.0 percent in North America (up from 4.5 percent in 1984), 5.7 percent in South America (up from 0.5 percent in 1984) and 3.2 percent in Africa (up from 0.9 percent in 1984).
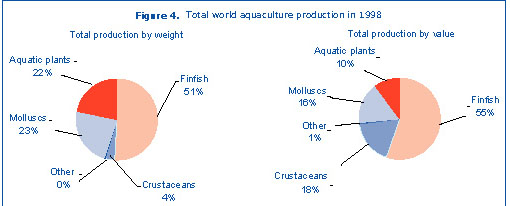
At the species group level, finfish contributed over half of total aquaculture production by weight in 1998 (20 mt or 50.8 percent), followed by molluscs (9.1 mt or 23.2 percent) and aquatic plants (8.5 mt or 21.7 percent) (Figure 4). The growth of the different major specific groups over the past decade has been rapid, with most groups exhibiting double digit growth rates over the period 1984 to 1998, including finfish (12.3 percent year, with production up by 6.7 percent since 1997), molluscs (11.5 percent per year, with production up by 6.5 percent since 1997), aquatic plants (7.7 percent per year, with production up by 18.9 percent since 1997), and crustaceans (16.0 percent per year, with production up by 13.9 percent since 1997).
In terms of per capita availability of `food fish’ from aquaculture (i.e. the production of farmed aquatic finfish and shellfish on a whole live weight basis, and excluding farmed aquatic plants; 30.86 mt in 1998), there was an increase by 261 percent from 1.45 kg in 1984 to 5.23 kg in 1998, with supply growing at an average rate of 10.4 percent per year. In contrast, per capita availability of `food fish’ from capture fisheries (i.e. 62.45 mt, excludes captured fish destined for reduction into fishmeal) has remained static, decreasing from 10.88 kg in 1984 to 10.58 kg in 1998. On the basis of the above data, over 33.1 percent of total global `food fish’ supplies were originated from aquaculture in 1998. Globally, more `food fish’ is consumed on a per capita basis than any other type of meat or animal protein (FAOSTAT, 2000) (http://apps.fao.org/page/collections?subset=agriculture). Although developing countries produced over two thirds of total food fish supply in 1998, per capita supply was highest in developed countries (23.2 kg in 1998, down from 25.6 kg in 1984), followed by developing countries (14.0 kg, up from 8.0 kg) and LIFDCs (13.6 kg, up from 6.9 kg). By region, per capita supply was highest in Oceania (20.2 kg, down from 21.3 kg), followed by Europe (19.7 kg, up from 17.8 kg), Asia (17.6 kg, up from 10.5 kg), North & Central America (16.8 kg, up from 16.6 kg), South America (9.8 kg, up from 7.9 kg), and Africa (7.0 kg in 1998, down from 8.1 kg in 1984) (FAOSTAT, 2000).
As the bulk of aquaculture is rural and subsistence, it plays a major role as a provider of direct and indirect employment to the rural poor and thereby contributing towards alleviating poverty. In many developing countries, aquaculture provides opportunities for diversification of farming systems, risk reduction and integration with agriculture. In terms of production, all regions, except Africa, have recorded a significant increase in per capita production between 1984 and 1998. While Asia continues to dominate world aquaculture in overall tonnage as well as in every major commodity, Latin America has registered a very high average annual growth between 1984 and 1998. In the following years, aquaculture will continue to be a major supplier of aquatic food. The primary aim of increasing aquaculture production should be pursued towards alleviating poverty and contributing to food security of the masses. This can only be achieved if further developments in aquaculture are environmentally sustainable, economically viable and socially responsible.
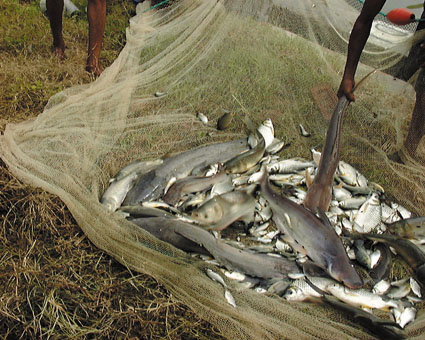
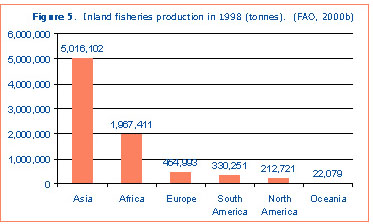
Inland fisheriesReported inland fisheries production was 8 million tonnes in 1998 (Figure 5), being 9 percent of the reported total capture fisheries production. However, actual catches may be at least twice the reported figure (see Box 1). The contribution of inland fishery resources to food security is, as a result of this under-reporting, greatly underestimated.
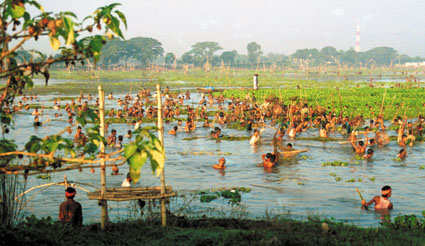
Inland capture fisheries are complex in nature, involving a wide variety of activities undertaken by people from diverse socio-economic backgrounds. Recreational fisheries, well established in many developed countries, are also becoming an important source of income and even food in some developing countries. Catch of freshwater fish is used with practically no discards and minimal wastage. Fishing methods, in many areas, are dominated by labour intensive gears used on an individual basis, or by small groups. This, coupled with the high level of artisanal, subsistence and other informal activities (e.g. local bartering of fisheries products), leads to a high degree of participation, including a significant number of women and children. For example, on the central Bangladeshi floodplains more than 65 percent of the rural population is involved in subsistence fishing (CPP, 1992, 2000). This level of participation, particularly among the low income and/or resource poor groups, is an important aspect of inland fisheries in relation to food security.
Threats to inland fisheries:
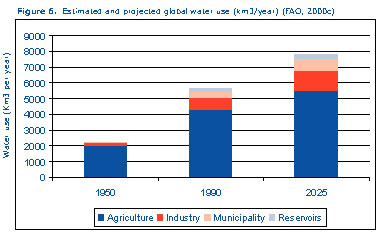
Environmental impacts arising from other sectors are the major constraints to sustaining, or increasing, production. Along with a growing human population, the rapid economic development in the world and of some of the Asian countries in particular, will likely impact freshwaters, especially through industrial effluents entering rivers and habitat loss and degradation. Demand for fresh water is also increasing, and will continue to increase (Figure 6), most likely resulting in adverse impact on fisheries, because of the weak position fishers have in influencing decision making in many countries. With an increasing human population using more fish and freshwater, pressure on inland fisheries may result in overfishing, loss of biodiversity and a failure to satisfy demand for inland fishery products. The introduction of alien species has helped improve production from inland fisheries, but has also caused harmful environmental and economic impacts (see following section).
 Way forward
Considerable potential exists for increased catches by rehabilitating freshwater habitats and the fisheries these habitats support. This has already led to improved fisheries in many countries, and is being considered as a serious option in many others. Another useful tool for increasing catches from inland waters is by applying and/or improving fishery enhancement techniques such as:
Introduced aquatic species have contributed to an improvement of everyday life of humans in many areas throughout the world. In Asia the African cichlid tilapias account for more then 700 000 tonnes of aquaculture production. Introduced salmonids support a thriving industry in Chile that is responsible for approximately 20 percent of the world’s farmed salmon. Globally the contribution of introduced species to total production ranges from 10 percent to about 17 percent, depending on taxon. However, introduced species are also recognized as a significant threat to indigenous species (Table 2).
The re-introduction of European flat oysters from Western North America to Western Europe infected native oysters with the protozoan parasite Bonamia, leading to the decimation of European flat oyster populations. Widespread movement of cultured tilapia in Africa has resulted in interbreeding with wild species or strains to the extent that natural populations are now extremely difficult, sometimes impossible, to find. Introduced Indian major carp in Bangladesh have lead to restricted access to fishing areas by rural fishermen.
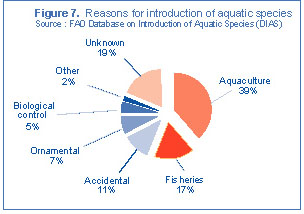
Species have been moved around the world for a variety of reasons, with aquaculture development being the primary motivation (Figure 7). Many impacts of introduced species are unknown, therefore FAO has established DIAS (Database on Introductions of Aquatic Species, http://www.fao.org/fi/statist/fisoft/dias/index.htm to keep track of introductions globally. It is expected that introductions and transfers of aquatic organisms will continue, especially due to the expansion and development of aquaculture, culture based fisheries, environment and fishery rehabilitation, and the advent of new technologies making it easier to move organisms, or their genetic material from place to place.

The way forward on introduced species
To prevent possible negative impacts of the introduction of an alien species, domestication of indigenous species is being considered and promoted in many areas. The environmental advantages of this are less disturbance of the environment and reduced risk of pathogen introduction. Often markets are already established and people are accustomed to local species. Domesticated species may also pose a risk (e.g. genetic erosion of local stocks), and may not meet the desired specifications/requirements. In such cases introduction of an alien species may be considered, as described in the Code of Conduct for Responsible Fisheries (Figure 8). FAO calls on governments, non-governmental organizations, and other stakeholders to report introductions to FAO for inclusion in the FAO Database on Introductions of Aquatic Species (DIAS). Improved information will be critical in this debate and in efforts to promote the responsible use of introduced species.
Figure 8. The decision making process for considering
| Box 1. The contribution of inland fishery resources to food security is certainly greatly under-reported because of the dispersed and informal nature of many fisheries. (FAO, 1999), For example: |
|
Brazil reported an inland capture of about 193 000 mt from all of its waters for 1991, but an independent estimate for the same year based on human population and fish consumption rates suggests about 319 000 mt for the Amazon basin portion of Brazil alone (Bayley, 1998) Ghana’s inland waters are dominated by Lake Volta (8 000 km2). Ghana reported a capture from all of its inland waters from 55 000 to 74 000 mt in recent years, but based on a partial frame survey, total production of Lake Volta alone is likely to be around 150 000 to 200 000 mt/year (de Graaf and Ofori-Danson, 1997) Cambodia has reported inland capture ranging from about 50 000 mt to 75 000 mt for the years 1984 - 1997; However, the actual range for the years 1994 to 1997 has been estimated at from 290 000 to 430 000 mt (van Zalinghe et al., 1998). Similarly, the largest annual catches reported to FAO by Thailand and Viet Nam in the period 1984-1997 were, respectively, 229 000 mt and 136 000 mt while estimates made by MRC (1992) and Jensen (1996) indicated catches of 303 000 mt and 190 000 mt, respectively. |
Table 1.
Top producers in 1998: Total aquaculture production (FAO FishStat Plus 2000)|
Country |
Production1 tonnes |
Production2 % total world |
Growth APR3 84-98, %.yr-1 |
Growth4 97-98, % |
Total value US $ 1,000 |
Unit value US $/kg |
||
|
China |
27 071 942 |
68.6 |
+ |
16.2 |
+ |
12.7 |
25 499 016 |
0.94 |
|
India |
2 029 619 |
73.8 |
+ |
11.2 |
+ |
9.0 |
2 222 789 |
1.09 |
|
Japan |
1 290 486 |
77.1 |
+ |
0.5 |
- |
3.7 |
4 126 039 |
3.20 |
|
Philippines |
954 512 |
79.5 |
+ |
5.5 |
- |
0.3 |
639 080 |
0.67 |
|
Indonesia |
814 090 |
81.6 |
+ |
7.2 |
+ |
4.7 |
2 149 508 |
2.64 |
|
Korea, RO |
796 632 |
83.6 |
+ |
1.2 |
- |
23.4 |
766 268 |
0.96 |
|
Bangladesh |
583 877 |
85.1 |
+ |
12.7 |
+ |
13.9 |
1 493 670 |
2.56 |
|
Thailand |
569 577 |
86.5 |
+ |
13.0 |
+ |
3.1 |
1 806 795 |
3.17 |
|
Vietnam |
537 870 |
87.9 |
+ |
12.3 |
+ |
5.7 |
1 356 724 |
2.52 |
|
Korea, DPR |
481 500 |
89.1 |
- |
2.9 |
- |
1.6 |
302 950 |
0.63 |
|
Total world |
39 430 834 |
100.0 |
+ |
11.0 |
+ |
9.4 |
52 458 185 |
1.33 |
Table 2.
Major effects of introduced species|
Benefits |
Problems |
|
Income generation |
Reduction or elimination of indigenous species |
|
Production increase |
Alteration of habitat |
|
Biological control |
Import of pathogens (diseases) |
|
Change in access to land and resources |
Table 3.
Most commonly introduced species (source: DIAS)|
Fish |
Crustacean |
Mollusc |
|
Common carp |
Giant river prawn |
Pacific cupped oyster |
|
Rainbow trout |
Red swamp crawfish |
Top shell |
|
Mozambique tilapia |
Giant tiger prawn |
American slipper-limpet |
|
Grass carp |
Kuruma prawn |
Golden apple snail |
|
Nile tilapia |
White leg prawn |
Smooth giant clam |
References Bayley, P, 1998. Aquatic biodiversity and fisheries management in the Amazon. Draft report prepared for FAO.